http://www.sciencepublishinggroup.com/j/cssp doi: 10.11648/j.cssp.20190801.11
ISSN: 2326-9065 (Print); ISSN: 2326-9073 (Online)
Demand-Side Management in Microgrids with the Presence
of Renewable Sources in Vietnam
Nguyen Minh Cuong
1, *, Nguyen Thi Dieu Huyen
2, Thai Quang Vinh
31
Electrical Faculty, Thai Nguyen University of Technology, Thai Nguyen City, Vietnam
2Department of Testing and Quality assurance, Thai Nguyen University of Technology, Thai Nguyen City, Vietnam 3
Institute of Information Technology, Vietnam Academy of Science and Technology, Hanoi City, Vietnam
Email address:
*
Corresponding author
To cite this article:
Nguyen Minh Cuong, Nguyen Thi Dieu Huyen, Thai Quang Vinh. Demand-Side Management in Microgrids with the Presence of Renewable Sources in Vietnam. Science Journal of Circuits, Systems and Signal Processing. Vol. 8, No. 1, 2019, pp. 1-10.
doi: 10.11648/j.cssp.20190801.11
Received: June 21, 2019; Accepted: July 11, 2019; Published: July 26, 2019
Abstract:
This paper proposes a general demand-side management strategy in microgrids with the presence of renewable sources. To apply proposed above strategy by electric price in Vietnam, it must be participated of photovoltaic and wind power generations and energy storage. An algorithm applied for this program is created by comparing amount of energy generating from generations and consumed by electric load. Amount of energy that must be bought from the grid or sells to it can be calculated by dispatching energy between hours that have the lowest electric price level and hours that have the medium and highest electric price levels. A case study that energy generating from generations is not equal energy consumed by load in hours having the medium and highest electric price levels is made more detailed in this paper. Algorithms to dispatch energy at any time to achieve the purpose of not buying electricity from the grid in above hours basing on electric price levels, efficiency of energy conversion, rated capacity of units and analysis of power flows in whole system. Results providing from algorithms are energy that must be bought from the grid or sell to the grid, instantaneous capacity of energy storage. Simulation results corresponding to this case study carried out in MATLAB 2018a present the meaning and feasibility of proposed contents.Keywords:
Demand-Side Management, Renewable Source, Microgrid, Photovoltaic Power Generation,Wind Power Generation, Hybrid System
1.
Introduction
Renewable sources have been implemented widely in electric power systems (EPS), where photovoltaic power generation (PVG) and wind generation (WG) are the most popular. These generations can be coupled in common DCbus or ACbus structure at each bus in EPS to become a microgrid. This microgrid can be operated in two ways: generating power from generations to EPS directly or being dispatched by any scenario as requirement of dispatchers [1-4].
In the first way, power generating to the grid varies continuously corresponding to the variation solar irradiance and wind speed [1]. This big disadvantage can be made difficult to dispatch power flow in whole EPS due to having to be absorbed big amount of power in daytime and or
shortage a big amount of power in night-time. In the second way, amount of power reacted upon the grid can be dispatched by demand-side management (DSM) programs to balance power generating from generations and demand of electric load in the range of considered time [5-9]. So, the second way is the expected method to operate but it requires the presence of energy storage (ES) with enough large rated capacity to adapt to the ability of charge or discharge as required. There are many kinds of DSM contents depending on different requirements or operating conditions.
electricity to sale for other purposes at commercial, service and living complex. Three levels can help to promote the electric consumption in the stage having the lowest price level and limiting it in stages having the medium and highest price levels [10-11]. Due to basing on electric price levels for buying or selling electricity in Vietnam to create DSM program, it changes the time to buy electricity from EPS or sell to EPS and makes different from previous researches.
A DSM program was proposed to apply in case of deficient energy [9] and a method to determine optimal capacity was proposed to apply in a microgrid with the presence of renewable sources [12]. In this paper, a DSM strategy in the specific condition of Viet Nam EPS is proposed to achieve the aim of not buying electricity from EPS in the medium and highest electric price levels. The next section will introduce a model of a microgrid using common DCbus structure with the presence of PVG, WG and ES. The relation of forecasted, controlled and power circuit blocks is also introduced to operate the microgrid by DSM programs. Moreover, a general DSM strategy will be proposed in the second section for two modes. In third section, a DSM program applied in a specific case study is proposed to determine power flows in whole system and amount of energy that must be bought from EPS or sell electricity to EPS. The fourth section will represent simulation results in the case study considered in the third section to illustrate the proposed DSM program. The last section will show some conclusions and contributions of this paper.
2.
General
DSM
Strategy
Applied
in
Viet
Nam
Electric
Power
System
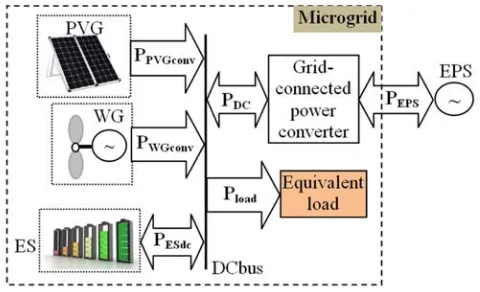
Power directions distributed whole system using common DCbus structure with the presence of PVG, WG, ES and EPS
are depicted in Figure 1 [7-9]. where:
PPVGconv and PWGconv are power flowsin one direction from
PVG and WG to DCbus,
PESdc is bidirectional power flow (discharge from ES to
DCbus and charge from DCbus to ES),
Pload is equivalent power value of load at DCbus (including
AC load converted to DCbus and DC load).
PDC (at DC side) and PEPS (at AC side) are power values at
two terminals of grid-connected power converter that are exchanged between DCbus and ACbus, where the relationship between PDC value and PEPS value depends on
value of conversion efficiency.
Figure 1. Distribution of power flows in the microgrid.
To achieve the above distribution of power flows as depicted in Figure 1, system harnessing hybrid generations and operated by DSM programs must be included three main blocks as represented in Figure 2 [9], [12-16].
To apply these blocks in Vietnam EPS, DSM programs must be adapted to requirements of electric price for buying and saling electricity. In Vietnam, electric price is divided into three levels: H for the highest level (including H1 and
H2), M for the medium level (including M1, M2 and M3) and L for the lowest level (including L1, L2 and L3) as described in Figure 3 [9-12].
Figure 3. The relation of stages and electric price in Vietnam.
Due to the difference of electric price, the considered cycle time (τ) must be from 0 to 24. The number of calculation steps is 27 and time for each step can be 0.5 or 1 [9, 12].
Total forecasted power received at DCbus at the ith step can be determined by (1):
Gconv PVGconv WGconv
P
(i)
=
P
(i)
+
P
(i)
(1)where, PPVGconv (i) is power received at DCbus at the ith step
from PVG,
PWGconv (i) is power received at DCbus at the ith step from
WG.
Total energy received at DCbus in H-stage, M-stage and L-stage in whole considered cycle time (τ) from generations can be determined by (2), (3), (4):
[
]
[
]
GconvH 1 GconvH 2
14 23
GconvH Gconv i Gconv i
i 12 i 21
E E
E P (i) P (i)
= =
=
∑
× ∆τ +∑
× ∆τ (2)[
]
[
]
[
]
GconvM 1 GconvM 3 GconvM 2 11GconvM Gconv i
i 6 E
20 25
Gconv i Gconv i
i 15 i 24
E E
E P (i)
P (i) P (i)
=
= =
= × ∆τ
+ × ∆τ + × ∆τ
∑
∑
∑
(3)[
]
[
]
GconvL1 GconvL 2
5 27
GconvL Gconv i Gconv i
i 1 i 26
E E
E P (i) P (i)
= =
=
∑
× ∆τ +∑
× ∆τ (4)Total energy consumed by load at DCbus in H-stage, M-stage and L-M-stage in whole considered cycle time (τ) can be determined by (5), (6), (7):
[
]
[
]
loadH1 GH 2
14 23
loadH load i load i
i 12 i 21
E E
E P (i) P (i)
= =
=
∑
× ∆τ +∑
× ∆τ (5)[
]
[
]
[
]
loadM 1 loadM 3 loadM 2 11loadM load i i 6
E
20 25
load i load i
i 15 i 24
E E
E P (i)
P (i) P (i)
=
= =
= × ∆τ
+ × ∆τ + × ∆τ
∑
∑
∑
(6)[
]
[
]
loadL1 loadL 2
5 27
loadL load i load i
i 1 i 26
E E
E P (i) P (i)
= =
=
∑
× ∆τ +∑
× ∆τ (7)Total energy received at DCbus in from generations and consumed by load can be determined by (8) and (9):
Gconv GconvH GconvM GconvL
E =E +E +E (8)
load loadH loadM loadL
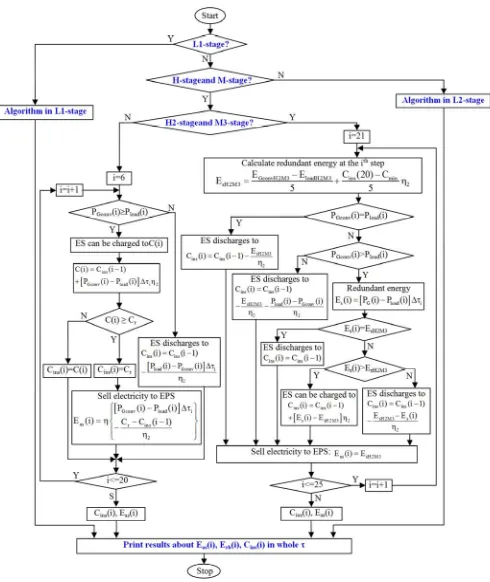
E =E +E +E (9) Basing on total energy that is able to generate from generations and be consumed by load in stages, a general DSM strategy is proposed as depicted in Figure 4.
Figure 4. Propose a general DSM strategy applied in Viet Nam electric power system.
3.
A
Case
Study
in
Proposed
General
DSM
Strategy
A case study is that energy generating from generations is higher than energy consumed by load in H-stage and M-stage. Rated capacity (Cr), instantaneous capacity (Cins) and
minimum capacity (Cmin) always satisfy (10) [9, 12]:
min r
min ins r
C 0.2C
C C C
=
≤ ≤
(10) Due to having power loss in the working process of all units in whole system (harnessing maximum power point, charge or discharge for ES, reacting power upon EPS). To
evaluate power loss in all branches, quantities relating to efficiency must be considered in the DSM program. They are
ηg1andηg2 (for PVG and WG), η2(for ES) and η(for
grid-connected branch).This research assumes that they are constant and do not distinguish power direction.
Corresponding to electric price levels, the DSM program will calculate total energy required to buy (Erb) and total
energy that is available to sell (Eas) in whole cycle. It can be
calculated economic function Zrb (to buy electricity) and Zas
(to sell electricity) by using (11) and (12). Value of Z function as depicted in (13) can help to evaluate the difference between ZrbandZas. If Z is negative, it means that
the DSM program makes benefit after dispatching power flows in whole system [9].
5 27 11 20 25 14 22
rb 1 rb rb 2 rb rb rb 3 rb rb
i 1 i 26 i 6 i 15 i 24 i 12 i 20
Z E (i) E (i) E (i) E (i) E (i) E (i) E (i)
= = = = = = =
= β
∑
+∑
+ β ∑
+∑
+∑
+ β ∑
+∑
(11)27
as as
i 1
Z E (i)
=
= β
∑
(12)rb as
Z=Z −Z (13)
where β1, β2 and β3 are values of electric price levels for buying electricity from EPS.
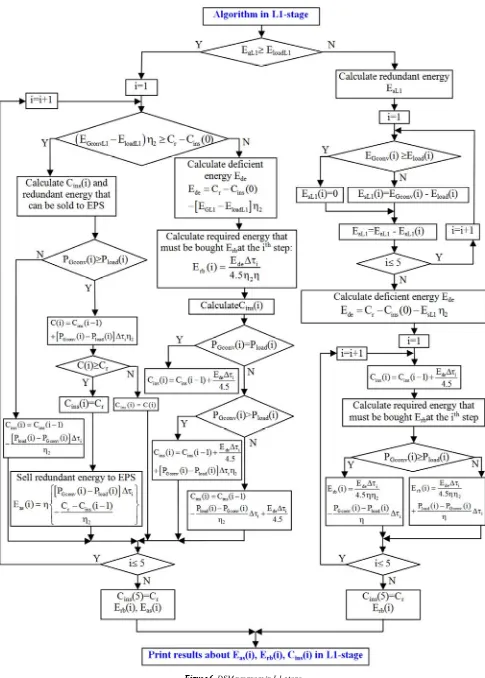
Figure 7. DSM program in L2-stage.
Where:
C(i) is the temporary variable for instantaneous capacity at the end of ith step,
∆τi is the scale of time step.
4.
Simulation
4.1. Simulation Parameters
Generations: rated power for PVG is 6.6 kW at standard test condition and rated power for WG is 8.5 kW.
Power received at DCbus from generations (PPVGconv and
PWGconv) is represented in Figure8. Total power received at
DCbus from generations and load power are represented in
Figure9. Figure 8. Power received at DCbus from generations.
P
o
w
e
r
fr
o
m
g
e
n
e
ra
ti
o
n
s
(
W
Figure 9. Total power received at DCbus from generations and requirement of load.
Values of energy received at DCbus from generations and demand of load in each stage are represented in Table 1.
Table 1. Values of energy for generations and load.
EGconv(kWh)
Eload (kWh) EGconvHM (kWh) EloadHM (kWh) EGconvL1 (kWh) EloadL1 (kWh)
151.4 161.95 124.15 96.65 15.95 60.2
Table 1 showed that total energy consumed by load is smaller than total energy generating from generations in H and M-stages and total energy consumed by load is larger than total energy generating from generations in L1-stages. Furthermore, total energy consumed by load is smaller than total energy generating from generations in whole considered cycle.
Value of quantities for efficiency: η2 = η = 0.95.
Rated capacity for ES is 400 kWh.
4.2. Simulation Results
Simulation process was carried out by using MATLAB 2018a tocompare the effectiveness in two modes: using the DSM program in the third section and not using the DSM program.
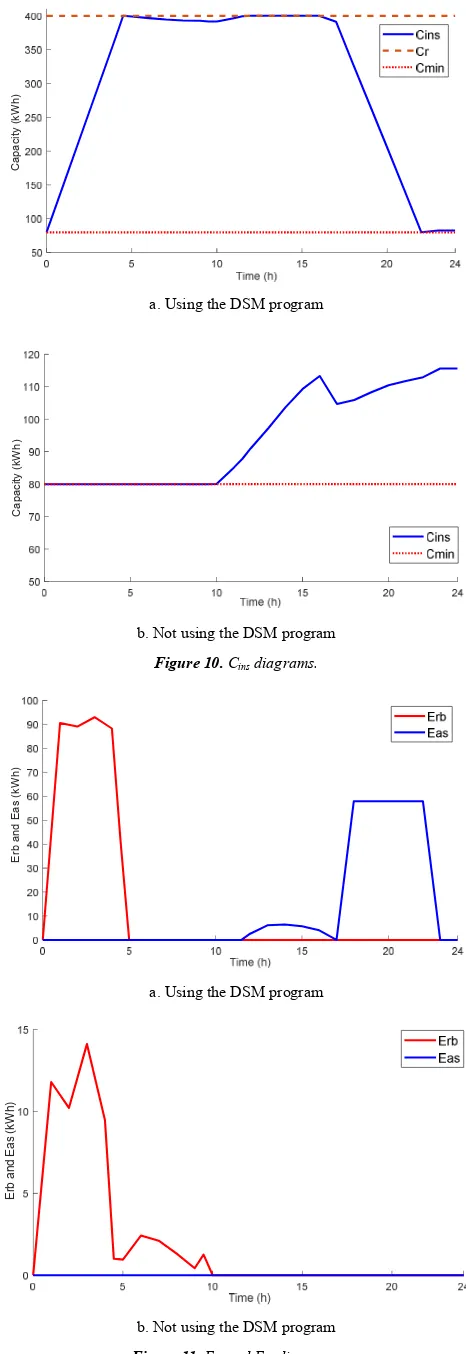
Simulation results about Cins characteristic in this case
study are shown in Figure 10. In Figure 10a, value of Cins
reached to Cr before finishing L1-stage and discharging to
Cmin before finishing M3-stage as requirements of the DSM
program. In Figure 10b, ES only charges when PGconv is
larger than Pload and discharges in its available capacity when
PGconv is smaller than Pload.
Diagrams representing Erb and Eas in two modes are shown
in Figure 11. In Figure 11a, the DSM program helped to buy electricity from EPS in L1-stage to meet the load demand and charge ES. Moreover, it was not bought electricity from EPS in H-stage and M-stage as the requirement of the DSM program. In Figure 11b, electricity can be bought from EPS at any stage to meet load demand.
a. Using the DSM program
b. Not using the DSM program
Figure 10. Cins diagrams.
a. Using the DSM program
b. Not using the DSM program
Figure 11. Erb and Eas diagrams.
Diagrams representing value of Zrb and Zas in two modes
are shown in Figure 12. Figure 12a showed that the DSM program worked very well to reduce economic function due to buying electricity in L1-stage to meet the load demand. Figure 12b showed that it took some money to buy electricity and did not have any profit by saling electricity. These results depict the advantage of the DSM program in the operating process for hybrid generations in half-isolation mode. The effectiveness of the DSM can be evaluated by the difference between cost for buying electricity and profit from saling electricity. Moreover, value of ∆Z is an important factor to compare the economic meaning corresponding to using the DSM program and not using the DSM program. Simulation results of economic functions are represented in Table 2.
a. Using the DSM program
b. Not using the DSM program
Figure 12. Zrband Zas diagrams.
Table 2. Economic factors.
Erb
(kWh) Eas
(kWh)
Zrb (x103
VNĐ)
Zas (x103
VNĐ)
Z (x103
VNĐ)
∆∆∆∆Z (x103
VNĐ)
DSM 402.1 314.1 403.8 507 -103.2
163.3
No DSM 55 0 60.1 0 60.1
We can see that the difference of Zrb and Zas is negative
when using the DSM program while the difference of Zrb and
Zas is positive when not using the DSM program. It means
that the DSM program upheld the effectiveness of dispatching power flows in whole system.
5.
Conclusion
This paper proposed a general DSM strategy to operate any microgrid with the presence of PVG, WG and ES in Viet Nam EPS. This strategy is based on forecasted quantities about the ability to generate power from generations and demand of load. Furthermore, a DSM program was proposed for a specific case study that has energy from generations higher than consumed energy of load in H-stage and M-stage. This program is based on the limitation of ES (maximum capacity that can be reached to charge and minimum capacity that can be discharged to) and electric price levels as prescribed by Vietnam EPS.
Simulation results represented the effectiveness of proposed DSM strategy and program. The program changed the time to interact power between generation side and EPS side. It also changed the time to charge or discharge in cases of using the DSM program or not using the DSM program. The effectiveness of the proposed program was depicted by economic functions for buying or saling electricity.
Contributions of this paper about the DSM strategy and the DSM program for a specific case study showed the economic and technical benefits when applying DSM into a microgrid with the presence of renewable sources. The DSM program helped to re-distribute power flows in whole system by electric price levels. It showed the feasibility of the DSM program to make schedule for all units and bring economic profit out when applying it into a real system. In the future, the DSM program can be continued to design experimental models to verify the proposed strategy.
References
[1] Masoud Farhoodnea, Azah Mohamed, Hussain Shareef, Hadi Zayandehroodi (2012), “Power Quality Analysis of Grid-Connected Photovoltaic Systemsin Distribution Networks”, IEEE Student Conference on Research and Development (SCOReD), electronic ISBN: 978-1-4673-5160-7, print ISBN: 978-1-4673-5158-4.
[2] Tao Zhou and Bruno François (2011), “Energy Management and Power Control of a Hybrid Active Wind Generator for Distributed Power Generation and Grid Integration”, IEEE Transactions on Industrial Electronics, Volume: 58, Issue: 1, print ISSN: 0278-0046, electronic ISSN: 1557-9948.
[3] Hicham Fakham, Di Lu, Bruno Francois (2011), “Power Control Design of a battery charger in a Hybrid Active PV generator for load following applications”, IEEE Transaction on Industrial Electronics, Vol. 58, Iss. 1, pp. 85-94.
[4] Yann Riffonneau, Seddik Bacha, Franck Barruel, and Stephane Ploix (2011), “Optimal Power Flow Management for GridConnected PV Systems with Batteries”, IEEE transactions on sustainable energy, Vol. 2, No. 3.
[5] Felix Iglesias Vazquez, Peter Palensky, Sergio Cantos (2012), "Demand Side Management for Stand-Alone Hybrid PowerSystems Based on Load Identification", Energy, 5, 4517, ISSN: 0360-5442.
[6] Zafar Iqbal, Nadeem Javaid, Saleem Iqbal, Sheraz Aslam, Zahoor Ali Khan, Wadood Abdul, Ahmad Almogren, and Atif Alamri (2018), “A Domestic Microgrid with Optimized Home Energy Management System”, Energy, 11, 1002, ISSN: 0360-5442.
[7] Andrzej Ozadowicz (2017), “A New Concept of Active Demand Side Management for Energy Efficient Prosumer Microgrids with Smart Building Technologie”, Energy, 10, 1771, ISSN: 0360-5442.
[8] Olivier Gergaud, Gaël Robin, Bernard Multon, Hamid Ben Ahmed (2003), “Energy Modeling of a Lead-Acid Battery within Hybrid Wind/Photovoltaic Systems”, European Power Electronic Conference, ISBN: 90-75815-07-7.
[9] Nguyen Minh Cuong, Thai Quang Vinh, Le Tien Phong (2018), “Demand-Side Management Program with A New Energy Strategy for Photovoltaic and Wind Power Generation System in Viet Nam”, International Journal of Research and Scientific Innovation (IJRSI), ISSN 2321–2705 Volume V, Issue X.
[10] http://npc.com.vn/bieugiabandien.aspx
[11] https://www.evn.com.vn/c3/evn-va-khach-hang/Gia-ban-dien-theo-gio-9-81.aspx
[12] Nguyen Minh Cuong, Thai Quang Vinh, Vu Phuong Lan, Le Tien Phong (2018), “Optimal Energy Storage Sizing in Photovoltaic and Wind Hybrid Power System Meeting Demand-Side Management Program in Viet Nam”, International Journal of Research and Engineering, ISSN: 2348-7860 (O) | 2348-7852 (P), Vol. 5 No. 9.
[13] Yuan-Kang Wu, Chao-Rong Chen, and Hasimah Abdul Rahman (2014), “A Novel Hybrid Model for Short-Term Forcasting in PV Power Generation”, International Journal of Photoenergy, ISSN: 1110-662X Volume 2014.
[14] Imane Drouiche, Aissa Chouder, Samia Harrouni (2013), “A dynamic model of a grid connected PV system based on outdoor measurement using Labview”, 3rd International Conference on Electric Power and Energy Conversion Systems, IEEE Xplore, ISBN: 978-1-4799-0688-8.
[15] Mehryar Parsi (2016), “Daily solar radiation forecasting using historical data and examining three methods”, IOSR Journal of Mechanical and Civil Engineering (IOSR-JMCE), ISSN: 2278-1684, Volume 13, Issue 5.