Zaruk N., Maslova V., Fuchs C., Avdeev M.
Factor analysis of the competitiveness of agricultural products in the Eurasian Economic
Union (EAEU)
This article discusses the outcomes of a quantitative analysis of the competitiveness of grain and its recycling in the countries-members of the Eurasian Economic Union (EEU) through econometric panel data models. The analysis is based on the data of public authorities’ statistics of the countries-members of the
EEU, as well as the United Nations Comtrade Database which is a repository of official international trade statistics. The results of the analysis allow to assess the level of competitiveness of produced agro-food products in the countries-members of the EEU and determine the extent to which various factors affect it. The research conclusions can be used to develop and adjust the agreed with the agro-food policy in the
EEU.
Key words: agriculture, grain and products of its processing, competitiveness, prices, production volumes, export, import, price competitiveness factor, integral indicator of competitiveness, Eurasian Economic Union (EAE), factor analysis, panel data models.
JEL classification: R1; C21; C23.
Authors:
1) Maslova Vlada
Doctor of economic science, professor maslova_vlada@mail.ru
Federal State Budgetary Scientific Institution "Federal Research Center of Agrarian Economy and Social Development of Rural Areas - All-Russian Research Institute of Agricultural Economics", Moscow, Russian Federation
2) Zaruk Natalya
Doctor of economic science, professor zaruk84@bk.ru
Federal State Budgetary Scientific Institution "Federal Research Center of Agrarian Economy and Social Development of Rural Areas - All-Russian Research Institute of Agricultural Economics", Moscow, Russian Federation, Russian State Agrarian University – Moscow Timiryazev Agricultural Academy
3) Fuchs Clemens
Professor
University of Applied Sciences Neubrandenburg, Germany cfuchs@hs-nb.de
4) Avdeev Mikhail Ph. D. of economic science avdeevmihail@mail.ru
Federal State Budgetary Scientific Institution "Federal Research Center of Agrarian Economy and Social Development of Rural Areas - All-Russian Research Institute of Agricultural Economics", Moscow, Russian Federation
Introduction
The Eurasian Economic Union (EAEU) was established in 2015 and now consists of five member
states: the Republic of Armenia, the Republic of Belarus, the Republic of Kazakhstan, the Kyrgyz Republic
and the Russian Federation. One of the primarily goals of the EAEU is the development of a coordinated
agricultural policy-making and implementation mechanism between the member states, including measures
to ensure the competitiveness of produced agricultural products.
One of the main challenge for the economy of the countries-members of the EEU is to increase the
competitiveness of products. This is the most important thing in recent years due to the growing up
globalization and cross-country competition. The main subject of this research focus on identify and assess
the main factors affecting the competitiveness of agricultural products and food in the countries-members of
the EEU. The subject of the study is a factor analysis of the competitiveness of agri-food products.
As a tool for the study of factor analysis of the competitiveness of agri-food products, the
methodology for determining the integral index of competitiveness for various types of agro-food products
for all the countries of the EEU was used, as well as methods of correlation regression analysis using the
package of applied econometric programs Eviews 9.5.
The most important segment of the agro-food market of the EEU is the grain market. The share of
the countries-members of the EEU in the world production of cereals and leguminous crops in 2016 was
5.8%. At the same time, in the world wheat production, the share of the EEU countries in 2016 reached 12%.
In the world wheat trade, the share of the countries-members of the EEU is even higher - 17%. Therefore, as
the object of factor analysis of competitiveness, the grain market is chosen, as a priori competitive. In this
research will be examine the following types of agri-food products - wheat, barley, corn for grain, wheat
flour and pasta.
Theoretical aspects of quantitative assessment of competitiveness
Competitiveness is a complex concept, which includes a large number of significantly different
objects and factors.
The development of the theory of competitiveness is associated with the names of such foreign
scientists as M. Porter, M. Enright, B. Ballas, K. Freeman, J. Proudman, S. Redding, J. Lafaye and others.
Among domestic scientists studying the problems of competitiveness, G.L. Azoeva, I.A. Dubrovina, Т.P.
Rozanov, R.A. Fatkhutdinova, etc. Depending on the aspects of the study of competitiveness, there are
different approaches to its essential content.
Methodical approaches to the assessment of competitiveness largely depend on the levels (micro,
meso, macro) on which the study is conducted. These levels include a study of the competitiveness of the
country, the economy, the industry, the firm and the product. For example, domestic and domestic products,
individual enterprises, regions can compete on the domestic market; on the external market - the state, their
blocks, large companies.
Accordingly, a set of tools depends on the research object, which will allow for a quantitative
assessment of competitiveness. In the economic literature, the following are the main different methods for
assessing the competitiveness of goods:
- methods for assessing competitiveness based on indices of comparative advantage (the index of B.
- a technique based on the evaluation of goods from the position of their conformity for satisfying
consumer qualities (the Rosenberg model);
- method of comparison with the ideal value characterizing the property of the goods (model with an
ideal point);
- an estimation of competitiveness of the goods on the basis of calculation of an integrated indicator.
These methods can be used to some extent to assess the competitiveness of agri-food products.
However, in our opinion, in the case when the analysis of product competitiveness at the macrolevel is
carried out, the most expedient is the use of the methodology for calculating the integral index.
The competitiveness of agri-food products is determined from the economic point of view as the
ability to compete in terms of price conditions and qualitative parameters while ensuring sustainable growth.
To evaluate the competitiveness of the EEU countries for various types of agri-food products, we
propose a methodology for assessing the competitiveness of products based on the calculation of an
integrated indicator that includes five factors: average producer price (AVPij), export price (EX_Pi), output
(Qij), share export in production volume (EX_Qij), price competitiveness factor (Com_Cij), defined as the
ratio of average prices of agricultural producers and import prices (IM_P), taking into account imports s
duties, customs duties, VAT and excise duties.
To ensure the comparability of the calculations, it is necessary to normalize each i – kind of product
for each j - country-member EEU using the following maximising equation:
(1)
(2)
(3)
(4)
(5)
To calculate the integral indicator of competitiveness, these indicators are divided into two groups:
the first group of indicators determines the competitiveness of products based on price
the second group of indicators characterizes the competitiveness of products based on the production
volumes and the share of exports (Qij, EX_Qij): the products become more competitive with an increase of
these indicators.
Accordingly, the calculations are based on these multidirectional factors. To ensure their
comparability, an additive model of deterministic factor analysis is used.
On the basis of normalized factors, an integral indicator of competitiveness is determined for each
type of agro-food products of the EAEU states (INT_Cij).
(6)
The higher the integrated indicator of competitiveness, the more competitive the products are, both
on the domestic and foreign markets. The proposed methodology includes not only the calculation of the
integral index of the competitiveness of products of the EEU countries, but also the use of the
correlation-regression analysis methodology in order to determine the degree of influence of each of these factors on the
weighted average integral indicator of competitiveness.
Data and methods
During the research, a set of methods was used, including a monographic study of the subject of
research, expert assessments, statistical methods, econometric modeling. Through the econometric model,
the main quantitative relationships between the analyzed economic phenomena and processes will be
described.
The annual data of the state statistical offices of the EEU countries and the international trade
database UN Comtrade on the volume of production, export-import operations and prices for wheat, barley,
corn, wheat flour and pasta by the EEU countries for the period 2010-2016.
The main factor affecting competitiveness is the price factor, therefore when constructing the
econometric model, we will use spatial and temporal statistics, including the various types of prices that have
been formed in the five states of the EEU during the period 2014-2016:
- average producer prices (AVPij);
- average export prices (EX_Pij);
- coefficients of product price competitiveness (Com_Cij), representing the ratio AVPij and IM_Pij.
In addition to the price parameters, the competitiveness of agri-food products is affected by two
more factors: the volume of its production (Qij) and exports, which directly correlate with prices.
To determine the dependence of the integral index of the competitiveness of agri-food products on
factors affecting the formation of product competitiveness, a multifactorial analysis of the listed variables is
carried out.
The first factor investigated is the average producer prices for grain and products of its processing.
In 2016, the minimum level of producer prices for each of the types of products considered was
for corn for grain - 114 US dollars per ton, for wheat flour - USD 211 per ton, for pasta - USD 386 per ton.
The highest prices for wheat, barley and wheat flour were registered in the Republic of Armenia (USD 231
per ton, USD 212 for t, and 341 US dollars per ton, respectively).
The second factor is export prices.
In addition to the cost of the goods, the export price includes transportation, insurance, indirect taxes,
etc. In 2016, the most competitive export prices on the domestic market of the EAE for wheat and wheat
flour were in the Republic of Belarus - $ 131 per ton and $ 177 US per tonne, respectively. For barley and
pasta - in the Republic of Kazakhstan ($ 95 per ton and $ 618 per tonne). By corn for grain - in the Russian
Federation ($ 929 per ton).
The third factor is the coefficient of price competitiveness.
The analysis of the coefficient of price competitiveness made it possible to determine that the
Republic of Belarus, the Republic of Kazakhstan and the Russian Federation possess the greatest competitive
advantages among the EEU states.
However, examining only the price factor, the second problem is the problem of production and
export volumes, which can be minimal at a sufficiently competitive price, which does not increase the
overall index of product competitiveness.
The next investigated factor is the volume of grain production and its processing products. In 2016
gross grain harvest in the EEU reached a record value of 151 million tons. This high figure was mainly due
to the increase in grain production in the Russian Federation and the Republic of Kazakhstan in recent years,
both due to the increase in grain yields, and due to growth of acreage.
The main grain producers in the EEU are Russia and Kazakhstan, their combined share in total
wheat production in 2016 was 96.4%, barley and maize for grain - 92%.
In recent years, the gross wheat harvest in the EEU has fluctuated significantly: from 51 million tons
(in 2012, which was due to a catastrophic drought in Russia) to almost 92 million tons in 2016, i.е. growth in
2012-2016. amounted to almost 80% (Figure 1). As a result, the EEU took the third place in the world for
wheat production (after the EU - 145 million tons and China - 129 million tons). The maximum growth in
production was recorded in Russia - in 2016 it was 37% more than the average for the previous five years
(from 2011-2015), in Armenia the increase was almost 17%, in Kazakhstan - 2%. In Belarus and
Source: compiled from the statistical services of the member states of the EEU
Figure. 1. Gross collections of wheat, barley, maize for grain and volumes production of flour and pasta in the EAE in 2012-2016, thousand tons
Gross collections of barley in 2012-2016. as a whole, the EEU increased by 30% and amounted to 23
million tons in 2016. The largest increase in production was registered in Armenia, Kazakhstan, Kyrgyzstan.
In Belarus, on the contrary, gross barley harvests in the period under review decreased by 25%.
High growth rates of gross revenues were observed for maize for grain (an increase of 70%), the
volume of its production in the EEU in 2016 reached 17.5 million tons.
The flour production in the EEU during the period under review decreased by 4.5% and amounted to
14.2 million tons in 2016. The decline in production was mainly due to a reduction in its production in the
Russian Federation.
Volumes of production of macaroni products in the EEU rose by 3% and reached 1.2 million tons.
The leader in terms of the volume of grain production and its processing products among the states
of the EEU is the Russian Federation.
The fifth factor affecting the competitiveness of products is the volume of exports, or more precisely,
the share of exports in production volumes, which is the export concentration index.
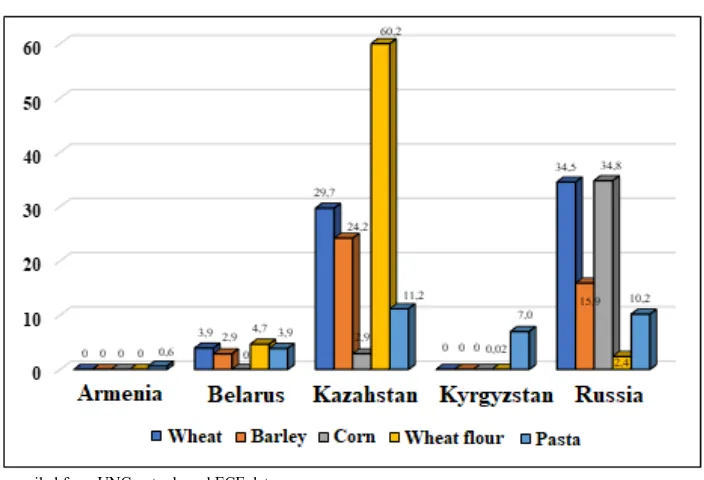
If to compare the share of exports in production, then in 2016 the highest share of exports in the
volume of production for wheat was formed in the Russian Federation (35%), barley in the Republic of
Kazakhstan (24%), maize for grain - in the Russian Federation (35%), flour - in the Republic of Kazakhstan
(60%), for pasta - in the Republic of Kazakhstan and the Russian Federation (11% and 10% respectively)
Source: compiled from UNComtrade and ECE data
Figure 2. Share of exports in the volume of production of wheat, barley, maize for grain flour and pasta in the Member States of the EEA 2016, %
Integral indicators of the competitiveness of grain and products of its processing on the domestic
market of the EEU, determined on the basis of average producer prices, export prices, production volumes
and share of export of products, price competitiveness coefficients are presented in table 1. For wheat,
barley, maize for corn and pasta the most a high index was established in the Russian Federation, and wheat
flour in the Republic of Kazakhstan. The Republic of Armenia and the Kyrgyz Republic in the market of
grain and products of its processing are not competitive.
Table 1. Integral indicator of the competitiveness of grain and products of its processing in the member states of the EAEC in 2016, %
Product Armenia Belarus Kazakhstan Kyrgyzstan Russian
Federation
Wheat 0 62,0 73,0 0 100
Barley 0 55,2 88,3 0 100
Corn 0 4,2 17,1 0 100
Wheat flour 0 52,4 100 0 35,2
Pasta 0 25,3 70,6 0 100
Regression analysis of factors of competitiveness of grain and products of its processing
The main producers of grain and products of its processing in the EEU are Russia, Kazakhstan and
Belarus. Therefore, the object of correlation-regression analysis of competitiveness factors will be the
In order to compare the above mentioned EEU countries on the criterion of the competitiveness of
grain and products of its processing, and also to determine the degree of influence of this or that factor on the
integral indicator of competitiveness, we will construct econometric models. These models for each product
type in the whole of the EEU will take the following form:
(7)
b0 – the conditional start of the regression model (constant); bi – coefficient of pure regression;
INT_w – the weighted average integral indicator of competitiveness;
RFij, RBij, KZij – integral indicators of competitiveness of i products in Russia, Belarus, Kazakhstan,
respectively;
ɛ — random error of the regression model.
As a dependent variable in the presented model is the weighted average indicator of the
competitiveness of grain and products of its processing in general for the EEU - INT_w. To determine this
indicator, it is necessary to calculate the integral indicators of competitiveness (RFij, RBij, KZij) for i type of
product j of the country, using the formula 6. Then we calculate the weighted average indicator - INT_w, as
weights used the share j of the state in the total volume of gross grain production in the EEU.
The degree of influence of price determinants, factors of the volume of production and export of grain on the
integral indicator of its competitiveness, will be estimated on the basis of the coefficients of pure regression
(bi) for j state and i type of output of the grain market using the models of multiple regression of the species:
(8)
INT_C—integral indicator of competitiveness;
AVP (Average price) — average producer prices of grain products in the EEA member states, in US dollars;
EX_P (Export prices) — export prices for grains and products of its processing in the Member States
of the EEA, in US dollars;
Com_C (Coefficient of competition) — coefficient of price competitiveness;
Q—volumes of cereal production from the member states of the EAEC, thousand tons;
EX_Q—the share of grain exports from the EEA member states in total production.
The construction of models of competitiveness and evaluation of their parameters were carried out in
the package of applied econometric programs Eviews 9.5.
At the initial stage, consider the level of competitiveness of grain and its processing products in
Russia, Kazakhstan and Belarus, to compare the competitive advantages of each country. To this end, we
calculate the average integral competitiveness index (INT_w) for the whole of the three countries of the
Next, consider the degree of influence of various factors on product competitiveness in the EEA
states.
Wheat
The model of multiple linear regression, reflecting the dependence of the integrated indicator of
wheat competitiveness in the EEU on the parameters of the competitive advantages of individual EAEC
countries, will take the following form:
Source. The values of standard errors are indicated in parentheses at a 5% level of statistical significance.
Parameters of the obtained econometric model show that the most competitive in the period of
2010-2016. is wheat produced in the Russian Federation (the largest coefficient of pure regression with variable
RF), the Republic of Kazakhstan ranks second in terms of competitiveness, and the Republic of Belarus on
the third. The existing ranking of the countries in question is determined by the high level of wheat
production and exports in the Russian Federation.
Further, using the methods of correlation-regression analysis, we estimate the strength and direction
of the influence of price and non-price factors on the competitiveness of wheat in each individual country of
the EEU. The results of the analysis are presented in Table 2.
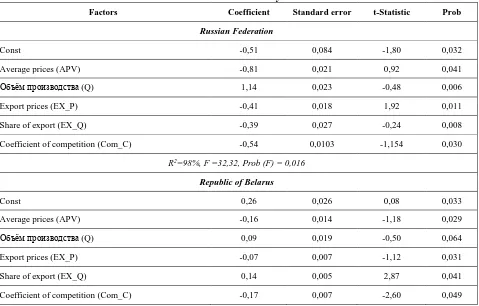
Table 2. Results of regression analysis of competition factors of wheat in Russia, Kazakhstan and Belarus in 2010–2016 years
Factors Coefficient Standard error t-Statistic Prob
Russian Federation
Const -0,51 0,084 -1,80 0,032
Average prices (APV) -0,81 0,021 0,92 0,041
Объём производства (Q) 1,14 0,023 -0,48 0,006
Export prices (EX_P) -0,41 0,018 1,92 0,011
Share of export (EX_Q) -0,39 0,027 -0,24 0,008
Coefficient of competition (Com_C) -0,54 0,0103 -1,154 0,030
R2=98%, F =32,32, Prob (F) = 0,016
Republic of Belarus
Const 0,26 0,026 0,08 0,033
Average prices (APV) -0,16 0,014 -1,18 0,029
Объём производства (Q) 0,09 0,019 -0,50 0,064
Export prices (EX_P) -0,07 0,007 -1,12 0,031
Share of export (EX_Q) 0,14 0,005 2,87 0,041
R2=90,5%, Prob F = 0,017
Republic of Kazahstan
Const -0,66 0,044 -1,50 0,037
Average prices (APV) 0,48 0,022 2,18 0,008
Объём производства (Q) 0,83 0,027 0,16 0,009
Export prices (EX_P) -0,32 0,16 5,16 0,00
Share of export (EX_Q) 0,08 0,019 0,48 0,0065
Coefficient of competition (Com_C) -0,09 0,022 -0,37 0,0073
R2=84,7%, F (s) =5,55, Prob F = 0,1
The data of Table 2 show that the level of wheat competitiveness in the Russian Federation is most
influenced by such factors as production volumes and average producer prices. Gross harvest of wheat in
farms of all categories in the period 2010-2016. increased by almost 80% - from 41.5 million tons to 73.3
million tons. Along with the growth in production, volumes of wheat supply to foreign markets also
increased - in relative terms, this figure more than doubled. However, the outstripping growth in wheat
production (supply), compared with the dynamics of demand in domestic and foreign markets, exerts
pressure on both domestic and export prices of agricultural producers. In particular, average domestic wheat
prices reached peak values in 2013 - $ 244 per ton, in subsequent periods the price steadily decreased and in
2016 it was $ 132. The same trend is observed in the formation of export prices for Russian wheat. This
strengthens Russia's competitive position in foreign markets. The current level of prices for Russian wheat is
much lower than in the leading countries by the volume of exports of this crop in the world. For example, the
average export price for wheat produced in Russia in 2016 was 166.5 dollars, and in the USA - 224.9 dollars,
in Canada - 228.5 dollars.
In the Republic of Belarus the greatest influence on the competitiveness of wheat is exerted by such
factors as domestic producer prices and the share of exports in the total volume of gross production. In
particular, the prices of Belarusian agricultural producers of wheat reached the highest values in 2013 - USD
233 per ton and in subsequent years fell steadily, reaching USD 127 in 2016. In this case, gross collections of
wheat are increasing. Thus, in 2016, the increase compared to 2010 was 34.5%. Also, the volumes of export
deliveries and export share grew: almost 19 times - from 5 to 91.6 thousand tons, and the share of exports
increased from 0.28% to 3.9%.
In Kazakhstan, the most important factors of wheat competitiveness are the average producer prices,
export prices and production volumes. From 2013, the negative dynamics of average producer prices
remains, the level of which has almost halved by 2016, as well as export prices - a decrease of about 36%.
According to the price criteria, Kazakhstan has the greatest competitive advantages among all the countries
of the EAEC. In the period 2010-2016. Kazakh agricultural producers have increased the volume of wheat
production from 9.6 to 15 million tons. However, against the background of growth in production volumes,
the share of exports is declining. In particular, if in 2010 the volume of wheat deliveries from Kazakhstan to
exports amounted to 7.5 million tons - about 76% of gross harvest, then by 2016 this indicator decreased to
4.4 million tons - 30% of the total volume of production.
Barley
The model of multiple linear regression, reflecting the dependence of the integral indicator of barley
competitiveness in the EEU on the parameters of the competitive advantages of the countries studied, will
take the form:
Source. The values of standard errors are indicated in parentheses at a 5% level of statistical significance.
The parameters of the obtained econometric model show that the most competitive in the period of
2010 – 2016. is the barley produced in the Russian Federation (the largest coefficient of pure regression with
variable RF), the second place is occupied by the Republic of Kazakhstan, the third is the Republic of
Belarus (table 3). The ranking of the countries under consideration is also due to the high level of wheat
production and exports in the Russian Federation.
Table 3. Results of regression analysis of competition factors of barley in Russia, Kazakhstan and Belarus in 2010–2016 years
Factors Coefficient Standard error t-Statistic Prob
Russian Federation
Const 0,16 0,043 0,38 0,008
Average prices (APV) -0,28 0,01 3,46 0,02
Объём производства (Q) 0,32 0,02 1,43 0,021
Export prices (EX_P) -0,11 0,007 2,00 0,01
Share of export (EX_Q) 0,07 0,009 -0,80 0,046
Coefficient of competition (Com_C) -0,21 0,008 -2,75 0,04
R2=91%, F =20,99, Prob (F) = 0,016
Republic of Belarus
Const 0,13
Average prices (APV) -0,26 0,011 -1,98 0,011
Объём производства (Q) 0,07 0,014 -1,84 0,013
Export prices (EX_P) -0,09 0,006 -1,57 0,018
Share of export (EX_Q) 0,077 0,006 1,21 0,028
Coefficient of competition (Com_C) -0,16 0,006 -2,57 0,005
R2=90,5%, Prob F = 0,017
Republic of Kazakhstan
Average prices (APV) -0,22 0,019 -0,62 0,056
Объём производства (Q) 0,11 0,016 0,35 0,074
Export prices (EX_P) -0,11 0,014 -0,07 0,095
Share of export (EX_Q) 0,095 0,014 1,20 0,028
Coefficient of competition (Com_C) -0,009 0,012 -0,02 0,099
R2=84,7%, F (s) =5,55, Prob F = 0,01
On the basis of the data in Table 3, it can be concluded that in the Russian Federation the most
significant factors of barley competitiveness are the volumes of production, the average producer prices and
the coefficient of price competitiveness. In particular, during the period 2010-2016. the volume of barley
production in Russia has more than doubled - from 8.35 to 18 million tons, which is about 80% of the
production of this crop as a whole for the countries of the EEU in question. The dynamics of producer prices
of barley is characterized by a negative trend, as in the case of wheat. The average prices for Russian barley
reached the maximum values in 2013 - 216 US dollars per ton, by the end of 2016 prices fell almost twofold
- to $ 116. At the same time, it should be noted that the prices for barley of Russian agricultural producers
are the largest among all the countries of the EEU. The current level of export prices allows Russia to
confidently compete with the leading countries in terms of barley exports in the world - France, Australia
and Germany. Export prices for barley in these countries in 2016 were 182, 195, 173 US dollars,
respectively, which is much higher than export prices for Russian barley, the level of which in 2016 was $
148.
In the Republic of Belarus, the average producer prices and the price competitiveness factor have the
greatest impact on the competitiveness of barley. The least significant factor is the volume of production. For
the period 2010-2016. The gross harvest of barley in farms of all categories declined by almost 38%, from
1.97 million tons to 1.23 million tons.
In Kazakhstan, the competitiveness of barley is also influenced mainly by price factors. The current
level of domestic and export prices for barley in Kazakhstan is the lowest in the grain market of the Unified
Energy System ($ 77 per tonne and $ 95 per tonne, respectively). The coefficient of price competitiveness
does not significantly affect the level of competitive advantages of barley in the internal market of the
EAEC.
Corn
The model of multiple linear regression, reflecting the dependence of the integrated indicator of
corn's competitiveness in the EEU on the parameters of the competitive advantages of individual countries of
the Union, will take the form:
Parameters of the obtained econometric model show that the most competitive in the period of 2010–
2016. is maize produced in the Russian Federation (the highest coefficient of pure regression with variable
RF), the second place is occupied by the Republic of Kazakhstan, the third is the Republic of Belarus (table
4). The ranking of the countries under consideration is also due to the high level of maize production and
exports in the Russian Federation.
Table 4. Results of regression analysis of competition factors of corn in Russia, Kazakhstan and Belarus in 2010–2016 years
Factors Coefficient Standard error t-Statistic Prob
Russian Federation
Const -2,09 0,135 -1,55 0,037
Average prices (APV) -0,08 0,002 -3,18 0,019
Объём производства (Q) 0,08 0,003 3,06 0,02
Export prices (EX_P) -0,11 0,000 3,22 0,019
Share of export (EX_Q) 0,37 0,012 -3,16 0,019
Coefficient of competition (Com_C) -0,39 1,85 -3,22 0,019
R2=91%, F =20,99, Prob (F) = 0,016
Republic of Belarus
Const 0,25 0,01 2,53 0,024
Average prices (APV) -0,13 0,000 2,33 0,026
Объём производства (Q) 0,05 0,000 2,47 0,025
Export prices (EX_P) -0,12 0,000 -2,68 0,023
Share of export (EX_Q) 0,05 0,0045 -0,84 0,056
Coefficient of competition (Com_C) -0,33 0,010 -6,18 0,01
R2=90,5%, Prob F = 0,017
Republic of Kazakhstan
Const 1,77 0,018 7,06 0,009
Average prices (APV) -0,80 0,00 -2,72 0,022
Объём производства (Q) 0,09 0,00 -1,09 0,047
Export prices (EX_P) -0,26 0,00 -3,19 0,019
Share of export (EX_Q) 0,063 0,003 1,69 0,034
Coefficient of competition (Com_C) -0,34 0,017 0,23 0,0085
R2=84,7%, F (s) =5,55, Prob F = 0,1
The data in Table 4 show that the price competitiveness ratio has the greatest impact on the level of
competitiveness of maize in the Russian Federation. The level of average producer prices of corn in Russia
in 2016 was about 125 US dollars per ton. The second and third place in terms of the degree of impact on the
The volume of production of this crop from 3.1 million tons in 2010 to 15.3 million tons in 2016, i.е. almost
5 times, allowed not only to satisfy domestic demand for corn for grain, but also to increase the volume of
supplies of this type of products to foreign markets in the period from 0.3 to 5.32 million tons. The current
level of prices allows maintaining strong competitive positions corn grain, produced in Russia, both on
domestic and export markets for agri-food products.
In the Republic of Belarus and Kazakhstan maize for grain is produced in small volumes - in 2016,
740 and 762 thousand tons, respectively. In the period from 2010-2016. there is a steady growth in the
volumes of gross harvest of this crop. In particular, in Belarus for the period under review, the growth was
34.3%, in Kazakhstan - 65%. Due to the comparatively small volumes of corn production and export in
Kazakhstan, its competitiveness is influenced by factors: average producer prices, whose level is the lowest
among all the countries of the EEU, as well as the ratio of domestic prices to corn prices (the price
competitiveness factor). The Republic of Belarus has formed the least competitive level of both domestic and
export prices.
Wheat flour
The model of multiple linear regression, reflecting the dependence of the integral index of the
competitiveness of wheat flour in the EEU on the parameters of competitive advantages of individual
countries of the Union, will take the form:
Source. The values of standard errors are indicated in parentheses at a 5% level of statistical significance.
Parameters of the obtained econometric model show that the most competitive in the period of
2010¬¬¬-2016. is the wheat flour produced in the Republic of Kazakhstan (the largest coefficient of net
regression with variable KZ), the second place is occupied by the Republic of Belarus, the third is the
Russian Federation (table 5). The existing ranking of the countries under consideration is due to the high
level of export of wheat flour in Kazakhstan, which ranks second after Turkey in terms of the volume of
supplies of this type of products to foreign markets.
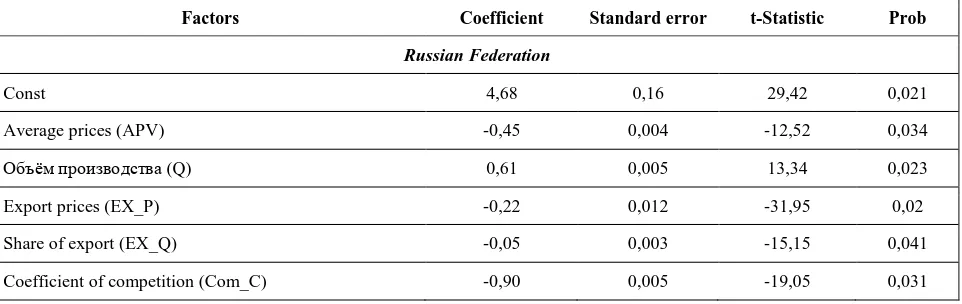
Table 5. Results of regression analysis of competition factors of wheat flour in Russia, Kazakhstan and Belarus in 2010–2016 years
Factors Coefficient Standard error t-Statistic Prob
Russian Federation
Const 4,68 0,16 29,42 0,021
Average prices (APV) -0,45 0,004 -12,52 0,034
Объём производства (Q) 0,61 0,005 13,34 0,023
Export prices (EX_P) -0,22 0,012 -31,95 0,02
Share of export (EX_Q) -0,05 0,003 -15,15 0,041
R2=91%, F =20,99, Prob (F) = 0,016
Republic of Belarus
Const 0,21 0,07 2,79 0,022
Average prices (APV) -0,21 0,008 2,77 0,022
Объём производства (Q) -0,08 0,008 -2,65 0,023
Export prices (EX_P) -0,04 0,007 0,41 0,041
Share of export (EX_Q) 0,02 0,004 0,53 0,047
Coefficient of competition (Com_C) -0,19 0,004 -4,23 0,015
R2=90,5%, Prob F = 0,017
Republic of Kazakhstan
Const -3,33 0,052 -0,84 0,045
Average prices (APV) -0,55 0,041 2,58 0,024
Объём производства (Q) 0,24 0,025 -3,48 0,018
Export prices (EX_P) -0,43 0,046 1,22 0,044
Share of export (EX_Q) 0,91 0,024 -2,31 0,026
Coefficient of competition (Com_C) 0,21 0,056 0,02 0,019
R2=84,7%, F (s) =5,55, Prob F = 0,1
The share of exports is the determining factor in the competitiveness of wheat flour. The republic
ranks second in the world in terms of exports of this type of product, whose volume in 2016 amounted to 2.4
million tons, and the share of exports to production amounts to more than 60% of the total production. Also,
Kazakhstan has the most competitive producer price level for wheat flour - USD 210 per ton, while in
Turkey the price is USD 305.2 per ton, in Germany - USD 346.5 per ton. Low the level of export prices
allows us to compete on this criterion not only with the EEU states, but also with world leaders in the export
of this type of product.
In the Republic of Belarus, the main factors of competitiveness are the average producer prices and
the coefficient of price competitiveness. On the territory of the Republic, about 5% of the volume of wheat
flour produced in the EEU is produced. The share of exports is also relatively small - only about 5% of the
total volume of production. At the same time, export prices are the most competitive among all the state of
the EEU - US $ 176 per ton.
In the Russian Federation, the most significant factors in the competitiveness of wheat flour are the
volume of production - 67.4% of the total volume in the EEU countries in question (in 2016 - 9.9 million
tonnes), the price competitiveness factor, and the average producer prices. In general, during the period the
volume of wheat flour production in Russia has not changed significantly and stably at the level of 10
million tons per year, while the share of flour exports is characterized by quite small values - about 3% of the
total production volume (in 2016 - 237 thousand tons., m). The decrease in the cost of wheat grains put
pressure on the prices of wheat flour producers, in particular, prices on the domestic market in the period
at export prices, which have declined by almost 40% over the past 5 years, from USD 492 to USD 321 per
ton. Russia's export prices for wheat flour are roughly on par with the prices of the largest exporters of this
type of product.
Pasta
The model of multiple linear regression, reflecting the dependence of the integrated indicator of the
competitiveness of pasta in the EEU on the parameters of competitive advantages of individual countries of
the Union, will take the form:
Source. The values of standard errors are indicated in parentheses at a 5% level of statistical significance.
Parameters of the obtained econometric model show that the most competitive in the period of 2010–
2016. are the pasta produced in the Russian Federation (the largest coefficient of pure regression with
variable RF), the second place is occupied by the Republic of Kazakhstan, the third - by the Republic of
Belarus (table 6). The ranking of the countries under consideration is also due to the high level of production
of pasta in the Russian Federation.
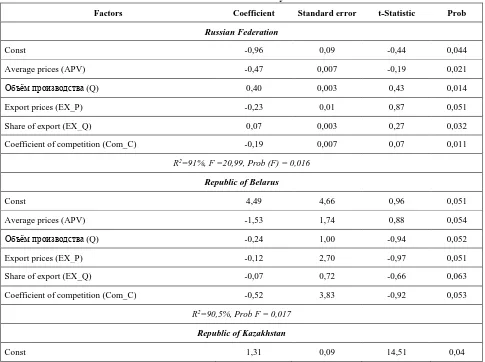
Table 6. Results of regression analysis of competition factors of pasta in Russia, Kazakhstan and Belarus in 2010–2016 years.
Factors Coefficient Standard error t-Statistic Prob
Russian Federation
Const -0,96 0,09 -0,44 0,044
Average prices (APV) -0,47 0,007 -0,19 0,021
Объём производства (Q) 0,40 0,003 0,43 0,014
Export prices (EX_P) -0,23 0,01 0,87 0,051
Share of export (EX_Q) 0,07 0,003 0,27 0,032
Coefficient of competition (Com_C) -0,19 0,007 0,07 0,011
R2=91%, F =20,99, Prob (F) = 0,016
Republic of Belarus
Const 4,49 4,66 0,96 0,051
Average prices (APV) -1,53 1,74 0,88 0,054
Объём производства (Q) -0,24 1,00 -0,94 0,052
Export prices (EX_P) -0,12 2,70 -0,97 0,051
Share of export (EX_Q) -0,07 0,72 -0,66 0,063
Coefficient of competition (Com_C) -0,52 3,83 -0,92 0,053
R2=90,5%, Prob F = 0,017
Republic of Kazakhstan
Average prices (APV) -0,75 0,09 7,02 0,03
Объём производства (Q) 0,21 0,05 -6,29 0,01
Export prices (EX_P) -0,13 0,05 -2,32 0,03
Share of export (EX_Q) -0,33 0,05 -4,85 0,01
Coefficient of competition (Com_C) -0,64 0,06 -10,92 0,02
R2=84,7%, F (s) =5,55, Prob F = 0,1
In the Russian Federation, the main influence on the competitiveness of pasta is provided by such
factors as average producer prices, production volume and export prices. In the period 2010-2016. in Russia
there are no high fluctuations in the volume of production of pasta by years, the value of this indicator is at
the level of 1 million tons per year. At the same time there is an increase in exports of this type of product. In
particular, if in 2010 the share of exports was 4% of the total volume of production of pasta, then by 2016
this figure was more than 10%. Since 2013, there has been a drop-in export prices for Russian pasta, from $
1403 to $ 1040 per ton. The current level of prices allows Russia to compete on price criteria with world
leaders in the export of pasta, except Turkey, where the price for this type of product was 2016 US $ 508 per
ton.
In Belarus, due to the small volume of production of pasta - in 2016, 44 thousand tons, the price
factors influence the competitiveness.
The share of the Republic of Kazakhstan is about 10% of the total volume of production of pasta in
the EAE (in 2016 - 152.4 thousand tons), while the share of exports is about 11% (in 2016 - 17 thousand
tons). In accordance with this, the competitiveness of pasta produced in Kazakhstan is determined mainly by
price factors. At the same time, the most competitive level of prices has developed not only inside the market
of the EAES, but also in the world market for pasta.
The competitiveness of products on the world market was assessed by comparing the prices of
domestic producers with the prices of producers in the countries which are recognized as global leaders in
exports of these products. This analysis was conducted for three countries: Belarus, Kazakhstan and Russia
(table 7).
Table 7. Average producer prices for agricultural products in the EAEU and in the leading export countries in the world in 2016, USD/t
Products Belarus Kazakhstan Russia leading export countries in the world
Wheat 214 105 132
Russia USA Australia Canada Ukraine
132 143 206 174 129
Barley 174 77 115
Australia France Ukraine Russia Germany
188 138 118 115 139
Maize
(corn) 560 114 124
USA France Hungary Ukraine Russia
Source: authors calculations based on FAOStat data
Average prices of domestic producers for wheat, barley and maize (corn) in 2016 in Kazakhstan and
Russia were lower than in the countries which are recognized as global leaders in exports of these products.
At the same time, prices of domestic producers for these crops in Belarus were higher than in the countries
which are recognized as global leaders in exports of these products.
General conclusions and proposals
Thus, in general, the production of grain and its processing in the three EEU countries (Russia,
Kazakhstan, Belarus) is competitive. In Russia - wheat, barley, maize for grain and pasta; in Kazakhstan -
wheat flour. The main factors for increasing competitiveness over the past three years were the decrease in
domestic producer prices, as well as the growth in production volumes. That allows in general the countries
of the EEU in the future to take a significant share in the international market of grain and its processing
products.
It is forecasted that the export of Russian grain can reach 38.8 million tons by 2020, up to 48.3
million tons by 2030. In Kazakhstan, in 2020, grain exports will be 5.3 million tons and wheat flour - 2.5
million tons. The share of Belarus in world grain exports is insignificant, but by 2020 it can increase grain
production up to 10 million tons, which will also increase its export opportunities.
In order to further increase the level of production and competitiveness for grain and products of
grain processing in the EEU member states, it is necessary to develop and introduce quality seed, more
intensive use of new low-cost technologies, improvement of price relations in the grain market and state
support for the grain subcomplex, harmonization of domestic requirements for quality grain with foreign,
expansion of flour exports and products of deep grain processing, development of internal and external
infrastructure and the transport and logistics system of the grain market in the long run. To conclude, a
sustainable strategy for the development of grain exports needs to be established in the Eurasian Economic
Union.
References
1. Gafarova, E.: Modeling the dynamics of the regional investment in fixed capital by regions of the
Russian Federation. Socio-economic and technical systems: research, design, optimization (4), 4-8
(2007).
2. Maslova, V.: Lending in the agroindustrial complex: state, problems, solutions. AIC:Economics,
management. (9), 28-38 (2017).
3. Smutka, L., Spicka, J., Ishchukova, N., Selby, R.: Agrarian import ban and its impact on the Russian
and European Union agrarian trade performance. Agricultural Economics, vol.62, no. 11, pp. 493-506,
4. Svatos, M., Smutka, L., Ishchukova, N.: The position of agriculture in the Russian Federation -the last
two decades development overview. Agricultural Economics, vol. 60, no.11, pp. 489-502, (2014) ISSN
1805-9295.
5. Spicka, J.: Investment Activity of Meat Processing Companies in the Czech Republic. In: Loster, T;
Pavelka, The 9th International Days of Statistics and Economics, Prague, Czech Republic, pp.
1570-1580. (2015).
6. Zaruk, N.: Stages of development of investment process in Russian agriculture. Agricultural scientific
journal. (1), 69-74 (2016).
7. Zaruk, N., Tagirova, O.: the Role of financial-credit mechanism in terms of import substitution. Niva
Povolzhya. 1 (34), 105-113 (2015).