Sampling Options for Farmers to Detect Insects in
Stored Grain
Dr Gregory J. Daglish
Agri-Science Queensland Innovation Opportunity
This publication has been compiled by Dr Gregory J. Daglish of Agri-Science Queensland, Department of Agriculture and Fisheries.
© State of Queensland, 2016
The Queensland Government supports and encourages the dissemination and exchange of its information. The copyright in this publication is licensed under a Creative Commons Attribution 3.0 Australia (CC BY) licence.
Under this licence you are free, without having to seek our permission, to use this publication in accordance with the licence terms.
You must keep intact the copyright notice and attribute the State of Queensland as the source of the publication. Note: Some content in this publication may have different licence terms as indicated.
For more information on this licence, visit http://creativecommons.org/licenses/by/3.0/au/deed.en
Summary
Increasingly, Queensland farmers are choosing to store grain longer on farm, and many farmers are investing in new silos to increase storage capacity. This trend is driven mainly by the desire of farmers to manage their harvest logistics rather than seeking to maximise profit. The problem is that
increasing on-farm storage comes with an increasing risk of insect infestation. There is an urgent need, therefore, for appropriate sampling methods to help farmers manage this risk and minimize marketing delays. Ideally, they should be simple, safe, cost effective and easy to interpret. The project aim was to investigate such options and it had three deliverables: a review of the relevant peer-reviewed literature, preliminary sampling data from farm trials in Queensland, and feedback from farmers and stakeholders on sampling needs and preferences of farmers. The literature review highlighted the value in direct sampling of grain for insects and the use of probe traps in the grain bulk. It also highlighted the need for locally generated trial data, because of the need for data that are relevant to local storage conditions. A successful pilot study was completed on two farms in southern Queensland. A series of recommendations was developed and knowledge gaps requiring further research were identified. Three industry meetings provided opportunities to highlight the urgent need for sampling methods for farmers, to present results of the field study and to receive industry
Table of contents
Background………2
Project objectives……….2
Methodology………..…2
Results……….3
Conclusions/Significance/Recommendations………..5
Key messages………5
Where to next?...6
Budget summary………6
Images
Image 1 – Grain sieve and probe trap used in sampling study on two farms in southern Queensland………..7Tables
Table 1 - Sampling program for stored grain insects on two farms in southern Queensland….7 Table 2. Analysis of trap catch from probe traps in silos on the low infestation farm…………..7Table of figures
Figure 1 – When grain beetles were detected in sieved grain samples, more beetles tended to be detected in the bottom sample than the top sample………..8Figure 2 – When beetles were detected in probe traps, traps inserted near the grain surface tended to catch more beetles than traps inserted deeper………..8
Figure 3 –
When beetles were detected in probe traps, traps inserted via the top hatch tended to
catch more beetles than traps inserted via the side hatch………..9
Figure 4. Temperature measured half-hourly in the headspace and grain bulk in a silo containing barley………9
Sampling Options for Farmers to Detect Insects in Stored Grain, Department of Agriculture and Fisheries (2016) 2
1. Background
Increasingly, farmers in Queensland are choosing to store grain longer on farm, and many farmers are investing in new silos to increase storage capacity. This trend is driven mainly by the desire of farmers to manage their harvest logistics rather than seeking to maximise profit. The problem is that increasing on-farm storage comes with an increasing risk of insect infestation. There is a wide range of insect species that can infest stored grain and jeopardise market access. Australia has a legislated nil tolerance to live insects in export grain, i.e. no live insects are permissible during sampling at points of export, and this high standard tends to apply to domestic markets as well. Detection of live insects in grain destined for domestic or export markets results in costly delays while grain is
fumigated to eliminate insect infestations. In addition, many farmers store planting seed which is also subject to insect infestation, resulting in physical losses and reduced seed germination and vigour. There is an urgent need, therefore, for appropriate sampling methods to help farmers manage this risk and minimize marketing delays. Simple, safe, cost effective sampling options that are easy to interpret will enable growers to make informed decisions about pest management.
2. Project Objectives
The aim of this project was to explore options for farmers to detect insects in stored grain. There were three specific deliverables:
• Review of the international literature on the use of various insect detection methods and their potential use by farmers.
• Preliminary data from sampling trials on Queensland farms.
• Feedback from farmers and stakeholders on sampling needs and preferences of farmers
3. Methodology
3.1 Review of international literature
A large body of research has been published in peer-reviewed scientific journals. A literature review was undertaken to identify key papers and information relevant to the project aim.
3.2 Preliminary data from sampling trials on Queensland farms 3.2.1 Farms
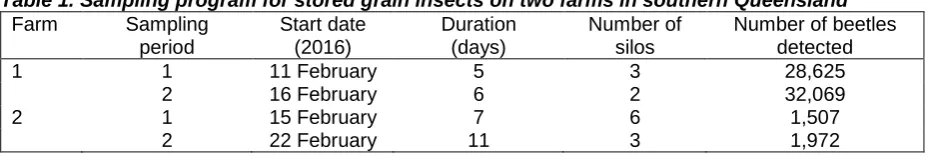
Trials were conducted on two farms (Farms 1 and 2) in the southern Darling Downs during February and March 2016 (Table 1). Identification of the farms and development of the study protocol were done in consultation with a departmental Senior Development Agronomist (Mr Philip R. Burrill). Each farm had silos containing barley or wheat which had been harvested in late 2015. The number of silos studied and length of time each silo could be studied was negotiated with the farmers. All silos had greater than 100 t storage capacity except for one seed silo on Farm 1 which had 13 t of storage capacity.
Like most farm silos in Queensland, each silo was cylindrical with a conical top (roof) and base. There was an out-loading hatch at the bottom of each silo (bottom hatch) and two hatches on the silo roof. There was an in-loading hatch at the top of roof (upper centre hatch) and a side hatch lower down (upper side hatch). It was through these three points of access that grain samples were taken for sieving or insect traps were inserted in the grain bulk (Image 1).
3.2.2 Probe trap samples
were two traps: one to trap beetles 0-28 cm from the grain surface (shallow trap) and another to trap beetles 28-56 cm from the grain surface (deep trap).
Trapping occurred twice on each farm but not simultaneously because of logistical constraints on each farm (Table 1). Trap samples were inspected in the laboratory where the number and identity of the insects were recorded. Generally, because of the larger than expected number of trapped beetles, samples were stored in alcohol until they could be examined. Insects were allocated to six groups:
Tribolium castaneum(red flour beetle),Rhyzopertha dominica(lesser grain borer),Sitophilus species
(rice or maize weevils),Cryptolestes species(flat grain beetles),Oryzaephilus surinamensis(saw toothed grain beetle) or other beetles. The ‘other beetles’ were minor pests includingTyphaea
stercorea(hairy fungus beetle).
3.2.3 Sieved grain samples
Samples of grain were taken from the bottom and top of each silo and sieved for insects on the same day insects were emptied from the probe traps (see above). The bottom sample (2 L) was obtained by briefly opening the hatch at the bottom of the silo and collecting the grain as it fell from the silo. The top sample (4 L) was produced by combining two 2 L sub-samples taken from the upper side hatch and the upper centre hatch. Sieved grain samples were inspected in the laboratory where the number and identity of the insects was determined as described above.
3.2.4 Grain temperature and moisture
Grain temperature and moisture were measured because they are important factors affecting the behaviour and ecology of grain insects. Grain moisture content was measured using an HE50 moisture meter (Germany) on grain taken from a depth of 45 cm from the top of the grain bulk at the beginning of the study. Grain temperature was measured 15 and 45 cm below the grain surface via the upper side and upper centre hatches using a k-type thermo-couple and a Digitech QM1601 thermometer (Australia). Grain temperature was measured when the probe traps were emptied.
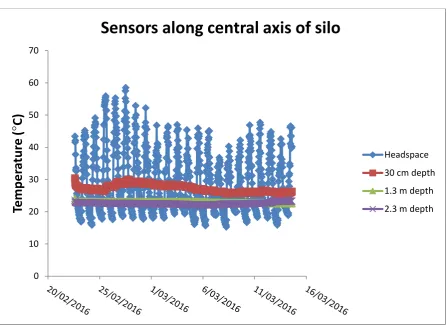
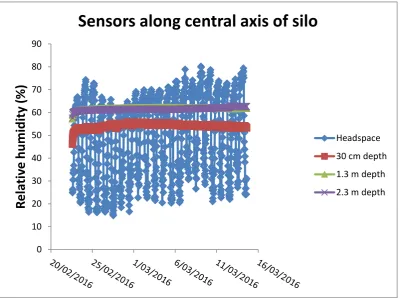
Limited temperature and humidity monitoring was done inside three silos at Farm 2 providing information on temperature and humidity variation in relation to depth within the grain bulk. This occurred at half-hourly intervals for 3 weeks using an OPI monitoring system (Canada).
3.3 Feedback from farmers and stakeholders on sampling needs and preferences of farmers
Three industry meetings in the first 6 months of 2016 provided opportunities to raise the issue of the need for sampling options for farmers to detect insects in stored grain, and to seek feedback from those attending.
4. Results
4.1 Review of international literature
A review was completed on 21 scientific papers about field studies on trapping, grain sampling or both. The oldest of these papers was published in 1986 (White and Loschiavo 1986 ‘Effects of insect density, trap depth, and attractants on the capture ofTribolium castaneum(Coleoptera:
Tenebrionidae) andCryptolestes ferrugineus(Coleoptera: Cucujidae) in stored wheat’Journal of
Economic Entomology79, 1111-1117) and the most recent was published in 2016 (Aulicky et al. 2016
‘Trapping of internal and external feeding stored grain beetle pests with two types of pitfall traps: a two-year field study’Plant Protection Science52, 45-53). Most papers reported studies in North America (15) and the remaining papers were based on studies from Europe (5) and Australia (1).
Sampling Options for Farmers to Detect Insects in Stored Grain, Department of Agriculture and Fisheries (2016) 4 tools. It is important to base industry recommendations on sound scientific data, and so data relevant to Queensland storage conditions (including environment factors and storage type) are needed. Only one Australian paper was reviewed (White. 1988. Field estimates of population growth rates of
Tribolium castaneum(Herbst) andRhyzopertha dominica(F.) (Coleoptera: Tenebrionidae and
Bostrychidae) in bulk wheat.Journal of Stored Product Research24, 13-22) but this paper, although it provides valuable ecological information, is based on a sampling study in Queensland which used methods unlikely to be used by farmers.
Two major conclusions were drawn from the literature review. First, probe traps should be evaluated as well as some form of grain sampling. Second, farm studies in Queensland are required because both storage type and environmental conditions are likely to differ greatly from those reported in the published studies from North America and Europe.
4.2 Preliminary data from sampling trials on Queensland farms
Over 64,000 stored grain beetles were detected during the study (Table 1), with beetles detected on both farms and in every silo investigated. For the purpose of interpreting the results, Farm 1 could be classified as a high infestation farm and Farm 2 could be classified as a low infestation farm. On farm 1, some of the probe traps captured many thousands ofT. castaneumresulting in traps becoming congested. While identifying and counting theT. castaneumin these traps was relatively easy, smaller species were more difficult to find and count. Despite the limited scale of this pilot study some analysis of the results is possible. The study generated a large amount of data and only key analyses using parts of the data-set are presented here.
Grain samples were taken from the bottom and the top of silos. In silos in which live beetles were detected in sieved grain samples, the bottom and top grain samples yielded on average 78 and 20% of the beetles respectively (Figure 1). This was despite the top sample having twice as much grain (4 L) as the bottom sample (2 L).
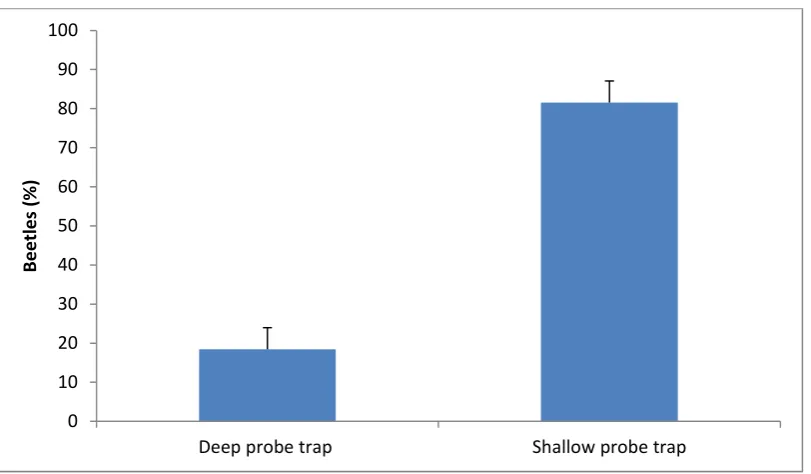
Probe traps were inserted into the grain bulk via the upper side hatch and the upper centre hatch, and at each location one trap was placed near the surface (shallow) and another deeper down (deep). In silos in which any beetles were detected in the probe traps, the shallow and deep traps captured on average 82 and 18% of the beetles respectively (Figure 2) and the traps inserted via the upper side and upper centre hatches captured on average 24 and 76% of the beetles respectively (Figure 3).
It is possible that the usefulness of sampling and trapping may vary between pest species, but it is not possible to confirm this at this stage without further field data. In the meantime, data from Farm 2 which had much lower levels of infestation can provide some insights. In practice, we want farmers to monitoring grain soon after harvest by sieving grain samples or by using probe traps. Having one high infestation farm and one low infestation generated a large data-set to analyse but the low infestation farm might provide a better indication of the performance grain sieving and probe trapping for detection of beetles at low population levels. Table 2 shows the same general trends shown in Figures 2-3 for all beetle species, and forT. castaneumonly andCryptolestesspecies only.
Initial grain temperatures at 15 and 45 cm below the grain surface were favourable for insects (25-34°C) as was grain moisture content at 45 cm below the grain surface (10-12%). Automatic loggers were used to monitor temperature and humidity in some silos (e.g. Figures 4 and 5). Temperature and humidity varied widely in the headspace reaching potentially lethal levels in the middle of the day. In contrast, temperature and humidity was much more stable in the grain bulk. Beetles are likely to avoid the grain surface during this time of extreme high temperature and low humidity, potentially impacting on the usefulness of visual inspection for beetles on the grain surface.
4.3 Feedback from farmers and stakeholders on sampling needs and preferences of farmers
The farmers on whose properties the sampling study was done belong to the Allora-Clifton Grower Group, and the farm sampling study was included in the agenda of the 15 March 2016 meeting of the group. Dr Greg Daglish discussed the need for sampling methods for farmers and the results of the study focussing sieving grain samples and using probe traps. There was general agreement among the farmers that there was a need for insect detection methods for farmers and further research was warranted.
Dr Daglish spoke about the project at a Grower Update organised by the Grains Research and Development Corporation (GRDC) and held at Chinchilla on 22 June 2016. He presented a talk entitled ‘Using insect traps to find and control pests early’ to an audience of over 100 grain growers, agronomists and other stakeholders, based on the pilot sampling study done in the project. A paper based on this talk is available on the GRDC website, and GRDC has also issued a Northern Region eNewsletter article entitled ‘Tips for early detection of pests in silos’.
Although project results were not presented in detail, Dr Daglish highlighted the need for sampling options for farmers during a talk entitled ‘Update on the ecology of rusty grain beetle (Cryptolestes
ferrugineus) at the Australian Grain Protection Conference in Melbourne on 24 June 2016.
5. Conclusions/Significance/Recommendations
There are many beetle species that can infest stored grain and at least five pest groups were detected in the pilot study. From a scientific perspective, knowing the identity and exact numbers of beetles in grain samples or probe traps is valuable. From a grower perspective, however, the presence of any beetles in stored grain is a problem, affecting market access or the quality and quantity of planting seed.
This pilot study focussed on two simple methods that could be used by growers to detect pests in stored grain, and the following recommendations are based on the results.
• Sieving of grain samples and using probe traps in the grain bulk are useful.
• If sieving grain is to be limited to one location, then a sample from the bottom of the silo is preferable to one from the top of the silo.
• Probe traps should be inserted into the grain bulk so that the top of the trap is level with the grain surface.
• If trapping is to be limited to one location then inserting the probe trap into the grain through the upper centre hatch is preferable to inserting it through the upper side hatch.
• Probe traps should be inserted once silos are full, and inspected regularly for insects (e.g. monthly) beginning the day after trap placement.
• If visual inspection of the grain surface for beetles is done as well, then early morning may be the best time for this because insects may avoid the surface during the middle of the day when very high temperature and low humidity are possible in surface grain.
6. Key Messages
• A pilot study in southern Queensland demonstrated that combining the use of probe traps in the top of a silo with sieving a grain sample from the bottom was an effective insect detection method.
• Probe traps inserted near the grain surface tended to catch more beetles than traps inserted deeper.
• Probe traps inserted into the grain peak via the upper centre hatch tended to catch more beetles than traps inserted via the upper side hatch.
• Traps should be checked after 1 day initially to avoid clogging if there is a heavy infestation, and less frequently thereafter (e.g. monthly) if few or no beetles are detected.
Sampling Options for Farmers to Detect Insects in Stored Grain, Department of Agriculture and Fisheries (2016) 6
7. Where to next
The project represents a first step towards providing farmers with the ability to monitor for grain insects, but more research is needed to before this can be achieved. Two simple methods available to farmers are sieving a grain sample drawn from the bottom of a silo or using probe traps inserted into the top grain bulk through via the hatch in the silo roof. The ability to detect any grain insects is an advantage for farmers but recommendations on how to use these methods needs a sound scientific basis. Several questions need answers:
• What is the relative effectiveness of sieving and trapping for detecting different insect species? o Stored grain can be infested by a range of pests, so there is the potential for differences
in behaviour and ecology to influence detection using the two methods.
• Are the results from the pilot study applicable to other regions or other times of the year?
o The study was done in the southern Darling Downs during over a relatively short period of time spanning summer and autumn, but grain is stored over large geographic range and usually over more than one season.
• What does it mean if one beetle is detected or many are detected, and is the answer the same soon after harvest or later during storage?
o Grain may be stored for many months allowing time for colonisation by pests, and subsequent population build-up. Also, sieving and trapping will yield adults but other developmental stages (eggs, larvae or pupae) may go undetected.
A large project run over several years is needed so that monitoring can be conducted on replicated farms over whole seasons. A large project needs funding support from the GRDC or other funding organisation. Alternatively, specific aspects of the information needed could be investigated in smaller externally funded projects including postgraduate projects.
8. Budget Summary
The 6 month project ran from 1 January to 30 June 2016 with an allocated project budget of $10,000 together with a 20% in-kind commitment from a Principal Research Scientist (Dr Daglish). It was anticipated that 40% of the budget would be spent on casual laboratory support, 30% on travel and 30% on operating. However, because of the much higher than expected numbers of beetles detected during the pilot farm study, the majority of the budget needed to be spent on casual laboratory support for Dr Daglish. Farmers would not be expected to count all beetles detected through sieving or
Image 1 – Grain sieve and probe trap used in sampling study on two farms in southern Queensland
Table 1. Sampling program for stored grain insects on two farms in southern Queensland Farm Sampling
period
Start date (2016)
Duration (days)
Number of silos
Number of beetles detected
1 1 11 February 5 3 28,625
2 16 February 6 2 32,069
2 1 15 February 7 6 1,507
2 22 February 11 3 1,972
Table 2. Analysis of trap catch from probe traps in silos on the low infestation farm.
Species Upper side hatch Upper centre hatch
Deep trap Shallow trap Deep trap Shallow trap All beetles species 17.3 ± 20.5a 131.7 ± 124.4b 87.7 ± 80.0bc 848.3 ± 712.9c
Tribolium castaneum 0.3 ± 0.6a 1.3 ± 1.5ab 4.3 ± 3.5c 4.3 ± 0.6c
Cryptolestesspecies 0.7 ± 0.6a 2.0 ± 2.7ab 5.7 ± 3.5bc 22.0 ± 16.1c
Sampling Options for Farmers to Detect Insects in Stored Grain, Department of Agriculture and Fisheries (2016) 8 Figure 1 – When grain beetles were detected in sieved grain samples, more beetles tended to be detected in the bottom sample than the top sample.
Figure 2 – When beetles were detected in probe traps, traps inserted near the grain surface tended to catch more beetles than traps inserted deeper.
0 10 20 30 40 50 60 70 80 90 100
Bottom sieved grain sample (2 L) Top sieved grain sample (4 L)
Be
et
le
s
(%
)
0 10 20 30 40 50 60 70 80 90 100
Deep probe trap Shallow probe trap
Be
et
le
s
(%
Figure 3 – When beetles were detected in probe traps, traps inserted via the top hatch tended to catch more beetles than traps inserted via the side hatch.
Figure 4. Temperature measured half-hourly in the headspace and grain bulk in a silo containing barley.
0 10 20 30 40 50 60 70 80 90
Side hatch probe trap Top hatch probe trap
Be
et
le
s
(%
)
0 10 20 30 40 50 60 70
Te
m
pe
ra
tu
re
(
°
C)
Sensors along central axis of silo
Sampling Options for Farmers to Detect Insects in Stored Grain, Department of Agriculture and Fisheries
(2016) 10
Figure 5. Relative humidity measured half-hourly in the headspace and grain bulk in a silo containing barley.
0 10 20 30 40 50 60 70 80 90