Naik et al. World Journal of Pharmaceutical and Medical Research
A MODIFIED REVERSE PHASE LIQUID CHROMATOGRAPHIC METHOD
DEVELOPMENT AND VALIDATION FOR THE FLUOXETINE IN BULK AND DOSAGE
FORMS
Ramavathu Ravi Naik*, Ch. M. M. Prasada Rao and D. Dhachinamoorthi
Department of PA & QA, QIS College of Pharmacy, Ongole-523272.
Article Received on 20/06/2018 Article Revised on 01/07/2018 Article Accepted on 22/07/2018
INTRODUCTION
Fluoxetine is a selective serotonin reuptake inhibitor (SSRI) antidepressant. Fluoxetine affects chemicals in the brain that may be unbalanced in people with depression, panic, anxiety, or obsessive-compulsive symptoms. Fluoxetine is used to treat major depressive disorder, bulimia nervosa (an eating disorder), obsessive-compulsive disorder, panic disorder, and premenstrual dysphoric disorder (PMDD).
Fluoxetine is sometimes used together with another medication called olanzapine (Zyprexa) to treat manic depression caused by bipolar disorder. This combination is also used to treat depression after at least 2 other medications have been tried without successful treatment of symptoms.
After extensive literature survey it was proved that very few methods were reported for the estimation of
Fluoxetine hydrochloride individually or in combination by RP-HPLC [4-22] but few methods had been reported for simultaneous estimation of these two drugs. So we attempted to develop an accurate, rapid, precise, stable, sensitive and economically viable liquid chromatographic method for the simultaneous determination of selected drugs in the present research.
MATERIALS AND METHODS
Equipment used
The chromatographic separation was performed on Agilent 1120 compact liquid chromatographic system integrated with a variable wavelength programmable UV detector and a Rheodyne injector equipped with 20l fixed loop. A reverse phase C18 [Zorbax 100-5 column,
250mm x 4.6mm] was used. Elico SL-210 double beam UV visible spectrophotometer and Axis AGN204-PO electronic balances were used for spectrophotometric determinations and weighing purposes respectively.
Reagents and chemicals
Pharmaceutical grade pure fluoxetine HCl gift samples were procured from Mylan Laboratories, Hyderabad. Marketed formulation Tablets with dose of 20 mg of fluoxetine HCl was procured from local market (Prozac 20 mg by Lilly). HPLC grade Acetonitrile and Water were procured from Merck specialties private limited, Mumbai.
Chromatographic conditions
Zorbax-C18 column 5m [250mm x 4.6mm] was used for
the chromatographic separation at a detection wave length of 230 nm. Mobile phase with a composition of Phosphate buffer pH 7 and Acetonitrile in a ratio of 25:75 v/v was selected for elution and same mixture was
ISSN 2455-3301
WJPMR
AND MEDICAL RESEARCH
www.wjpmr.com*Corresponding Author:Ramavathu Ravi Naik
Department of PA & QA, QIS College of Pharmacy, Ongole-523272.
ABSTRACT
A modified reverse phase liquid chromatographic method was developed and validated for the A new gradient reverse Phase High Performance Liquid chromatographic method development for the determination of Fluoxetine HCL tablet dosage form. The chromatographic separation was achieved on a Thermo Zorbax SB C8, 150×4.6mm,5µ, column within a runtime of 2.06 min under gradient elution by a mixture of buffer and acetonitrile and water at a flow rate of 0.8ml/min. A photodiode array (PDA) detector set at 216 nm was used for detection. The spectrophtometric method was developed for the Zofirlukast at uv cut of range of 200-400nm here the absorption max was shown at 216 nm. The method was validated according to the ICH guidelines with respect to specificity, precision, accuracy and linearity, and showing satisfactory data for all the method validation parameters tested. The % RSD for peak area response was found to be within the limit. The proposed method was found to be reproducible and convenient for the analysis of Fluoxetine HCL, the method can be used for routine quality control analysis
used in the preparation of standard and sample solutions. Flow rate was adjusted to 0.8 ml/min and the injection volume was 20l.
Preparation of Mobile phase
Phosphate buffer pH 7 was prepared by dissolve 0.504 gm of disodium hydrogen phosphate and 0.301gm of Potassium dihydrogen phosphate of HPLC grade water and adjusts the pH to 7.0 with sufficient water was added to produce100 ml filtered through 0.45 membrane filter and sonicated for 15 minutes.
Preparation of Standard solutions
20 mg each of Fluoxtine were accurately weighed and transferred into two 25ml volumetric flasks, dissolved using mobile phase and the volume was made up with the same solvent to of concentration 1000 g/ml of each drug.
Preparation of Sample Solution
Twenty tablets of Fluoxtinewere weighed and crushed. Tablet powder equivalent to 20 mg of fluoxetine Hcl was weighed accurately and transferred to a 25 ml volumetric flask. The content was dissolved with 10ml of mobile phase and then sonicated for 15min. The volume was made up with the mobile phase and filtered with 0.45membrane filter and sonicated for 20 min. 0.8 ml of this solution was pipette out and transferred to a 10 ml volumetric flask and the volume was made up with the mobile phase to obtain a concentration of 20 µg/ml of Fluoxetine HCl.
Optimization of RP-HPLC method
The HPLC method was optimized with an aim to develop a simultaneous estimation procedure for the assay of Fluoxetine. For the method optimization, different mobile phases were tried, but acceptable retention times, theoretical plates and good resolution were observed with Phosphate buffer pH 7 and Acetonitrile (25:75 v/v) using Zorbax-C18 column 5m
[250mm x 4.6mm].
Validation of the RP-HPLC method
Validation of the optimized method was performed according to the ICH Q2 (B) guidelines.
System suitability
System suitability was carried out with five injections of solution of 100% concentration having 10 µg/ml of Fluoxetine in to the chromatographic system. Number of theoretical plates (N) obtained and calculated tailing factors (T) were reported in table 1.
Linearity
For the determination of linearity, appropriate aliquots were pipette out from working stock solution A to a series of 10ml volumetric flasks and volume was made up with the solvent to obtain concentration ranging from Each solution was injected in triplicate. Calibration curves 10 µg/ml of Fluoxetine were plotted with
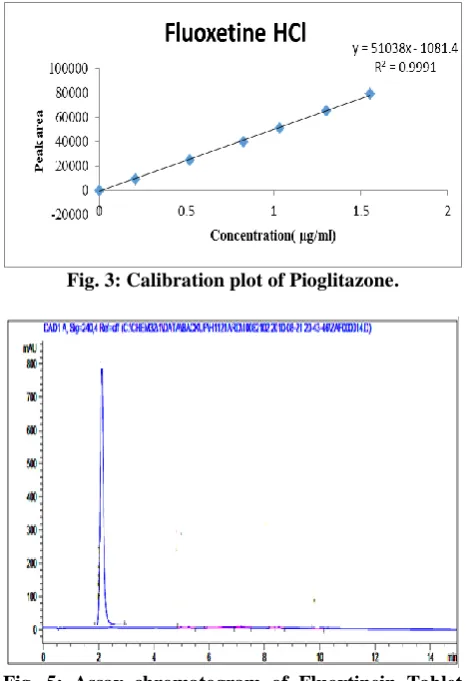
observed peak areas against concentration followed by the determination of regression equations and calculation of the correlation coefficients. The calibration curves for Fluoxtine were shown in figure 3 and figure 4 their corresponding linearity parameters were given in table 2.
Limit of Detection (LOD) and Limit of Quantitation (LOQ)
The LOD and LOQ were calculated from the slope(s) of the calibration plot and the standard deviation (SD) of the peak areas using the formulae LOD = 3.3 σ/s and LOQ = 10 σ/s. The results were given in table 2.
Precision
The repeatability of the method was verified by calculating the %RSD of six replicate injections of 100% concentration on the same day and for intermediate precision % RSD was calculated from repeated studies on different days. The results were given in table 3.
Accuracy
To ensure the reliability and accuracy of the method recovery studies were carried out by standard addition method. A known quantity of pure drug was added to pre-analyzed sample and contents were reanalyzed by the proposed method and the percent recovery was reported. The results were given in table 4.
Specificity
Specificity of a method was determined by testing standard substances against potential interferences. The method was found to be specific when the test solution was injected and no interferences were found because of the presence of excipients. The optimized chromatogram of Fluoxtine without any interference was shown in figure 2.
Robustness
Robustness of the method was verified by altering the chromatographic conditions like wavelength detection, flow rate, etc. and the % RSD should be reported. Small changes in the operational conditions were allowed and the extent to which the method was robust was determined. A deviation of ±2 nm in the detection wave length and ±0.2 ml/min in the flow rate, were tried individually. A solution of 100% test concentration with the specified changes in the operational conditions was injected to the instrument in triplicate. % RSD was reported in the table 5.
Ruggedness
Assay of Marketed Formulations
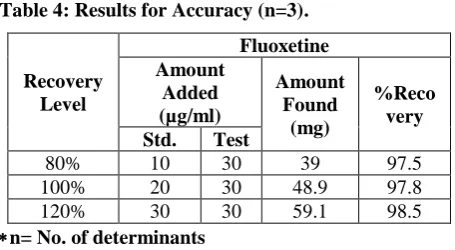
20 l of sample solution of concentration 10 µg/ml of Fluoxetine was injected into chromatographic system and the peak responses were measured. The solution was injected three times in to the column. The amount of drug present and percentage purity was calculated by comparing the peak areas of the standards with that of test samples. A typical chromatogram for assay of marketed formulation was shown in figure 5 and the obtained values were reported in the table 7.
RESULTS AND DISCUSSION
After a number of trials with mobile phases of different composition, Phosphate buffer pH 7 and Acetonitrile in the ratio 25:75 v/v was selected as mobile phase because of better resolution and symmetric peaks. Fluoxtine were found to show appreciable absorbance at 230nm when determined spectrophotometrically and hence it was selected as the detection wavelength. An optimized chromatogram showing the separation of Fluoxtine at different Rts was shown in figure 2.
Fig. 1: Chemical Structures of Fluoxetine hydrochloride.
Fig. 2: Optimized chromatogram of Fluoxetine hydrochloride.
Fig. 3: Calibration plot of Pioglitazone.
Fig. 5: Assay chromatogram of Fluoxtinein Tablet formulation.
Table 1: System Suitability Parameters (n=5).
Parameters Fluoxetine HCl Retention time (min) 2.06 Theoretical plates (N) 83821 Tailing factor (T) 1.1 n= No. of determinants
Table 2: Results for Linearity (n=3).
Parameter Fluoxetine
Linearity Range (µg/ml) 02-105 Regression Equation y = 51038 X + 1081
Slope (m) 83821
Intercept (c) 1081
Regression Coefficient (r2) 0.9999 Limit of Detection (µg/ml) 0.014 Limit of Quantitation (µg/ml) 0.041 n= No. of determinants
Table 3: Results of Precision (n=6).
Drug
Intraday Precision (%RSD)
Interday Precision (%RSD)
Fluoxetine 1.51 0.478
Table 4: Results for Accuracy (n=3).
Recovery Level
Fluoxetine Amount
Added (µg/ml)
Amount Found
(mg)
%Reco very Std. Test
80% 10 30 39 97.5
100% 20 30 48.9 97.8
120% 30 30 59.1 98.5
n= No. of determinants
Table 5: Results for Robustness (n=3).
Parameters (n=3) Fluoxetine Detection wavelength at 214nm 0.018 Detection wavelength at 218nm 0.03
Flow rate 0.6ml/min 0.2
Flow rate 1ml/min 0.032
n= No. of determinants
Table 6: Results for Assay (n=3) of Marketed formulation.
Drug
Label claim (mg/tab)
Amount recovered
% Amount found in
drug
Fluoxetine 20 19 98%
n= No. of determinants
System suitability was carried out by injecting 5 replicate injections of 100% test concentration, number of theoretical plates, HETP and resolution were satisfactory. The chromatograms confirm the presence of Fluoxtine at 6.7min and 8.3 min respectively without any interference. The parameters were given in table 1.
Concentration ranges of 10µg/ml of Fluoxetine were found to be linear with correlation coefficients 0.999 for Fluoxtine respectively. The results were given in table 2.
The limits of detection for Fluoxtinewere found to be 0.014µg/ml and the limit of Quantitation were 0.041µg/ml respectively. Values were represented in table 2.
The proposed method was found to be precise and reproducible with %RSD of 0.478 and 0.85 for Fluoxtine respectively. %RSD was reported in table 3.
Accuracy of the method was verified by performing recovery studies by standard addition method. The percent recovery of the standard added to the pre-analysed sample was calculated and it was found to be 97.5% to 98.5% Fluoxtine respectively. This indicates that the method was accurate. Values obtained were given in table 4. The method was found to be robust after changing the conditions like detection wavelength (± 1nm) and flow rate (± 0.2 ml). % RSD was calculated for each variation and reported. Values obtained were given in table 5.
The method was found to be specific for the combination of interest after verifying the chromatograms showing no interference of the excipients present. Hence, the method was well suitable for the estimation of the commercial formulations of the selected combination with a percentage purity of 98% for Fluoxetine. The typical chromatogram for assay of marketed formulations was shown in figure.5 and Values obtained were given in table 6.
CONCLUSION
The RP-HPLC method developed and validated allows a simple and fast quantitative determination of Fluoxtine from their formulations. All the validation parameters were found to be within the limits according to ICH guidelines. The proposed method was found to be specific for the drugs of interest irrespective of the excipients present and the method was found to be simple, accurate, precise, rugged and robust. So the established method can be employed in the routine analysis of the marketed formulations.
REFERENCES
1. Martindale (The complete drug reference), 34th edition, 2005; 632 & 655.
2. Merck Index 14th edition, 2006; 9151-3568.
3. Indian Pharmacopeia, 7th edition, 2014; 2-3: 1652-2834.
4. K. S. Lakshmi T. Rajesh. Development and Validation of RP-HPLC Method for Simultaneous Determination of Glipizide, Rosiglitazone, Pioglitazone, Glibenclamide and Glimepiride in pharmaceutical dosage forms and human plasma. Journal of the Iranian Chemical Society, 2011; 8(1): 31-37.
5. Sami El Deeb, Udo Schepers, Hermann Wätzig. Fast HPLC Method for the Determination of Glimepiride, Glibenclamide, and Related Substances using Monolithic Column and Flow Program. Journal of Separation Science, 2006; 29(11): 1571-1577.
6. P. K. Sahoo, R. Sharma, and S. C. Chaturvedi. Simultaneous Estimation of Metformin Hydrochloride and Pioglitazone Hydrochloride by RPHPLC Method from Combined Tablet Dosage Form. Indian Journal of Pharmaceutical Sciences, 2008; 70(3): 383–386.
7. Karthik Arumugam, Subramanian Ganesan, Chamallapudi Mallikharjuna Rao, Nayanabhirama Udupa. Simultaneous Determination of Fluoxtinein Bulk Drug and Pharmaceutical Dosage Form by RP-HPLC Method. Pakistan Journal of Pharmaceutical Sciences, 2008; 21(4): 421-425.
9. D. Adukondalu, P. S. Malathy, J. V. Rao, and Y. M. Rao, Development and Validation of HPLC Method for Detection of Pioglitazone hydrochloride in Dosage Forms. International Journal of Pharmacy and Biological Sciences, 2011: 1(4): 474–478. 10. D. B. Pathare, A. S. Jadhav, and M. S. Shingare,
RP-LC Determination of the cis-isomer of Glimepiride in a Bulk Drug Substance. Chromatographia, 2007; 66(7-8): 639–641.
11. N. Satheeshkumar, S. Shantikumar, R. Srinivas. Pioglitazone: A review of analytical methods. Journal of Pharmaceutical Analysis, 2014; 4(5): 295–302.
12. Deepti Jain, Surendra Jain, Deepak Jain, Maulik Amin Simultaneous Estimation of Metformin Hydrochloride, Pioglitazone Hydrochloride, and Glimepiride by RP-HPLC in Tablet Formulation. Journal of Chromatographic Science, 2008; 46(6): 501-504.
13. G. Navaneethan, K. Karunakaran and K. P. Elango. Simultaneous Estimation of Pioglitazone, Glimepiride and Glimepiride Impurities in Combination Drug Product by a Validated Stability- Indicating RP-HPLC Method. Journal of Chilean of Chemical Society, 2011; 56(3): 815-818.
14. M Suchitra, D Sunitha, C Parthiban, B Siddartha and C Madhavi. Method Development and Validation of Metforminm, Glimepiride and Pioglitazone in Tablet Dosage Forms by RP-HPLC. International Research Journal of Pharmacy, 2013; 4(8): 250-254.
15. Rani G Shobha, Lohitha M, Preethi P Jaya, Madhavi R, Sunisitha B and Mounika D. Glimepiride Review of Analytical Methods. Asian Journal of Pharmaceutical Analysis, 2014; 4(4): 178-182. 16. Khohinur Hossain , Asma Rahman , Md. Zakir
Sultan , Farhana Islam , Md. Akteruzzaman , Md. Abdus Salam and Mohammad A. Rashid. A Validated RP-HPLC Method for Simultaneous Estimation of Antidiabetic Drugs Pioglitazone HCl and Glimepiride. Bangladesh Pharmaceutical Journal, 2013; 16(1): 69-75.
17. M. S. V. Sakuntala, S. V. U. M. Prasad, S. Sri Devi, S. Kishore Yadav and K. Srinivas Reddy. A RP- HPLC Method Development and Validation for the Simultaneous Estimation of Glimepiride and Pioglitazone HCl in Tablet Dosage Forms. Journal of Chemical and Pharmaceutical Research, 2012; 4(1): 154-159.
18. Ravi Sharma, Gagan Sharma and Darpan chopra, Analytical Method Development and Validation for the Simultaneous Estimation of Glimepiride and Pioglitazone in Tablet Dosage Form by RP-HPLC. International Journal of Pharmaceutical Sciences and Research, 2012; 2(3): 637-641.
19. Kishore L, Kaur N. Estimation of Fluoxtinein its Pharmaceutical Dosage Form by Spectrophotometric Methods. Der Pharmacia Lettre, 2011; 4: 276-284. 20. Freddy HH, Dharmendra LV. Simultaneous
Estimation of Glimepiride, Rosiglitazone and Pioglitazone Hydrochloride in the Pharmaceutical
Dosage Form. E-Journal of Chemistry, 2010; 7(4): 1326-33.
21. Praveen Kumar Reddy B, Boopathy D, Bibin Mathew, Prakash M, Perumal P. Method Development and Validation of Simultaneous Determination of Fluoxtinein Pharmaceutical Dosage Form by RP-HPLC. International Journal of Chem Tech Research, 2010;2(1): 50-53.