Loghin et al. World Journal of Engineering Research and Technology
ANALYSING AND MODELLING TERRAIN SURFACE CHANGES
USING AIRBORNE LASER SCANNING DATA
Ana-Maria Loghin*1, Valeria Ersilia Oniga2 and Martin Wieser3
1
Ph.D. Student, Eng., Faculty of Hydrotechnical Engineering, Geodesy and Environmental
Engineering, Gheorghe Asachi Technical University of Iași, Romania.
2
Lecturer, Ph.D Eng., Department of Terrestrial Measurements and Cadastre,
Faculty of Hydrotechnical Engineering, Geodesy and Environmental Engineering,
Gheorghe Asachi Technical University of Iași, Romania.
3
Univ. Ass. Dipl.-Ing., Department of Geodesy and Geoinformation (E120.7), Vienna
University of Technology, A-1040 Vienna, Austria.
Article Received on 14/03/2016 Article Revised on 05/04/2016 Article Accepted on 27/04/2016
ABSTRACT
In recent years, Light Detection and Ranging (LiDAR) technology has
known an important evolution, being widely used for rapid and
inexpensive topography measurements over large and complex areas.
This article presents the potential of multi-temporal Airborne Laser
Scanning (ALS) data sets in providing different and reliable digital
elevation models of differences, used in detecting terrain surface
changes. In order to obtain the results, two different ALS data sets
from May 2013 and February 2015 were used. The necessary
processing steps start from an automatic classification of the acquired point clouds into
terrain and off-terrain points, used for the Digital Terrain Model derivation. Therefore, for
each of these two data sets, there was created a Digital Terrain Model, containing only the
ground points. Finally, based on these two derived terrain models, the Digital Elevation
Model of Differences (DoD), that reveals topographic relevant changes is obtained.
World Journal of Engineering Research and Technology
WJERT
www.wjert.org
SJIF Impact Factor: 3.419*Corresponding Author
Ana-Maria Loghin
Ph.D. Student, Eng.,
Faculty of Hydrotechnical
Engineering, Geodesy and
Environmental
Engineering, Gheorghe
Asachi Technical
University of Iași,
1. INTRODUCTION
Over the past decades, due to its accuracy and efficiency, Airborne Laser Scanning has
become an important 3D data acquisition method used in remote sensing domain. Airborne
laser scanning (ALS) - also referred to as LiDAR (Light Detection and Ranging) – became
the standard method for acquisition of topographic data, especially for the reconstruction of
digital terrain models (DTM)( Kraus, Otepka 2005).
Nowadays, as LiDAR technology knows a great evolution, the chances of multi-temporal
LiDAR collections and data sets over the same area has increased. As a first result, using
LiDAR to detect change has become more possible.
During last years, pixel-based change detection methods have been used for change detection
in objects. Previous studies and research describe various change detection methods such as
Change Vector Analysis (CVA), image rationing and image differencing, using an
object-oriented classification (Domenech, Mallet 2014).
A digital terrain model is a topographic model, a mathematical representation, that contains
all the ground points with their spatial elevation data, representing the terrain relief. Digital
Terrain Models know a great importance in research domain, being used especially in civil
engineering, geodesy, surveying, geophysics and geography for terrain visualization and
analyses, parameter extraction (water flow, mass movement). Therefore, while Digital
Surface Models describe the top surface of the terrains, Digital Terrain Models contain only
the terrain surface, without vegetation, buildings or power lines.
2. MATERIALS AND METHODS
2.1 PRESENTATION OF THE STUDY AREA
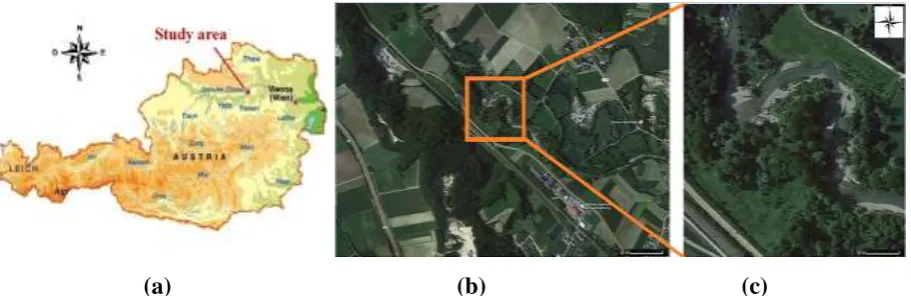
The study area is located in Neubacher Au, near the Loosdorf village in Lower Austria (48o 12’50” N, 15o
22’30” E, WGS 84), at about 100 km west of Vienna. In order to determine the
terrain changes, from the initial data, an area of 447 by 428 meters was selected. This
territory has elevations between and 259 and 314 meters above sea level and includes a
meandering region of the Pielach River, a pre-alpine river, right side tributary of the Danube
(a) (b) (c)
Fig. 1. Neubacher Au, Lower Austria; (a) Overview map of Austria; (b) location of the
study area; (c) Study area Neubacher Au
2.2. MATERIALS AND EQUIPMENT
The airborne laser scanning data used in this study was provided by the Department of
Geodesy and Geoinformation, from Vienna University of Technology.
The ALS data of the first epoch took place at the 24th of May 2013 using a V-Line Airborne
Laser Scanner RIEGL VQ-580, with a narrow near-infrared laser beam and a fast line
scanning mechanism. The second data acquisition took place on 26th of February 2015 using
a RIEGL LMS-Q1560 scanner, characterized by a high laser pulse repetition rate up to
800kHz, laser wavelength in near infrared, allowing operation at various flight altitudes.
2.3 DATA PROCESSING
The main principle of LiDAR technology is to emit a laser pulse in a known, controlled
direction and measure the time from emission until receiving of its echo, scattered back from
surfaces within the instantaneous field of view. Direct georeferencing provides the position
and orientation of the measurement platform. Together, this is used for 3-dimensional
location of the echoes, thus providing a georeferenced 3D point cloud (Otepka, Ghuffar,
Waldhauser, Hochreiter, Pfeifer, 2013).
Surveying riparian areas represents a challenge for remote sensing domain, due to vegetation,
that is most presently along the river channel.
For the first flight mission from May 2013 the mean echo point density is in the range of 10
The details of these two ALS datasets are shown in the following Table 1.
Table 1. Summary of data capturing
Fligth Date Sensor Point Density
[points/m2]
Total number
of points Foliage
24 May 2013 26 February 2015
VQ-580 LMS-Q1560
10 57
1958483 12227601
leaf-on leaf-off
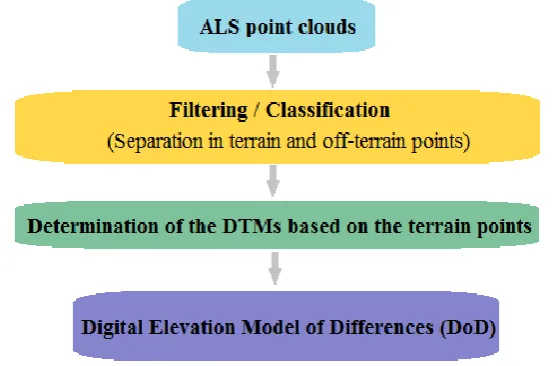
The following figure shows a short overview of the processing steps applied to derive the two
Digital Terrain Models of the same area and finally the Digital Elevation Model of
Differences, providing reliably determined deposition and erosion areas between the two
analyzed epochs.
Fig. 2. Overview of the processing steps for the proposed method
Preprocessing of the LiDAR point cloud was performed with the Riegl ALS software suite
RiProcess(direct georeferencing, strip adjustment) and the following steps for digital terrain
models derivation, laser scanning software OPALS (Orientation and Processing of Airborne
Laser Scanning data) developed by the Technical University of Vienna, was used (Pfeifer,
Mandlburger, Otepka, Karel, 2014).
3. RESULTS AND DISCUSSION
3.1 DTM GENERATION
The most important product that was derived from the point cloud (LiDAR data) is the
Digital Terrain Model, containing the bare-earth surface with all ground points. In order to
achieve this, a separation between ground points and non-ground points was made.
Over time, scientists and researchers developed different automatic methods that can be
usage of mathematical morphology (Vosselman, 2000), weight iteration (Briese, Pfeifer,
2001), or data points gridding (Wack, Wimmer, 2002).
For the present study, in order to automatically determine the DTM of the Neubacher Au
territory, there were used robust filtering methods, that allow the elimination of off-terrain
points and the modelling of the terrain surface within one process.
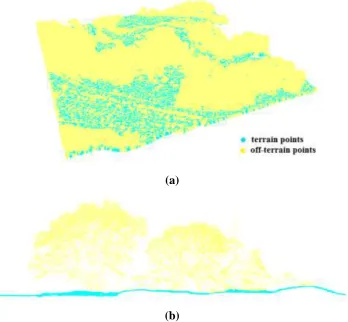
(a)
(b)
Fig. 3. ALS point cloud classification (a) 3D view of the classified points, (b) profile view
The applied algorithm for robust DTM generation consists of the following steps (Kraus,
Pfeifer, 1998):
1. Interpolation of an initial surface with points having equally individual weights
2. Calculate filter values, based on vertical deviations of the ALS points to the surface
3. Taking into account the new point weights, a new surface is calculated.
4. Steps 2 and 3 are iterated until a good approximation of the terrain.
5. The last step is the identification of ground points.
trees, the chances for the laser pulse to make it to the bare ground are quietly reduced.
Therefore, the accuracy and reliability of the derived surface, are lower in vegetated parts,
than in clear and open ones.
In contrast to the first data acquisition, the second flight was made in leaf-off conditions,
enabling a good penetration of the laser beam through the vegetation (Fig. 4b).
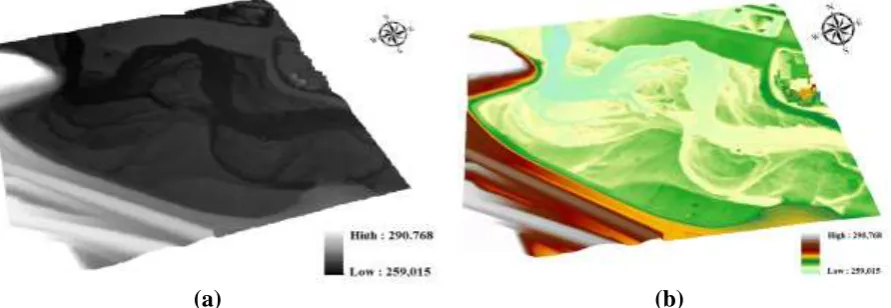
(a) (b)
Fig. 4. DTM raster derivation
(a) DTM raster corresponding to the first data acquisition with the Riegl VQ 580 laser
scanner, using “robmoving planes” interpolation (with 0.05m gridsize, 500 neighbours,
20 meters search radius and selmode quadrant)
(b) DTM raster corresponding to the second data acquisition with the Riegl LMSQ 1560 laser
scanner, using “robmoving planes” interpolation (with 0.25 gridsize, 200 neighbours, 2
meters search radius and selmode quadrant)
(a) (b)
Fig. 5. Digital Terrain Model - 3D visualizations in “ArcScene” software (a) using
3.2 TERRAIN CHANGE DETECTION
Based on the multi-temporal ALS data sets, the digital terrain model can be analyzed and
changes can be revealed. For this case study, using two different airborne laser scanner
collections from May 2013 and from February 2015, there are presented the main changes
(erosion / deposition) of the terrain topography along the Pielach River, in Neubacher Au
territory.
Within May 2013 and February 2015 when the two data sets were acquired, two flood events
occurred at the Pielach River. The first one in June 2013 and the second one in May 2014.
These events had an important impact on the terrain topography along the river, and also on
the riparian area (Mandlburger, Hauer, Wieser, Pfeifer, 2015).
By analyzing and comparing the derived Digital Terrain Models from the two epochs, that
were obtained in the previous step, it can be obtained the Digital Elevation Model of
Differences (DoD), revealing topographic relevant changes.
The method used in this study, for detecting the topographic terrain changes, is a pixel-based
method, using difference imaging, where each pixel value in the raster - image corresponding
to the Digital Terrain Model of May 2013 is subtracted from its corresponding pixel value in
the raster - image of the Digital Terrain Model of February 2015.
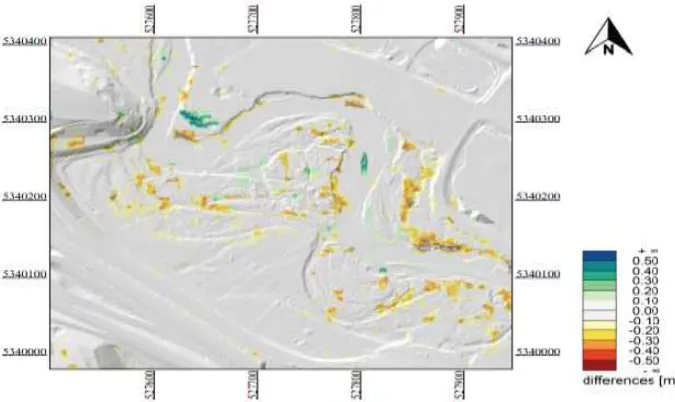
The figure shows the Digital Elevation Model of Differences (DoD) of the study area
represented in raster format, erosion having a yellow to red color tone, whereas deposition is
As it can be seen, the differences are ranging between -0.5 m (corresponding to erosion) to
+0.5 m (corresponding to deposition) and they are especially located along the Piellach
riverbed.
4. CONCLUSIONS
Airborne laser scanning (LiDAR), using near infrared pulses for point clouds acquisition, has
been proved to be a suitable method for the 3-dimensional structure of vegetation analysis
and also for the terrain surface assessment.
An important advantage of airborne laser scanning is represented by the large areas that can
be analyzed within a single project. For example, Digital Terrain Models can also be derived
using terrestrial laser scanning data, offering more detailed and accurate description of the
ground surface. Whereas terrestrial acquiring covers only small areas of about 1 km2 and
below, airborne laser scanning is being used to collect topographic information over larger
areas of more than 10,000km2.
Nowadays, with LiDAR evolution, the number of LiDAR collections and data sets over the
same area increased, fact that makes possible the change detection operation and the
technology of airborne laser scanning has proved to be very efficient in obtaining the
information of relevant topographic changes.
An important aspect that must be taken into account is the flight time of data acquisition. For
example, in spring or summer, due to the leaf-on conditions, the chances for the laser pulse to
reach the bare-ground and penetrate the vegetation, are quietly reduced. This fact affects the
accuracy of the processed digital models, that is lower in vegetated parts than in clear and
open ones. But, like all the other technologies, LiDAR is a measurement tool, that has its own
strengths and weaknesses.
5. REFERENCES
1. Briese C, Pfeifer N., Airborne Laser Scanning and Derivation of Digital Terrain Models.
Proceedings of the 5th Conference on Optical 3-D Measurement Techniques Vienna,
2001; 80 – 87.
2. Emilio Domenech, Clément Mallet (2014), “Change detection in high-resolution land
use/land cover geodatabases (at object level), European Spatial Data Research, Official
3. Kraus K., Pfeifer N., “Determination of terrain models in wooded areas with aerial laser
scanner data.” ISPRS Journal of Photogrammetry and Remote Sensing 1998; 53:
193-203.
4. Kraus, K., Otepka, J. ”DTM Modeling and Visualization - The SCOP Approach”
Photogrammetric Week '05, D. Fritsch (ed.). Herbert Wichmann Verlag, Heidelberg,
2005; 241 - 252.
5. Mandlburger G., Hauer C., Wieser M., Pfeifer N., 2015, „Topo-Bathymetric LiDAR for
monitoring river morphodynamics and instream habitats – Acase study at the Pielach
River“, Remote Sens. 2015; 7: 6162.
6. Otepka J., Ghuffar S., Waldhauser C., Hochreiter R., Pfeifer N. “Georeferenced point
clouds: A survey of features and point cloud management.” ISPRS Int. J. Geoinf. 2013; 2:
1038–1065.
7. Pfeifer N., Mandlburger G., Otepka J., Karel W., “OPALS - A framework for Airborne
Laser Scanning data analysis.” Comput. Environ. Urban Syst. 2014; 45: 125–136.
8. Riegl LMS. RiProcess Datasheet, (2015). Available online:
http://www.riegl.co.at/products/software-packages/riprocess/ (accessed on 1 April 2016).
9. Vosselman G., Slope based filtering of laser altimetry data. International Archives of
Photogrammetry and Remote Sensing, Amsterdam, Netherlands 32, B3/2, 2000; 935 –
942.
10. Wack R., Wimmer A., 2002, “Digital terrain models from airborne laser scanner data – A