ISSN: 2334-2382 (Print), 2334-2390 (Online) Copyright © The Author(s). All Rights Reserved. Published by American Research Institute for Policy Development DOI: 10.15640/jeds.v5n4a1 URL: https://doi.org/10.15640/jeds.v5n4a1
Is China's GDP Growth Overstated? An Empirical Analysis of the Bias caused by the
Single Deflation Method
Jie Li
1Abstract
According to Alexander et al. (2017), major developed countries among the G20 nations mainly utilize the double deflation method to calculate value added at constant prices, while China and India utilize the single deflation method. Calculation using the double deflation method requires frequently published input-output data and detailed price indices, giving rise to many practical difficulties. The System of National Accounts (SNA, 2008) suggests the single deflation method as an alternative solution. By using the input - output framework, this paper discusses the relationship between the relative price change between industries and the bias caused by single deflation method. Based on the outcome of that discussion, empirical analysis is conducted using input-output data and GDP (gross domestic product) deflators regarding the nature of the impact of the bias caused by single deflation on the magnitude of China’s GDP growth, and how it distorts the relative contribution of each industry to GDP growth.
Keywords: single and double deflation method, real GDP, China's GDP growth, input-output data, system of
national accounts
1. Introduction
Li (2013) discussed methods of calculating Chinese GDP at constant prices (also called real GDP), by making comparisons with Japan. I pointed out that, whereas Chinese real GDP is determined from the production side rather than the expenditure side, with constant-price value added and basically calculated for each industry using the single deflation method, real GDP for Japan is calculated using the double deflation method. Furthermore, for the first time for Japan, which has linked input-output tables at the current price, I used actual statistics to conduct comparison of the magnitude between the single deflation and double deflation approaches.
Subsequently, Li and Kuroko (2016) and Li (2016), using the input-output framework, classified industries into intermediate-good industries and final-good industries, and examined the direction of the divergence from estimates using both the single and double deflation methods and the relative change in the level of prices between industries. We verified these conclusions using the 1960-2000 linked input-output tables for Japan. As shown in Table 1, apart from the 1970s, during which oil shocks occurred, real GDP growth, calculated using the single deflation method, was overstated. On behalf of the IMF, Alexander et al.(2017), having sought the views of those within various governments responsible for creating the SNA, studied the approach to real valued added adopted by various G20 countries and found that, apart from the UK, major developed countries mainly utilize the double deflation method, while China and India utilize the single deflation method2.
1 Professor at Graduate School of Humanities and Social Sciences, Saitama University, Japan, 338 8570. E-mail: lij@mail.saitama-u.ac.jp
Furthermore, to verify the bias caused by single deflation, they used data since 2000 for the eight G20 countries (Belgium, Brazil, Canada, France, Japan, Korea, the Netherlands, and the United States) that use the double deflation method, to calculate the constant price values that would have pertained if those countries had utilized the single deflation method. They then analyzed the difference between these theoretical figures and the published figures calculated using the double deflation method and found no clear trend.
Table 1: Difference between GDP Growths of Japan for the 1960-2000 Period Calculated using Single and Double Deflation Methods (in Percentage Points)
a. GDP real growth rate by double deflation (annual)
b. GDP real growth rate bysingle deflation (annual)
c. Difference (b-a)
1960-1970 11.3 12.0 0.7
1970-1980 4.7 4.2 -0.5
1980-1990 4.2 4.8 0.6
1990-2000 1.2 1.4 0.2
Source: Calculated by Li and Kuroko (2016) and Li (2016)
In Section 2, the concept of Alexander et al.(2017) regarding the bias caused by single deflation, is first outlined and, based on that, changes in relative prices between industries, and their relationship with the bias, are discussed, using the input-output framework. Section 3 demonstrates the output deflators and the input-output data used when verifying the bias caused by single deflation for China. Section 4 contains empirical analysis of the nature of the impact of the bias caused by single deflation on the magnitude of Chinese GDP growth. Furthermore, Section 5 presents an analysis of how the bias distorts the contribution of each industry to GDP growth. Finally, in Section 6, the findings obtained from this study are outlined and future studies suggested.
2. Consideration of the Bias Caused by Single Deflation Method
Value added at constant prices is the difference between output at constant prices and intermediate consumption at constant prices. The double deflation method of calculating value added at constant prices requires the deflation of the nominal value of output and of intermediate consumption using their respective price indices and the finding of the difference between the two deflated values. The calculation requires frequent intermediate consumption data (annual or quarterly) and a broad range of price indices. The double deflation method is conceptually preferred as the only method of estimating real value added that satisfies both sides (production and expenditure) of real GDP, and has been strongly recommended as per the 1968 SNA. Meanwhile, with the single deflation method (also called the direct deflation method), nominal value added amounts are directly deflated by price indices. Output price indices are usually used for simplicity’s sake, because they are easily obtained. The single deflation method implicitly assumes that changes in output prices and changes in relevant intermediate consumption prices are broadly the same. It is often used when intermediate consumption data and price indices are inadequate. The 2008 SNA recommends the single deflation method as an alternative to the double deflation method3.
Below, I consider the bias of calculations using the single deflation method versus real GDP calculated using the double deflation method.
Elsewhere it applies single deflation” (paragraph 2.31) and mention “ONS is still considering the best approach to transition to double deflation and systems limitations mean that implementation is not planned before 2020” (paragraph 2.36). The description of Bean (2016) is considered to be correct.
2.1 Conceptual Representation of the Bias by Alexander et al. (2017)4
The size of the bias relates to the relative change of input and output prices. When indices of input and output prices are available5, double deflation can be used, as shown in equation (1).
=
−
=
−
(1)Where represents value added, refers to output, refers to intermediate consumption, and represents the deflators. The bars on top of the variables refer to volume estimates (or constant prices).
If the respective prices are not available6, constant prices are derived by deflating value added with an output price
(single deflation) as shown in equation (2).
=
−
=
−
(2)Where and denote the constant price estimates of value added and intermediate consumption using single deflation, respectively. The size of the bias can be expressed as the difference between (1) and (2):
=
−
=
∗ (3)
The volume of value added will be overstated when the bias is positive, and understated when the bias is negative. Overstatement will occur when > , and understatement when < . This implies changes in the level of real value added and explains effects on the dynamics of the volume. If prices of intermediate consumption are used for single deflation, the bias will be in the same direction, but of higher magnitude.
2.2 Consideration of the Bias using the Input-output Framework
As shown by Alexander et al.(2017), single deflation bias stems from the discrepancy between the output and intermediate consumption deflators. However, for a single industry, the output deflator is a scalar quantity and the intermediate deflator is a vector. Furthermore, for all industries, the output deflator is a vector and the intermediate consumption deflator is a matrix. As a result, it is difficult to make a simple comparison of the output deflator and the intermediate consumption deflator. Here, to discuss the bias caused by single deflation from the viewpoint of relative price changes between industries, a closed economy two-sector input-output framework is adopted as shown in Table 27.
First, using Table 2, let us examine the components of current price GDP (also known as nominal GDP). Value added is defined as the difference between the value of output and intermediate consumption, and so production-side GDP (shown as ) can be expressed by the following formula.
= + = { −( + )} + { −( + )} (4)
In addition, from the supply-demand balance expressed as “intermediate use + final use = gross output,” expenditure-side GDP (shown as ) can be expressed in the following formula. It is self-evident that both are equal.
= + = { −( + )} + { −( + )} (5)
4See Alexander,etal.(2017) p.8for details.
5Furthermore, intermediate consumption data are also available. 6In many cases,intermediate consumption data are not available.
Table 2: Two-sector Input-output Table and Deflators (Definition of Variables)
Intermediate use Final use
Gross
output Deflator Industry A Industry B
In
te
rm
edi
at
e
co
n
su
m
p
ti
o
n
Industry A
Industry B Value added
Gross input
Next, let us consider constant price GDP. Because production-side real GDP ( ) derived using the double deflation method is defined as the value of deflated output, less the value of deflated intermediate consumption, the following formula is true.
=
−
+
+
−
+
(6)This is equivalent to the expenditure-side real GDP (shown as ) in the following formula. This is the root of the validity of the double deflation method.
=
−
+
+
−
+
(7)Meanwhile, the estimate using the single deflation method (simply deflating the nominal value added by the output deflator of each industry, ) is expressed by the formula below.
=
+
=
−
+
+
−
+
(8)Therefore, the bias caused by single deflation can be defined as below.
=
−
=
−
(9)Here, where industry A is identified as an intermediate-good industry and industry B is identified as a final-good industry, − > 0. As long as the rate of change in price in the intermediate-good industry and in the final-good industry is not the same ( ≠ ),a bias emerges. With the single deflation method, where > , there is understatement and, conversely, where < there is overstatement.
This conclusion can be considered to be widely applicable. With the double deflation method, which is the conceptually preferred measurement method, price rises in an industry identified as an intermediate-good industry depress the real intermediate-use value in that industry and push up the aggregate value of real GDP (not the value added of that industry). In the case of the single deflation method, the relevant portion of real intermediate-use value is overstated and, therefore, real aggregate GDP is understated. The reverse is also true. The size of the impact is not uniform for all industries, as it depends on: i) how strongly an industry is characterized as an intermediate-good industry or a final-good industry, ii) the extent of divergence from average price levels and, iii) the industry’s weighting within the economy. The larger the industry, the larger is the impact on the aggregate value of GDP. No single deflation bias in aggregate real GDP is caused by industries deemed neutral in terms of the balance of their intermediate-good and final-good characteristics or by industries whose relative price change is at the same rate as the average price change for all industries.
3. Data used for Empirical Analysis of China's GDP Growth
Price indices are lacking in China compared to developed countries such as Japan. Since the beginning of the 2000s, the National Bureau of Statistics of China (NBS) has been making efforts to provide a wider range of price indices and, for example, it has been publishing detailed producer price indices by industry related to mining and manufacturing since 2002. At the same time, the deflation method was introduced into GDP statistics in earnest. However, like the UK, China does not yet produce price indices relating to business services, and neither does it yet produce price indices relating to imports and exports.China does not produce linked input-output tables at current price and annual input-output statistics (or supply use tables) do not exist. Real GDP does not include expenditure-side estimates and comprises only production-expenditure-side estimates. Value added for each industry is mainly estimated with the single deflation method that uses output deflators, with extrapolation based on volume indices used for some industries.8 Naturally, the GDP growth rate is calculated from production-side real GDP.
As regards to the input-output data used for this empirical analysis, first, the basic tables (which are produced and published every five years in China) for 2002, 2007, and 2012 and the extension tables (which are produced in the intervening years) for 2005 and 2010 were studied. After the 17 sectors common to all of them had been integrated, the resulting five input-output tables were used to verify the bias caused by single deflation for four periods (2002-2005, 2005-2007, 2007-2010, and 2010-2012).Next, given that Chinese real value added is mainly found by directly deflating nominal value added by an output deflator, the output deflators used here are mainly the implicit GDP deflators found by dividing the published nominal GDP for each industry by its real GDP. However, real GDP by industry published by NBS is not at all detailed, covering only nine sectors, with the lumping-together of industries, such as mining, manufacturing, electric power, and water, being particularly problematic. Additionally, these industries account for a significant proportion of GDP (45.1% in 2007, as an example). NBS (2008) states that the “Producer Price Indices for Industrial Products by Sector” are used for deflation of the GDP of those industries. Further, looking at the details of the relevant Producer Prices Indices (PPIs), the relative price change in the mining and manufacturing sectors is very large. Therefore, in this study, for these sectors [from 2 (Mining) to 11 (Production and Supply of Electric Power, Heat Power, and Water) in the table below], a single implicit GDP deflator is not used, but rather the entire “Producer Price Indices for Industrial Products by Sector”.
4. Simulation of the Bias caused by Single Deflation for China's GDP Growth
Below, Chinese input-output tables and output deflators are used to calculate the various real GDP growth ratios, using the single and the double deflation methods and the bias caused by single deflation is simulated.
4.1Simulation Results for China's GDP Growth in the 2002-2007 Period
Table 3 shows simulation results of the bias caused by single deflation for 2002-2005 and 2005-2007. In these periods, China maintained strong double-digit growth.
First, let us classify the industries according to whether their products are intermediate goods or final goods. As shown in Formula (9), intermediate use within an industry (own-use) does not impact the estimated value regardless of using the single deflation method or the double deflation method.
Therefore, in distinguishing between intermediate-good industries and final-good industries, I use the intermediate-use ratio excluding the own-use portion of intermediate use. Where the intermediate-use ratio is higher than the average (48.1%), the industry is deemed to be an intermediate-good industry (■), and if it is lower than average, it is deemed to be a final-good industry (●). In addition, where the rate is close to the average, the industry is deemed to be neutral (□). Table 3 shows that the “Mining,” “Production & Supply of Electric Power, Heat Power, &
Table 3: Difference between China's GDP Growths for the 2002-2007 Period Calculated
using Single and Double Deflation Methods
Notes:
1) Intermediate use rate (%) = intermediate use excluding own-use ÷ total use
2) For industries 2-11, “Producer Price Indices for Industrial Products by Sector” China Statistical Yearbook are used. For other industries, the implicit GDP deflator for each industry was calculated and used. The output deflator average is a weighted harmonic mean, depending on the weighting of each industry’s output.
3) Difference of GDP real growth ratio (%) = GDP growth rate – GDP growth rate = Bias caused by single deflation ÷ the base year GDP
4) The symbols in the intermediate-use ratio column show industries identified as intermediate-good industries, where the intermediate-use ratio is very high (■■) or high (■) compared to the average (48.1%) and industries identified as final-goodindustries, where the intermediate-use ratio is low (●) or very low (●●) compared to the average. In addition, (□) denotes a neutral industry with a ratio close to the average.
5) The symbols in the output deflator column show whether the deflator is very large (▲▲), large (▲), small (▼) or very small (▼▼) compared to the average, or whether it is close to the average (□).
1) Agriculture, Forestry, Animal Husbandry & Fishery 48.9 □ 13.6 105.7 ▲ 108.3 ▲▲
2) Mining 91.7 ■■ 4.9 115.9 ▲▲ 108.1 ▲▲
3) Manufacture of Foods, Beverage & Tobacco 33.4 ● 3.7 102.1 ▼ 102.4 ▼
4)Manufacture of Textile, Wearing Apparel & Leather
Products 21.1 ●● 3.2 101.1 ▼▼ 101.3 ▼▼
5) Coking, Gas & Processing of Petroleum 92.0 ■■ 0.9 109.4 ▲▲ 108.6 ▲▲
6) Chemical Industry 77.0 ■■ 4.8 104.2 ▲ 101.6 ▼
7) Manufacture of Nonmetallic Mineral Products 85.2 ■■ 1.6 101.2 ▼ 101.4 ▼▼
8)Manufacture and Processing of Metals and Metal
Products 85.9 ■■ 4.2 108.9 ▲▲ 107.3 ▲
9) Manufacture of Machinery and Equipment 35.1 ● 9.1 99.4 ▼▼ 100.9 ▼▼
10) Other Manufacture 66.5 ■ 4.0 101.1 ▼▼ 101.6 ▼
11)Production and Supply of Electric Power, Heat
Power and Water 84.1
■■ 3.5 103.5 □ 104.0 □
12) Construction 6.2 ●● 5.4 104.5 ▲ 104.1 □
13)Transport, Storage, Post, Information
Transmission, Computer Services & Software 71.1
■ 5.8 101.8 ▼ 105.5 ▲
14)Wholesale and Retail Trades, Hotels and Catering
Services 55.6
■ 10.0 102.3 ▼ 102.8 ▼
15) Real Estate, Leasing and Business Services 54.8 ■ 8.4 106.9 ▲▲ 106.3 ▲
16) Financial Intermediation 79.5 ■■ 3.8 101.6 ▼ 114.2 ▲▲
17) Other Services 10.7 ●● 13.2 104.6 ▲ 106.5 ▲
Average (or total) 48.1 100.0 103.5 104.1
-1.5 -1.3
2002 Intermediate use rate1)
2002 VA component ratio
Deflator of output (annual)2)
Difference of GDP real growth ratio (annual) 3)
Water,” and “Financial Intermediation” industries are strongly characterized as intermediate-good industries (■■) and manufacturing industries, apart from “Manufacture of Foods, Beverage, & Tobacco,” “Manufacture of Textile, Wearing Apparel, & Leather Products,” and “Manufacture of Machinery & Equipment,” are basically intermediate-good industries. In addition, “Construction” and “Other Services” are strongly characterized as final-intermediate-good industries (●●).Looking at industry classification,a point of disparity from the results based on Japan’s 1960-2000 linkedinput-output tables is that, while the majority of Japan’s tertiary industries are deemed to be final-good industries, economic growth in China over the same period was mainly dependent on investment. This means that the share of consumption in demand was relatively low, so that the intermediate-good characteristics of tertiary industries are stronger than in Japan.
As an indicator of the size of each industry within the economy, its weighting within value added is shown. We will look at relative price changes in combination with this. “Agriculture, Forestry, Animal Husbandry, & Fishery” accounts for an extremely high 13.6% of the Chinese economy, but its classification is as an industry with extremely weak intermediate-good characteristics, and it could almost be classified as neutral. Price rises in this industry, therefore, have broadly the same impact at its intermediate-use level (therefore, on aggregate intermediate consumption) and at its final-use level (therefore, on aggregate final use, which is aggregate value added). There is hardly any bias caused by single deflation. Regarding relative price changes between industries in 2002-2005, prices rose more than average (▲▲) in “Mining”, “Coking, Gas, & Processing of Petroleum,” “Manufacture & Processing of Metals & Metal Products,” and “Real Estate, Leasing, & Business Services” (accounting for 16% of value added); all of which are intermediate-good industries. Moreover, industries where the fall in prices was relatively large (▼▼), apart from “Other Manufacture” (4% of value added), were final-good industries, such as “Manufacture of Machinery & Equipment” and “Manufacture of Textile, Wearing Apparel, & Leather Products.” Together, they accounted for 12.3% of value added. The price change for “Production & Supply of Electric Power, Heat Power, & Water” was more or less the same as the average (□) in both time periods and so has no impact on the bias. In short, almost all
industries strongly characterized as intermediate-good industries (■■) saw prices rise, and a number of industries strongly characterized as final-good industries (●●) saw contradictory price movements (prices fell sharply in “Manufacture of Textile, Wearing Apparel, & Leather Products” and rose slightly in “Construction” and “Other Services”).
A similarity between 2005-2007 and the earlier period is that the industries whose prices rose more sharply than average were “Agriculture, Forestry, Animal Husbandry, & Fishery”, “Mining”, “Coking, Gas, & Processing of Petroleum”, and “Financial Intermediation”, all of which are classified as intermediate-good industries. On the other hand, a point of dissimilarity is that industries where prices fell relatively sharply were classified roughly half and half as final-good industries (including “Manufacture of Machinery & Equipment” and “Manufacture of Textile, Wearing Apparel, & Leather Products”) and intermediate-good industries (including “Chemical Industry” and “Manufacture of Nonmetallic Mineral Products”). In other words, more of the industries classified as intermediate good-industries saw relative prices rise (six industries with 28% of value added) than fall (three industries with 16.4% of value added). In addition, all industries classified as final-good industries saw a relative decline in prices, apart from “Other Services.”
Therefore, there is a strong overall tendency in both time periods for > and, as a result, real GDP calculated using the single deflation method is understated compared to that calculated using the double deflation method, with annualized GDP growth understated by 1.5 percentage points in 2002-2005 and 1.3 percentage points in 2005-2007.
4.2 Simulation Results for China's GDP Growth in the 2007-2012 Period
Table 4 shows the results of verification of the single deflation method bias for 2007-2010 and for 2010-2012. During these periods, although the 2008 Lehman Shock ended a sustained period of double-digit economic growth, high growth of 9% on average continued, led by domestic investment including increased public spending.
Table 4: Difference between China's GDP Growths for the 2007-2012 Period Calculated using Single and Double Deflation Methods
Notes:
1) Intermediate use rate (%) = intermediate use excluding own-use ÷ total use
2) For industries 2-11, “Producer Price Indices for Industrial Products by Sector” China Statistical Yearbook are used. For other industries, the implicit GDP deflator for each industry was calculated and used. The output deflator average is a weighted harmonic mean, depending on the weighting of each industry’s output.
3) Difference of GDP real growth ratio (%) = GDP growth rate – GDP growth rate = Bias caused by single deflation÷ the base year GDP
4) The symbols in the intermediate-use ratio column show industries identified as intermediate-good industries, where the intermediate-use ratio is very high (■■) or high (■) compared to the average (51.8%) and industries identified as final-goodindustries, where the intermediate-use ratio is low (●) or very low (●●) compared to the average. In addition, (□) denotes a neutral industry with a ratio close to the average.
5) The symbols in the output deflator column show whether the deflator is very large (▲▲), large (▲), small (▼) or very small (▼▼) compared to the average, or whether it is close to the average (□).
1) Agriculture, Forestry, Animal Husbandry & Fishery 65.9 ■ 10.8 107.3 ▲▲ 108.9 ▲▲
2) Mining 97.2 ■■ 5.2 106.6 ▲▲ 105.5 ▲
3) Manufacture of Foods, Beverage & Tobacco 41.9 ● 3.8 103.0 ▼ 103.6 ▼
4)Manufacture of Textile, Wearing Apparel & Leather
Products 21.9
●● 3.4 101.6 ▼ 103.4 ▼
5) Coking, Gas & Processing of Petroleum 92.3 ■■ 1.5 106.7 ▲▲ 108.0 ▲▲
6) Chemical Industry 78.0 ■■ 4.7 101.8 ▼ 101.2 ▼▼
7) Manufacture of Nonmetallic Mineral Products 90.9 ■■ 2.4 103.2 □ 102.7 ▼
8)Manufacture and Processing of Metals and Metal
Products 80.8 ■■ 5.9 101.0 ▼ 101.1 ▼▼
9) Manufacture of Machinery and Equipment 28.5 ●● 10.5 100.1 ▼▼ 100.1 ▼▼
10) Other Manufacture 63.8 ■ 4.2 101.7 ▼ 102.2 ▼
11)Production and Supply of Electric Power, Heat
Power and Water 87.7
■■ 3.5 103.0 ▼ 102.6 ▼
12) Construction 2.3 ●● 5.5 106.2 ▲ 106.0 ▲
13)Transport, Storage, Post, Information
Transmission, Computer Services & Software 67.9
■ 7.9 101.9 ▼ 104.3 ▲
14)Wholesale and Retail Trades, Hotels and Catering
Services 51.9 □ 8.6 104.5 ▲ 105.5 ▲
15) Real Estate, Leasing and Business Services 42.4 ● 6.1 112.0 ▲▲ 108.6 ▲▲
16) Financial Intermediation 74.7 ■ 5.0 106.0 ▲ 107.8 ▲▲
17) Other Services 18.5 ●● 11.1 105.8 ▲ 106.9 ▲
Average (or total) 51.8 100.0 103.3 103.9
-0.4 -0.4
2010-12 2007
Intermediate use rate1)
2007 VA component ratio
Deflator of output (annual)2)
Difference of GDP real growth ratio (annual) 3)
Equipment.” Furthermore industries deemed to have strong final-good characteristics (●●) are “Construction,” “Other Services” and some manufacturers of final goods. Points of disparity between 2002 and Table 4 include the fact that “Real Estate, Leasing, & Business Services” was classified as an intermediate-good industry in 2002 but as a final-good industry in 2007 and the fact that tertiary industries as a whole had weaker intermediate-goodcharacteristics in 2007 than in 2002 and stronger final-good characteristics (though the trend was not as pronounced as in Japan).
When looking at weighting within value added, the weighting of “Agriculture, Forestry, Animal Husbandry, & Fishery” was lower than in 2002, and that of the manufacturing industry in general rose slightly. Trends in relative price change between industries versus the average were very similar in 2007-2010 and 2010-2012. For intermediate-good industries “Agriculture, Forestry, Animal Husbandry, & Fishery” and “Mining” (together accounting for 16% of value added), relative prices rose. Manufacturing industries saw their relative prices fall overall, with the exception of “Coking, Gas, & Processing of Petroleum” (very much a resource-related industry and accounting for only 1.5% of value added). Tertiary industries as a whole saw their relative prices rise, with the exception of “Construction” (5.5% of value added) and “Transport, Storage, Post, Information Transmission, Computer Services, & Software” (7.9% of value added). When looking at the classification of industries as either intermediate-good industries or final-good industries, both groups had roughly equal numbers of industries that saw prices rise relatively and industries that saw prices fall relatively. Therefore, despite relative prices between industries differing significantly, because factors causing overstatement and factors causing understatement in the various industries cancelled each other out, added value at constant prices calculated using the single deflation method is slightly lower than real value added calculated using the double deflation method, with GDP growth for both time periods understated by about 0.4 percentage points on an annualized basis.
5. Simulation of the Bias of Contribution by Industry to China's GDP growth
Not only does the single deflation method exert bias on aggregate real GDP and GDP growth, it is also possible that it causes latent distortions in the relative contribution of industries to those two values. The single deflation method implicitly assumes that intermediate consumption prices and output prices rise at the same rate. Therefore, when that assumption is not fulfilled, just as for aggregate real GDP, for each industry too, calculations using the single deflation method differ from those using the double deflation method. If the overall rise in the price of the various intermediate consumption items used in production in each industry is larger than the rise in the industry’s output price, then the value added at constant prices obtained with the single deflation method will be lower than that obtained with the double deflation method, and vice versa. In the following sections, first, the relative price of intermediate consumption and output on an industry basis are compared, and the single deflation bias arising from this is discussed. Thereafter, the nature of the distortion exerted by that bias on the relative contribution of each industry to Chinese GDP growth is discussed.
5.1 Comparison of Deflators between Output and Intermediate Consumption by Industry
Each industry inputs various goods and services as intermediate consumption for its production. Therefore, that intermediate consumption is deflated using the output deflators of the many industries that produce the input goods and services. Here, this kind of general intermediate consumption price index is defined as the total nominal intermediate consumption of the industries in question divided by a total figure for their deflated intermediate consumption. In other words, it is a weighted harmonic mean of the output deflators of the various industries, weighted according to their intermediate consumption, as shown by the formula below.Intermediate consumption price index of industry number j
=
∑∑
=
∑ ∗ ∑(10)
Table 5: Difference between Intermediate Consumption and Output Deflators, and the Bias by Industry in China for the 2002-2007 Period
Notes:
1) For industries 2-11, “Producer Price Indices for Industrial Products by Sector” China Statistical Yearbook are used. For other industries, the implicit GDP deflator for each industry was calculated and used.
2) The weighted harmonic mean of the output deflators, weighted according to the weighting of the intermediate consumption from each industry.
3) Difference of real VA growth ratio (%) = growth rate – growth rate
= Bias caused by single deflation ÷ the base year Output
deflator
(annual)1)
Implicit deflator of intermediate consumption
(annual)2)
Difference of real VA growth ratio
(annual) 3)
Output deflator
(annual)1)
Implicit deflator of intermediate consumption
(annual)2)
Difference of real VA growth ratio
(annual) 3) 1)Agriculture, Forestry, Animal
Husbandry & Fishery 105.7 104.1 1.2 108.3 104.8 2.4
2) Mining 115.9 104.3 16.7 108.1 104.7 4.3
3)Manufacture of Foods, Beverage &
Tobacco 102.1 104.2 -5.6 102.4 105.7 -10.3
4)Manufacture of Textile, Wearing
Apparel & Leather Products 101.1 102.6 -5.4 101.3 102.8 -6.2
5)Coking, Gas & Processing of
Petroleum 109.4 112.6 -12.6 108.6 107.4 6.1
6) Chemical Industry 104.2 104.7 -2.1 101.6 103.5 -8.2
7)Manufacture of Nonmetallic
Mineral Products 101.2 104.7 -10.0 101.4 104.2 -8.1
8)Manufacture and Processing of
Metals and Metal Products 108.9 107.2 7.2 107.3 106.1 5.7
9)Manufacture of Machinery and
Equipment 99.4 102.5 -12.2 100.9 103.0 -9.7
10) Other Manufacture 101.1 103.0 -4.5 101.6 103.3 -4.5
11)Production and Supply of Electric
Power, Heat Power and Water 103.5 106.6 -5.7 104.0 105.0 -2.6
12) Construction 104.5 103.9 2.0 104.1 104.0 0.4
13)
Transport, Storage, Post, Information Transmission, Computer Services & Software
101.8 103.3 -2.3 105.5 105.6 -0.1
14)Wholesale and Retail Trades,
Hotels and Catering Services 102.3 103.2 -0.9 102.8 104.9 -1.9
15)Real Estate, Leasing and Business
Services 106.9 102.2 4.1 106.3 104.0 1.6
16) Financial Intermediation 101.6 102.8 -0.8 114.2 106.4 4.5
17) Other Services 104.6 103.1 1.7 106.5 103.7 3.2
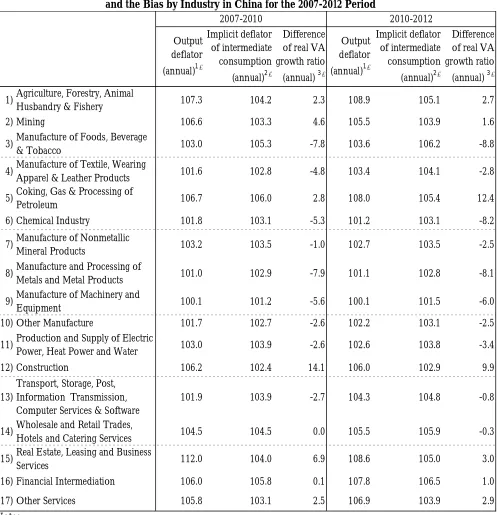
Table 6: Difference between Intermediate Consumption and Output Deflators, and the Bias by Industry in China for the 2007-2012 Period
Notes:
1) For industries 2-11, “Producer Price Indices for Industrial Products by Sector” China Statistical Yearbook are used. For other industries, the implicit GDP deflator for each industry was calculated and used.
2) The weighted harmonic mean of the output deflators, weighted according to the weighting of the intermediate consumption from each industry.
3) Difference of real VA growth ratio (%) = growth rate – growth rate = Bias caused by single deflation ÷ the base year
Output deflator
(annual)1)
Implicit deflator of intermediate consumption
(annual)2)
Difference of real VA growth ratio
(annual) 3)
Output deflator
(annual)1)
Implicit deflator of intermediate consumption
(annual)2)
Difference of real VA growth ratio
(annual) 3) 1)Agriculture, Forestry, Animal
Husbandry & Fishery 107.3 104.2 2.3 108.9 105.1 2.7
2) Mining 106.6 103.3 4.6 105.5 103.9 1.6
3)Manufacture of Foods, Beverage
& Tobacco 103.0 105.3 -7.8 103.6 106.2 -8.8
4)Manufacture of Textile, Wearing
Apparel & Leather Products 101.6 102.8 -4.8 103.4 104.1 -2.8
5)Coking, Gas & Processing of
Petroleum 106.7 106.0 2.8 108.0 105.4 12.4
6) Chemical Industry 101.8 103.1 -5.3 101.2 103.1 -8.2
7)Manufacture of Nonmetallic
Mineral Products 103.2 103.5 -1.0 102.7 103.5 -2.5
8)Manufacture and Processing of
Metals and Metal Products 101.0 102.9 -7.9 101.1 102.8 -8.1
9)Manufacture of Machinery and
Equipment 100.1 101.2 -5.6 100.1 101.5 -6.0
10) Other Manufacture 101.7 102.7 -2.6 102.2 103.1 -2.5
11)Production and Supply of Electric
Power, Heat Power and Water 103.0 103.9 -2.6 102.6 103.8 -3.4
12) Construction 106.2 102.4 14.1 106.0 102.9 9.9
13)
Transport, Storage, Post, Information Transmission, Computer Services & Software
101.9 103.9 -2.7 104.3 104.8 -0.8
14)Wholesale and Retail Trades,
Hotels and Catering Services 104.5 104.5 0.0 105.5 105.9 -0.3
15)Real Estate, Leasing and Business
Services 112.0 104.0 6.9 108.6 105.0 3.0
16) Financial Intermediation 106.0 105.8 0.1 107.8 106.5 1.0
17) Other Services 105.8 103.1 2.5 106.9 103.9 2.9
using Chinese input-output tables and output deflators, based on Formula (10). Let us now compare each to the relevant output deflator and identify the difference between and arising from the difference between the two deflators. In other words, let us identify the bias caused by single deflation where is the estimated value calculated using the single deflation method of direct deflation by the output deflator and is the real value added calculated using the double deflation method where a deflated figure for intermediate consumption is deducted from a deflated figure for output.
First, it is clear that, when looking at each industry separately, in many cases the difference between the value calculated using the single deflation method and that calculated using the double deflation method is much larger than the difference of aggregate real GDP growth seen in Tables 3 and 4. It is also clear that the difference between the two methods by industry shows great variation among the various industries. Where the output deflator is larger than the intermediate consumption deflator, the difference is positive, and the value calculated using the single deflation method is larger than that calculated using the double deflation method, causing overstatement, and vice versa.
Looking at the 2002-2005 period in Table 5, output prices for “Mining” rose by a sharp 15.9% per annum (probably because of the impact of higher prices in international markets), while the price of intermediate consumption used in production in the industry rose by only 4.3%. Because the single deflation method uses the same deflator for intermediate consumption and output, the rise in value added at constant prices is overstated by 16.7 percentage points. The overstatement in the “Mining” industry continues, albeit to varying degrees, in the other three time periods. “Agriculture, Forestry, Animal Husbandry, & Fishery” displays the same trend as “Mining.”
“Manufacture of Foods, Beverage, & Tobacco” serves as an example of the opposite trend. The industry’s intermediate consumption rose because of sustained price increases in the “Agriculture, Forestry, Animal Husbandry, & Fishery” industry, which is the main provider of its materials. However, because its output prices did not rise as much, real value added calculated using the single deflation method is understated in all four periods. This trend is true of manufacturing industry as a whole (industries 3-11), with a few exceptions. With their output prices rising significantly in response to vigorous demand in the market, value added is overstated for “Construction” and “Real Estate, Leasing, & Business Services.” This trend is particularly notable in 2007-2010 and 2010-2012.
5.2 Simulation of the Bias on Contribution by Industry to China's GDP Growth
The single deflation bias, attributable to the difference between intermediate consumption and output deflators, naturally, impacts the relative contribution of each industry to Chinese GDP growth. Table 7 and Table 8 show the rate of contribution of each industry calculated using the single deflation method and the double deflation method. Official Chinese statistics lump together mining and manufacturing (industries 2-11 in our tables), and so the same combined figure is shown here. In addition, for expediency, the combined figure for service industries (industries 13-17 in our tables) is also shown.
It is clear from Table 7 that in both 2002-2005 and 2005-2007, manufacturing industries (industries 3-11) contributed overwhelmingly to Chinese GDP growth. Because official Chinese statistics are compiled using the single deflation method, the contribution of manufacturing industries is understated by at least 10 percentage points. Conversely, the contribution to GDP growth of agriculture, mining, construction, and, especially, services (industries 13-17) is significantly overstated.
Table 7: Comparison between Single and Double Deflation Methods to Show Contribution of Each Industry to GDP Growth for China for the 2002-2007 Period (in Percentage Points)
Note: Totals may not add up to 100, because of rounding them off. Contribution using double deflation
Contribution using single deflation
Contribution using double deflation
Contribution using single deflation
1) Agriculture, Forestry, Animal Husbandry & Fishery 4.4 6.5 0.4 2.5
2) Mining -5.1 -0.3 3.1 5.0
3) Manufacture of Foods, Beverage & Tobacco 6.8 5.5 6.8 4.2
4)Manufacture of Textile, Wearing Apparel & Leather
Products 6.4 5.4 5.3 4.1
5) Coking, Gas & Processing of Petroleum 3.1 2.0 0.7 1.4
6) Chemical Industry 5.0 4.7 8.4 6.0
7) Manufacture of Nonmetallic Mineral Products 6.4 5.1 4.4 3.3
8)Manufacture and Processing of Metals and Metal
Products 0.9 3.9 5.7 8.4
9) Manufacture of Machinery and Equipment 28.4 18.2 21.9 15.8
10) Other Manufacture 4.2 3.0 8.7 8.2
11)Production and Supply of Electric Power, Heat Power
and Water 5.6 4.3 3.7 3.4
61.7 51.7 68.6 59.7
12) Construction 4.8 6.7 4.0 4.6
13)Transport, Storage, Post, Information Transmission,
Computer Services & Software 17.0 17.8 5.3 5.8
14)Wholesale and Retail Trades, Hotels and Catering
Services 7.7 7.9 9.2 8.8
15) Real Estate, Leasing and Business Services -4.2 -2.4 4.4 5.6
16) Financial Intermediation 2.9 3.0 5.4 7.2
17) Other Services 5.7 8.7 2.7 5.8
29.0 35.1 27.0 33.2
Total 100.0 100.0 100.0 100.0
2-11) Mining and Manufacturing Total
13-17) Service Industry Total
Table 8: Comparison between Single and Double Deflation Methods to Show Contribution of Each Industry to GDP Growth for China for the 2007-2012 Period (in Percentage Points)
Note: Totals may not add up to 100, because of rounding them off. Contribution using double deflation
Contribution using single deflation
Contribution using double deflation
Contribution using single deflation
1) Agriculture, Forestry, Animal Husbandry & Fishery 2.1 4.7 1.5 4.4
2) Mining 2.3 4.9 1.0 1.9
3) Manufacture of Foods, Beverage & Tobacco 6.3 3.2 9.3 6.1
4)Manufacture of Textile, Wearing Apparel & Leather
Products 3.7 2.1 2.0 1.3
5) Coking, Gas & Processing of Petroleum 0.6 1.1 -0.6 1.2
6) Chemical Industry 7.7 5.1 9.3 5.5
7) Manufacture of Nonmetallic Mineral Products 2.1 2.0 3.3 2.9
8)Manufacture and Processing of Metals and Metal
Products 8.1 3.4 11.8 7.8
9) Manufacture of Machinery and Equipment 23.0 16.5 13.8 7.6
10) Other Manufacture 2.5 1.5 2.4 1.6
11)Production and Supply of Electric Power, Heat Power
and Water 2.9 2.1 1.5 0.6
59.4 41.9 53.8 36.5
12) Construction 0.6 8.8 0.6 7.3
13)Transport, Storage, Post, Information Transmission,
Computer Services & Software 8.4 6.5 4.7 4.4
14)Wholesale and Retail Trades, Hotels and Catering
Services 11.8 12.4 17.4 17.8
15) Real Estate, Leasing and Business Services 2.0 6.4 4.0 6.6
16) Financial Intermediation 4.5 4.7 10.1 11.2
17) Other Services 11.2 14.7 7.8 11.9
37.9 44.7 44.1 51.8
Total 100.0 100.0 100.0 100.0
2-11) Mining and Manufacturing Total
13-17) Service Industry Total
6.Conclusion
The double deflation method is used by almost all major developed countries as the conceptually preferred method for measuring real value added. However, the use of this method requires input-output tables and detailed price indices. Production of these data on an annual or, better, on a quarterly basis presents many difficulties on a practical level. The 2008 SNA recommends, as an alternative solution, approximation using the single deflation method, by which the nominal value added is simply deflated using the output deflator of each industry. The single deflation method is used by some developed countries such as the UK and, furthermore, it is the main method for calculating GDP growth for many emerging economies such as China and India.
Verification by Li and Kuroko (2016) and Li (2016), based on Japanese data for 1960-2000, first made it clear that, when classifying industries into those with intermediate-good characteristics and those with final-good characteristics, primary industries and almost all secondary industries excluding machinery were identified as having strong intermediate-good characteristics and that almost all tertiary industries excluding for corporate services were identified as having final-good characteristics. Next, it was shown that, regarding relative change in price levels between industries, excluding in the 1970s when the oil shocks occurred, there is tendency for relative decline in product prices in primary and secondary industries in line with economic growth and relative increase in tertiary industry prices, due to an increase in the cost of labor. Therefore, overall, GDP growth estimated using the single deflation method is overstated, because of a relative decline in prices in intermediate-good industries and a relative increase in prices in final-good industries.
However, our empirical analysis based on 2002-2012 data for China, obtained different results. The main conclusions reached as a result of our analysis are as follows. First, unlike the period from 1960 to 2000 in Japan, secondary industries had strong intermediate-good characteristics, and many tertiary industries, especially in the earlier 2002-2007 period, demonstrated stronger intermediate-good characteristics than final-good characteristics. Therefore, despite the fact that throughout the four periods analyzed, as in Japan during the period from 1960 to 2000, tertiary industry prices showed a relative increase, because the rise in prices for intermediate-good industries was greater than that for final-good industries. An opposite trend to that seen in Japan during 1960-2000 was observed, namely that GDP growth calculated using the single deflation method is understated compared to that calculated using the double deflation method. Furthermore, because the final-good characteristics of tertiary industries were stronger in 2007-2012 than in 2002-2007, the understatement of GDP growth using the single deflation method became extremely small. From 2012, there has been an explosive increase in consumption by Chinese people, with a particularly marked increase in consumption related to services, and so it is conceivable that the final-good characteristics of tertiary industries will strengthen. In which case, results different from those obtained in our empirical analysis period are possible.
Furthermore, in verification based on Japanese data for 2000-2014 by Alexander et al. (2017), GDP growth calculated using the single deflation method is understated compared to the published data calculated using the double deflation method. Generally, during periods of economic growth, the price of services rises more strongly that the price of goods. The reason for this could be that, from 2000, business services increased, boosting intermediate consumption by service industries and the intermediate good-characteristics of service industries strengthened.
Another possible distortion of the relative contribution of each industry to Chinese GDP growth attributable to the single deflation method is that, in all periods, use of the single deflation method led to severe understatement of the contribution to GDP growth from manufacturing industries and to overstatement of the contribution of service industries.
Acknowledgements: In preparing this paper I would like to thank Mr. Masato Kuruko (Institute of Developing
Economies, JETRO) for useful comments from collection of materials, checking / editing of the final manuscript.
References
Alexander, Thomas, Claudia Dziobek, Marco Marini, Eric Metreau and Michael Stanger (2017) “Measure up: A Better Way to Calculate GDP”, IMF Staff Discussion Note, SDN/17/02. [Online] Available:
https://www.imf.org/~/media/Files/Publications/SDN/2017/sdn1702.ashx
Bean, Charles (2016) Independent review of UK economic statistics: final report, March. [Online] Available:
https://www.gov.uk/government/uploads/system/uploads/attachment_data/file/507081/2904936_Bean_R eview_Web_Accessible.pdf
Li, Jie (2013) “Some issues concerning the estimation of China’s real GDP: Comparison with Japan”, Business Journal of
Papaios, Vol. 21, No. 1, 2013 (in Japanese).
Li, Jie and Masato Kuroko (2016) “Single Deflation Bias in Value Added: Verification Using Japanese Real Input– Output Tables (1960–2000)”, Journal of Economics and Development Studies, Vol. 4, No. 1:16-30.
Li, Jie (2016) China’s GDP statistics – Comparison with Japan: Estimation Methods and Relevant Statistics, Saarbrucken, Germany: Scholars' Press.
NBS (2008). China non-economic census annual GDP calculation methods, China Statistics Press (in Chinese). United Nations (2009). System of National Accounts 2008. [Online] Available: