The impact of public transparency in fighting corruption
A study on Brazilian municipalities e-governmentJames Batista Vieira
Federal University of Paraiba, Brazil, jamesvieira@unb.br
Abstract: This paper is an attempt to shed light on the causes of corruption through empirical analysis of the impact of public transparency mechanisms on the frequency of improbities in Brazilian municipalities. First, we have presented a new model of corrupt agent´s utility function to better explain the results, and then some empirical evidences in favor of the hypotheses that E-government mechanisms are negatively associated with improbities in Brazilian local government.
Keywords: corruption, municipalities, e-government, transparency, Brazil
Acknowledgement: I would like to thank the Brazilian National Council for Scientific and Technological Development (CNPq) for enabling the study mentioned in this paper. I also thank the revision made by Gustavo Arrussul and Vinícius Renner Silva Ximenes.
he new information and communication technologies, particularly the internet, have given rise to a new society of increasingly interconnected individuals, using and producing services on the web, and gathering the benefits of its available information (BRASIL, 2011c; CASTELLS, 1999). The progress of information and communication technologies in the past few years has transformed contemporary society into the “information society”, a society on which both information and knowledge are regarded as strategic for its operation (ARAKAKI, 2008).
These information and communication technologies (ICTs) have transformed society and have created the context on which was born the electronic government (E-government or simply e-gov). It can be described as the use of ICTs to promote the government’s services and information provision. On the Internet, the e-gov finds its best expression on the government homepages, integrating information and services of both State and citizens interest. It also permits the achievement of higher levels of effectiveness and efficiency of the provided services, both for citizens and enterprises. Moreover, it may eventually promote a higher level of participation in the decision making process (ARAKAKI, 2008, p. 14).
There are a few examples of possible uses of information and communication technologies by the government: issuance of documents, information provision related to public services, monitoring of government actions, conduction of public affairs, access to leaders and elected representatives. Therefore, the possibility of access to services, participation in decision making and monitoring of government actions by organized citizens require the adoption of digital ways and means in all government levels. This means the employment of information and communication technologies for the benefit of effectiveness, transparency and governance (TAKAHASHI, 2000, p.8).
best possible experience of electronic government access, respecting and including the peculiarities of the target population (BRASIL, 2011a). Moreover, the e-gov must be understood as an initiative to modernize public administration and make it more effective, efficient with efficacy, being also a result of the process of evolution of bureaucratic management models (ARAKAKI, 2008).
On the other hand, the literature devoted to the study of the corruption phenomenon is rich in hypotheses that attempt to explain the main causes and effects of corruption in the public sector. In this sense, there is a consensus that transparency is a core value of democracy and an indispensable factor for fighting against corruption. However, the literature presents different views on the relationship between new information technologies and its new and promising possibilities of preventing and fighting corruption (KLITGAARD, 1994; PEREIRA, 2002; ANDERSON, 2009; SHIM & EOM, 2008; 2009). For many years, the debate seems to have swung between optimists (those who aspire to the day when new technologies will allow all citizens to participate in the political process of decision making into an entirely virtual space) and pessimists, who reject this perspective, and deem it unrealistic (WILHELM, 2000). Nowadays, a more optimistic view, shared by this paper, is constantly showing more and more evidence in favor of a positive impact of the new information and communication technologies, of trust and confidence in government, and an improvement in a culture of transparency in public sector, etc. (TOLBERT & MOSSBERGER, 2006; BERTOT et al, 2010).
Aiming to contribute to this field of research, this paper presents the theoretical implications of an original corruption analysis framework, based on corrupt agent’s utility function. It also conducts the testing of a statistical model, in order to empirically assess the association between e-government quality and the observed occurrence of corruption cases in a sample of 960 municipalities audited by the Audit Program by Public Draws of the Brazilian General Comptroller´s Office (CGU). The purpose of this framework is to help readers understand the arguments in an organized, detailed and open manner. The main hypothesis is actually centered on the relationship between the quality of e-governance and corruption, even though some secondary characteristics were eventually considered to enrich the explanation of this empirical association.
1.
The components of the agent’s utility function
Despiteall the criticism, it is feasible to assume that agents will perform a cost-benefit analysis before their engagement on a corrupt transaction (BECKER, 1968). Most of the models of corrupt behavior are based upon the analysis of rational action (EIDE, 1997). In accordance with this assumption, I state that the corrupt agent will observe the following elementary equation:
Equation (1.0)
Where,
Ua = Corrupt agents´ utility function; b = Potential benefits from engagement;
c = Potential costs from engagement.
2.
Analysis of the potential benefits
According to Donatella Della Porta and Alberto Vanucci (2005), the benefits perceived by the agents engaged in a corrupt transaction are usually expressed in the forms of bribes (financial, material or symbolic resources). The utility extracted by the agent is a result of a subjective assessment of the agent, but without exceptions, it can be summarized in a kind of direct or indirect rent (obtained by privileged contracts, inside information, monopolies, etc.) (KRUEGER, 1974; GORTA, 2006).
The public choice theory emphasizes the role of benefits on the corrupt agents´ utility function. That is why the rent-seeking perspective understood corruption as the result of monopolistic rents granted by the State. (JAIN, 2001). According to them, corrupt transactions are directly caused by the incentives of these complementary rents, including strategies like lobbing, bureaucratic capture and so on (TULLOCK, 1987).
On the other hand, the role of agents´ wage cannot be neglected. As Robert Klitgaard (1994) and Vito Tanzi (1997) stated, an increase in the average wages, especially in the public sector, expressively contributes to reduce corruption.1 Attractive wages in the public sector reduce the incentives to engage in corrupt transactions by reducing the corrupt agents’ utility.
The corrupt agent’s total benefit is based upon the following equations (2.0):
Equation (2.0)
Where,
= Agents´ total benefit;
r = Potential rents (benefits arising out of corrupt transactions) w = Wage (benefits not arising out of corrupt transactions)
Nevertheless, the corrupt agents´ utility cannot be properly understood only as a result of the potential benefits – costs fulfill an essential role in the corrupt agents´ utility function.
3.
Analysis of the potential costs
Contracts are not free of costs. Every contract attempt imposes a series of transaction costs, for negotiating, designing, implementing and enforcing agreements (COASE, 1937; NORTH, 1990; WILLIAMSON, 1985; BROUSSEAU & GLACHANT, 2002).2
According to the new institutional economics principles, the efficiency and integrity of the contracts are based upon an institutional environment capable of limiting the opportunism – the main cause of transaction cost.3 Contracts expose individuals to the risk of opportunism, especially when it is associated with asymmetric information.4 This is the reason why it is absolutely essential to pay close attention to the adequate safeguards of contracts - aligning interests and improving the mechanisms of governance (WILLIAMSON, 1985; 1996).
Particularly for the analysis of the corruption phenomenon, it is necessary to perceive the differences between the transaction cost of the principals and the corrupt agents all together.
1
According to Caroline Van Rijckeghem and Beatrice Weder (1997), it is particularly true when the average wages in the public sector were close to that practice in the private sector (called fair income). For more reviews, please consult Ting Gong and Alfred Wu (2012).
2
The main transaction costs can be classified in ex ante (select partners, bargain, design the contract) or ex post (oversight, enforce, renegotiate the contracts).
3 The opportunism concept extends the simple self-interest seeking; it is better understood as the “self-interest seeking with guile”(WILLIAMSON, 1985, p.47).
4.
Transaction costs I: from the principal´s perspective
Under the principal´s perspective, the resources spent to enforce the contracts are seen as the transaction cost. The logic is absolutely the same in public and private domains – in both cases, principals should develop adequate mechanisms of governance for integrity.
Governments and firms are continuously signing contracts and incurring transaction costs, and both are continuously trying to reduce these costs for efficiency reasons. For Ronald Coase (1937), Robert Simon (2000) and others, the ideal size of governments and firms can be properly evaluated from a transaction cost analysis. There is indeed a trade-off between integrity and its costs, exactly as Robert Klitgaard said (KLITGAARD, 1994). For this reason, it is absolutely essential to evaluate, according to a risk criteria, how much resources can be or should be invested on integrity mechanisms (SMITH & LIPSKY, 1993).
It is not hard to predict that a substantial amount of public and private money will be spent just to sustain these mechanisms. Nevertheless, such expenditures are fully justified in the face of the large negative impact that corruption has on profits (private domain) and social development (public domain) (GAMBETTA, 1998, p.59).
These particular transaction costs that function as “mechanisms of integrity” are summed up in the following equation (3.0):
Equation (3.0)
Where,
G = mechanisms of integrity;
Se = mechanisms of information search and bargain;
Po = mechanisms of policing opportunistic attitudes; En = mechanisms of enforcing.
According to Oliver Williamson (1985), mechanisms of information search and bargain impose ex ante costs to the principal, but are essential to preserve the contracts integrity and avoid the higher ex post costs of policing and enforcing. Furthermore, it is worth emphasizing that these last ex post mechanisms must be dealt with in a coordinated manner. Both mechanisms are viewed as necessary conditions to sustain the integrity of contracts. As Oliver Williamson asserts, these mechanisms reflect the key ex post transaction costs: information search and enforcement (WILLIAMSON, 1985, p.21).
The mechanisms of policing and enforcing might integrate formal and informal initiatives. In other words, auditing oversight and monitoring (formal) are functional for policing purposes as much as for social control (informal). In the same way, the mechanisms of enforcement assume a formal (administrative, civil or legal measures) and an informal (social) dimension. The formal ones are related to legal prosecuting and sentencing of the guilty - depending on the legislations severity. On the other hand, the main informal punishment mechanisms available are strictly linked to the moral costs (like shame and other sorts of psychological and social punishments).
5.
Transaction costs II: from the corrupt agents perspective
It is not hard to perceive that a corrupt transaction imposes as many costs as a legal one. Actually, as Johann Graf Lambsdorff (2002) declares, corrupt transactions inflict higher transaction costs to their partners because corruption demands secrecy to prosper. According to him, transaction costs are particularly higher in corrupt agreements because:
i. entirely replace the jurisdictional protection of property rights;
ii. enforce the initial agreement and maintain impunity between partners (LAMBSDORFF, 2002, p. 223).
In sum, the corrupt agents’ total costs could be determined by corrupt transaction costs plus the integrity mechanisms costs, as described in the following equation (4.0):
Equation (4.0)
Where,
C = corrupt transaction total costs;
i = costs of information search on secrecy (about partners and potential gains);
n = costs of bargain on secrecy;
e = costs of sustaining a private mechanism of governance needed to enforce the agreement and the property rights;
s = risk imposed by the social sanction (reputational risk);
y = risk of suffering the costs of institutional accountability measures.
Undoubtedly, the extent of institutional accountability will occupy a prominent position for those agents when evaluating the costs of their involvement in corrupt transactions. The agents’ costs include, but are not restricted to: search of information about the potential benefits arising from engagement; the costs of negotiating/bargaining of benefits arising from corrupt transaction with third parties; the cost of ensuring effective property rights taken from the agreement and; the eventual costs imposed by the reputation damage if the transaction is revealed (expressed as a probability of occurrence). The agent must also consider the probability of incidence to the accountability costs (notifications, fines, restitution, contractual termination, rights and freedom restriction).
Therefore, the analysis of the constitutive components of institutional accountability mechanisms, as described in the equation (5.0) is of utmost importance:
∑
Equation (5.0)
Where,
y = risk of suffering the costs of institutional accountability measures; n = number of possible punishments;
x = penalties available to unrighteous agent; z = process execution;
t = time horizon.
process (rule implementation e rule adjudication) is of utmost importance, described in the proposition (1.0):
r ˄ d ˄ p ˄ j ˄ e ↔ z Proposition (1.0)
Where,
z = process execution;
r = revelation; d = denunciation;
p = process (form and appropriate time);
j = judgment; e = execution.
The biconditional proposition (1.0) establishes that the process (z) consists of five necessary elements, which together are sufficient to set success for the institutional process (z=1(V)). Otherwise, if some of these elements are not present, the process execution will fail (z=0 (F)), resulting in the cancellation of accountability institutional costs according to the equation (5.0).
Notice that the equilibrium between these variables is not static, but rather dynamic. There is a dynamic interaction between agents and institutions whose evolution by social interaction and institutional adaptation tends to orient its development, thus resulting in a significant impact on the agents utility function (NORTH, 1990). The main dynamic aspects of this relationship are the learning processes and the moral barrier, which will be subject of further analysis.
6.
Dynamical features I: learning processes
One of the main complementarities presented by Douglass North (1990) - largely described on corruption practices by Alessandro Pizzorno (1992) - are called the learning processes.5 These learning-by-doing processes result from the repetitive interaction between agents and might raise the corrupt utility for promoting innovations in two different ways:
a) expanding the corrupt potential benefits; and/or
b) reducing the corrupt potential costs.
These learning factors integrate the corrupt agents´ utility function as the following:
[ ] Equation (6.0)
Ua = corrupt agents´ utility function;
k1 = learning about or innovating for rising the potential benefits; k2 = learning or innovating for reducing the potential costs.
According to this equation, agents would not extract utility (take part) in a corrupt transaction if they ignore the potential benefits of engagement (k1=0) and its transaction costs (k2=0). Agents would become corrupt only when they perceive, by learning processes, a real possibility to extract benefits (k1≥1) or reduce the corrupt transaction costs (k2≥1).
7.
Dynamical features II: agent´s moral barriers
Finally, it is important to stress that any utility, originated by a corrupt transaction, is only realized if the barriers of moral costs were surpassed.
Equation (7.0) Equation (7.1)
CM(x) = agents´ moral cost function
This equation (7.0) revels that the moral cost is a crucial aspect of agents’ decision in corrupt engagement. If agents were susceptible to moral cost appeals (CM (x)>0), the expected utility for engagement would be null (Ua =0).
As seen from equation (6.0), the moral cost consists of three elements traditionally highlighted in psychological studies of corruption:
[ ] Equation (8.0)
CM = agents’ moral cost;
c = blame (costs imposed by ethical principles and moral values of agent);
v = civic values (costs arising from socio-cultural values of his group); t = reputation (cost of social sanctions imposed on offenders).
Equation (8.0) highlights the psychological (blame) and social (trust) of the agents moral cost. The first tends to be heavily influenced by moral perspective and by the agent’s internalized ethic during his education and constantly reinforced by the continuing influence of civic and socio-cultural values of the groups to which the agent belongs, such as school, work, civic associations, political community in general, and so on. If these principles are violated, they will lead to the feeling of blame and psychological discomfort, coming from the agent’s personality and social environment. Furthermore, one must consider the relevant costs that the socially shared values impose on the detractors in terms of trust and reputation.
With respect to moral values and ethical principles, the social reputation and the shame play a very important role in the moral costs dimension. Socialization processes in the family, at school, at work, and at places where social life happens, are constantly influencing the individuals moral cost value. That is the reason why many experts, like Robert Putnam (1996), Júlio Gonzalez and Timothy Power (2003), are evidencing the significant impact of social capital on corruption prevention and control.
In the jargon of Douglass North (1990) new institutional economics, moral cost functions like an entrance barrier on corrupt transactions. As its components have a strong sociocultural influence, but can individually vary; the moral costs are directly associated with the agents´ adaptive expectations. I mean, if the corrupt transactions were widely spread, agents would be motivated to easily engage in such agreements.
As an example of the analytical potential of this framework, in the following chapter I propose a reinterpretation of E-Government and better access to information contributions to the fight against corruption.
8.
Theoretical implication
How does e-gov and better access to information contribute to the fight against corruption? In accordance with the ordinary literature, the e-gov tools enrich the interactions between government and citizens, government and businesses/commerce, government and employees, and between government and other governments /agencies. (JEONG, 2007). Among many other things, e-gov strengths are the operations of public organizations with beneficial effects on its democratic governance – supporting social and institutional controls, citizens participation in decisions and evaluation of government operations and results. In addition, e-gov improves the public access of information – one of its most transparent and elementary dimensions.6
According to the previous model, corrupt transactions will not flourish (corrupt agents´ utility function decays) in environments with robust integrity mechanisms. As the model predicts, it occurs because of overweighed costs imposed by e-gov on corrupt agents’ utility. For these reasons, the influence of e-gov would be particularly perceived by the corrupt agents:
on reducing the benefits, because:
1. the value contracted by the government would be publicized (preventing overbilling);
2. the wages of the government officers would be publicized (allowing the social control of unjust enrichment);
on rising the costs, because:
3. better access to information lets the citizens (informally) and agencies (formally) control the public decisions (specially the public budget); [increasing oversight]
4. better coordination between State´s agencies, supported by superior information management, perfects their enforcement efforts.
I mean, the previous model asserts that corruption would be reduced as much as the mechanisms of e-gov are developed, because it has a great and negative impact on corrupt agents’ utility. Theoretically speaking, these mechanisms of integrity, available by the new e-gov tolls, will impose a significant risk on agents’ engagement in corrupt transactions and other opportunistic attitudes against the public contracts. That is the reason why improbity in general – including corrupt transactions – is expected to be reduced by these mechanisms of integrity.
9.
Empirical evidences on Brazilian Municipalities
The main data source of this research was the Public Draws Audit Program, one of the initiatives of Federal System of Internal Control (SFCI) of the Office of the Comptroller General (CGU) an agency of the Presidency of the Republic, created by executive order nº 2.143-31, from April 2, 2001 (BRASIL, 2001). The Comptroller General Office has the function of assisting the President of the Republic on matters relating to the defense of public assets, internal control, public audit, ombudsman and access to public information. The internal control activities are the responsibility of the federal government, as expressed by article 74 of the Federal Constitution. After 1994, it was centralized at the Federal Internal Control Office of the Comptroller General Office (BRASIL, 1988). These assignments are expressly defined in law nº 10.683 from May 28, 2003 (BRASIL, 2003).
6 ‘E-government' (or digital government) is defined as: ‘the employment of the Internet and the world-wide-web for
TABLE 1. Technical specification of Audit Program
Year established 2003
Draws made (until 2012) 35
Audited municipalities (1º to 35º) 2.051 (36% of Brazilian municipalities)
Audited resources Approximately R$ 15 billion
Source: CGU, 2012; IBGE, 2011.
The choice of municipalities to be audited is at random and is accomplished through the mechanism of draw of Caixa Econômica Federal (Brazilian government bank), ensuring transparency in the selection process. In the first draw, 5 municipalities were audited, 26 in the second, and 50 from third to ninth. From the 10th on, 60 municipalities are audited by lottery operation. The program covers municipalities with up to 500 thousand inhabitants – covers 99.3% of Brazilian municipalities and approximately 70% of the Brazilian population (IBGE, 2011). The federal funds invested in all government programmatic areas of small municipalities (up to 20 thousand inhabitants) are analyzed; in midsize municipalities (between 20 and 500 thousand inhabitants) areas like education, health and social care, plus two others selected at each drawn operation are analyzed. (CGU, 2006).
After the draw, during the preparation phase of the audit, information is collected about the transfer of federal funds in the municipality, the signed agreements, and any allegations and suspicious improbities pointed out by the media or the population. On average, audit actions last a week. In this period, the federal funds passed in the current year and in the past two financial years are analyzed.
After identifying the transfers made by the Union for each municipality audited, a set of Work Orders (WO) is prepared that detail the steps that should be met by the auditors during the in loco inspection. This is referred to each in program or part of program, which may or may not be linked to a specific amount of federal public resources. The WO are work guidelines for auditors, they identify resources, investments, processes, works, programs, services and results that will be subject to auditing (LOPES, 2011, p. 32).
During the auditing period, finance and control analysts among other actions, conduct an examination of agreements, bids, invoices for purchases, they also physically inspect buildings, check the functioning of municipal councils, conduct interviews with the recipient public of government programs (CGU, 2006). 7 In summary, auditors assess the compliance of the resources application and the results, expressing them through the findings of compliance or irregularity. The products of these actions are the “municipal inspection reports” summarizing the results of the audit in municipalities audited. 8
In this document are described all the comments, information notes and failures observed, which are fully disclosed in the electronic address of the Comptroller General Office (2012). Furthermore, crafts are shipped with the results directly to these agencies: municipal governments, City Councils, State Justice Prosecutors from audited municipalities, the Federal Ministries, the Federal Prosecutor, Court of Audit of the Union, General Attorney of the Union, the presidencies of supervision and control committees of the Representatives’ House and the Federal Senate, among others, which I have highlighted to the Federal Police.
7 It is worthy emphasizing that, despite their legal federal autonomy, with a small exception, Brazilian municipalities are great dependent of the Union transfers, the most important fiscal income for sustain local´s public policies.
8
10.
Case exploratory analysis
The research analyzed all municipalities randomly selected between 20º and 35º drawn operations (between the years 2006 and 2011) of the monitoring program – the whole period in which the data were compiled and made available by the Comptroller General Office. This represents set of 960 cases of Brazilian municipalities drawn over a period of six years.
TABLE 2. Number of draw municipalities
Year Number of drawn municipalities
2006 180
2007 180
2008 120
2009 180
2010 180
2011 120
Total 960
Source: Comptroller General Office, 2012.
According to the figure (1.0), this set covers approximately 15% of Brazilian municipalities. Of this total, 111 are in the North region (12% of the sample and 24.6% of the population), 384 in the Northeast region (40% of the sample and 21.5% of population), 78 in the Midwest region (8% of the sample and 17% of population), 231 in the Southeast region (24% of the sample and 14% of population) and 156 municipalities in the South region (16% of the sample and 13% of population).
In addition, 664 cases (69% of the sample) are considered small municipalities (up to 20,000 inhabitants) and 296 cases (31% of the sample is medium-sized cities (between 20,001 and 500,000 inhabitants). According to the IBGE (2011), this population of municipalities, up to 500,000, corresponds add to 99.3% of the total. About the sampling process, it is worth highlighting that these set of municipalities represent a probabilistic random sample of Brazilian municipalities, but its parameters cannot be adequately determined, because we do not know the values of the variable interest in the population and the maximum error considered for this variable.
FIGURE 1. Geographic distribution of the cases Source: developed by the author
11.
Data exploratory analysis
Regarding to the units of observation, it is noteworthy that all the findings described in the monitoring reports were analyzed, this classification was conducted by the analysts of finance and control of the Comptroller General Office. In total, 67.194 were considered, and classified as information and feedback, formal failures, medium failures and serious failures (CGU, 2010). The proxy indicator of corruption was made solely by counting the serious failures in the municipalities, like:
I – The practice of an illegal management act, illegitimate, uneconomic; or the infraction of a legal norm from accounting, budgetary, operational or of asset nature, as long as it has the potential to cause injury to the exchequer or configure serious deviation from the guiding principles of Public Administration.
II – Damage to the exchequer due to illegitimate or uneconomic management act; and III - Embezzlement or misappropriation of public funds or properties
Also included is the breach of regulation concerning the Public Administration, which usually indicates the seriousness of such acts and provides the possible sanctions against the accountable public officials, among which stands out is the omission from the account duty (CGU, 2010).
TABLE 3. Descriptive statistics of failures
N Mean Standard
deviation
Variance Asymmetry Kurtosis Corruption
960 9,17 12,36 152,88 2,40 7,56
Kolmogorov-Smirnov (p <.001) and Shapiro-Wilk (p <.001) Source: developed by the author
Besides the analysis of these assumptions, it is worth noting that some elements exert a significant statistical influence on the behavior of this indicator (this is why they must be considered as possible control variables). Among these factors, a few points stand out: (1) drawn operations, (2) political-administrative regions of the country, (3) size of municipality: small (up to 20,000) or medium (between 20,001 and 500,000 inhabitants).
11.1. Draw operations
The average frequency of the failures that occurred, along the 16 draw operations are described in the graphic (1).
GRAPHIC 1. Average number by draw operation.
Source: Comptroller General Office (2012).
The results of the variance analysis test (ANOVA), described in the table (C) of Appendix, revealed that the differences observed between the audit operations, although statistically significant, had a negligible effect: F (15,959) = 2,22, p<.05, ω = .018. Therefore, this variable was not considered as a control variable.
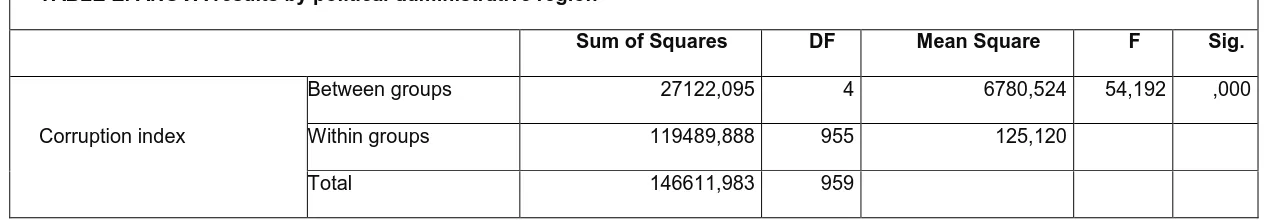
11.2. Regional differences
The average frequency of these failures occurred, in the political-administrative region of the country, as described in the graphic (2)
0 2 4 6 8 10 12 14 16
20 21 22 23 24 25 26 27 28 29 30 31 32 33 34 35
Frequenc
y
GRAPHIC 2. Average frequency by region.
Source: Comptroller General Office (2012)
The results of the variance analysis test (ANOVA), described in the tables (D)(E) of Appendix, revealed that there is a statistically significant difference between the political-administrative regions of the country, despite their small effect (F (4,955) = 54,19, p<.001, ω = .1814). Therefore, the political-administrative regions of the country will be considered as the control variable.
11.2.1.Size of the municipalities
The average frequency of occurrence of indicators, according to the size of the city, small (up to 20,000 inhabitants) or medium (between 20,001 and 500,000 inhabitants), is depicted in the graphic (3).
GRAPHIC 3. Average frequency by municipality size
Source: Comptroller General Office (2012).
The results of the Mann-Whitney test (Monte Carlo method), described in the tables (F) (G) of appendix, revealed the mean of small municipalities (Mdn=459,0). Despite its small number, it is significantly different from medium size municipalities (Mdn=528.6), U= 84035,5, z = -3,605,
Southest South Midwest North Northest Corruption index 3,6 3,54 6,55 9,28 15,31
0 2 4 6 8 10 12 14 16 18
Fre
quenc
y
0,00 2,00 4,00 6,00 8,00 10,00 12,00 14,00
Small Medium
Municipality Size
p<.001, r = -.116. Therefore, the variation caused by the municipalities’ size will be considered as a control variable.
12.
The data analysis technique
With the aim of constructing arguments statistically robust, was used one statistic technique of data analysis called Generalized Linear Model (GML), wherein the estimation models allow the use of response variables following a non-normal behavior. Conventional regression models could not be used with this data because, according to the descriptive statistics presented in the table (2), the empirical distribution of variable response is asymmetric.9
In generalized linear models, it is assumed that the generated distribution for each variable output to be explained (Y) assumes some of the particular forms of the exponential family – a large family of distributions that share common characteristics in their analytic form (DEMÉTRIO, 2002; DOBSON, 2001).
Thus defined, such a model should contain three elements:
1. the response variable (Y) pertaining to the exponential probability family;
2. the linear predictor:
η=Xβ Equation (8.0) 3. the linking function:
E(Y) = μ = g-1(η)
Equation (8.1)
Defining these three elements, follows the interactive procedure until the convergence. In this process:
It is defined the initial estimative of η and μ;
It is found the adjusted dependent variable and the weights;
Finally, β it is estimated considering the weights and the adjusted dependent variable.10
For all of the models, the proxy indicator of improbities was the number of occurrences of serious failures by a municipality. The value of this indicator was controlled by the “number of objects” subjected to inspection, value represented by the number of issued services orders, by municipality, in each drawing operation, by the Comptroller General Office headquarters in Brasilia. Thus, as the number of audited objects by municipality is also a variable11, the models presented below will use the variable Objects as “offset”, with the goal of making comparable the counting of serious occurrences of improbities in various Brazilian municipalities in study.
Finally, it is noteworthy that the improbity indicator, aggregated to the Generalized Linear Models, has advantages over the other existing objective indicator, because:
5. The indicator approaches the concept of contractual improbity while controlling the number of failures by the number of WO dispatched to the municipality. That is, the model
considers the occurrence of improbities connected to a determined number of “audited contracts” (work orders);
9
Due to the violation of this assumption, shared by all of the users of the CGU audit information, it is not suitable to analyze such data using parametric tests. The analysis requires robust or nonparametric tests (assumptions-free): this is the reason why the results obtained by Ciro Biderman e George Avelino (2011), Marcos Felipe Mendes Lopes (2011) e James Batista Vieira (2009) deserve reevaluation.
10 For this the statistic tool SAS/STAT was used, whose employment reinforces the reliability of the found estimates. 11 That is to say, cities with identical values for the predictors may have different values for Y
i, which would led to a
6. It also emphasizes the number of failures per contract (which could indicate more than one type of failure by WO) instead of counting the number of work orders with failures
(preventing the register of more than one instance of failure by WO).
For these reasons, the indicator of serious improbities proposed (the counting of serious occurrences of failures) assumes approximate values (proxies) quite reliable of those contractual improbities.
13.
The electronic government model
In order to measure the quality of the E-Government mechanisms on Brazilian municipalities, I have used a proxy, based on the indicator elaborated by the Brazilian Institute of Geography and Statistics (Instituto Brasileiro de Geografia Estatística - IBGE) that classified all the local government webpages in Brazil, according to the following categories: informative, interactive and transactional.
The first phase (informative) is characterized by the description of the basic information required for procedures or services, such as where to get it, time and place of institution functioning and the necessary prerequisites. They are usually static, basic and limited information with a general purpose. Still, each service is clearly identified with the institutional unity that runs the service.
The second phase (interactive) offers the possibility of research, achievement and submission of the necessary forms to carry out the procedures, as well as links to other relevant information. The model is still focused on the formal structure and the government departments are referenced according to the organizational chart.
The last phase (transactional) allows the complete obtaining by online means. The service is fully performed by electronic means and is available 24 hours, 7 days a week, and the departmental structure behind the provision is no longer perceived. At this stage, users can even conduct online financial transactions. The focus is to build self-service applications and also use the web as a complement to other delivery channels (BRASIL, 2007b, SOOD, 2003).
With the aim of empirically evaluating, this association was tested with the one Linear Generalized Model, in which the natural logarithm of improbities occurrence was taken as the response variable ln(Yi) and the explanatory variable was the indicator of the quality of the municipal homepages, as classified by the Basic Research of Information from IBGE (2006).
Due to the asymmetrical shape in which the response variable distributes, one observed feature in the exploratory analysis, the Poisson distribution was used as to model the error in the model (with the standard linking function, log). It was tested with the following model:
Equation (9.0)
Where = natural logarithm of the number of improbities for the ith municipality = constant of the model; = indicator of quality of e-government of the ith municipality; = indicator of quality of e-government of the ith municipality; = indicator of quality of e-government of the ith municipality; = indicator of quality of e-government of the ith municipality; = dichotomous variable that indicates the size of the ith municipality (0 = small or 1 = medium)
= dummy variable indicating the political-administrative region of the ith municipality,
= offset variable that indicates the number of service orders shipped to the ith municipality, = error.
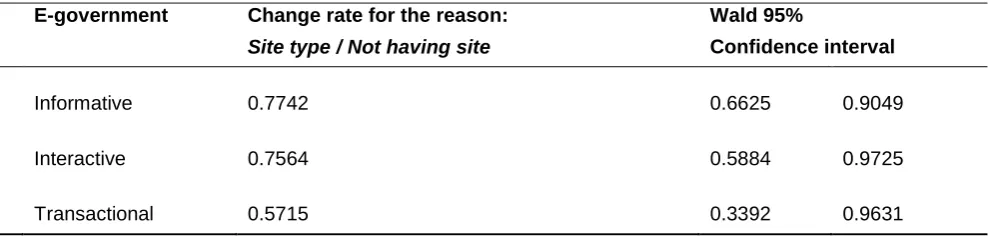
(ChiQd<.001). According to the table (x), the municipalities with electronic sites in preparation have not shown significant difference in relation to municipalities not having electronic sites. However, the municipalities in which the sites were classified as;
a. Informative has on average 22.58 less serious improbities than those not owning a site;
b. Interactive has on average 24.36% less serious improbities than those not owning a site; c. Transactional has on average 42.85% less serious improbities than those not owning a
site.
TABLE 4. Change rates
Source: Brazilian Municipal Corruption Data Bank (2012)
14.
Conclusions
E-government can be viewed from four different perspectives: that of the citizen (supply of public utility services to citizens); procedures (remodeling of government processes, aiming higher efficiency); cooperation (integration of government agencies with themselves and with other private and non-governmental organizations, in order to streamline the decision-making process, without loss of quality); knowledge management (creation, management and dissemination of knowledge created and accumulated in government agencies using the appropriate repository) (LENK; TRAUNMÜLLER, 2001). Anyway, e-government is an important instrument of social transformation, as it serves as a means to:
Promote citizenship and development: the e-government should be focused on the citizens demands, the access promotion and rights consolidation (the access to public services, information, time and displacement saving, being heard by the government, social control of public officials actions, political participation);
Promote the change of public organizations by means of improving citizen service and public resources rationalization use. It does not mean only providing information and services on the Internet, but also to make sure that the government’s presence benefits the whole society and promote the effective access to the public services. In addition, access should be as broad as possible, enabling e-government to build social control and political participation capacities. Promote the dissemination of knowledge management practices in the public administration, by
means of shared and collaborative information and knowledge production in the public sector, enabling coordination and strategic management of public policies (essential to the integration of the various levels of government) (BRASIL, 2007).
Along the same lines, the model of Alexandre Fernandes Barbosa et al. (2004) considers the relations of e-government from the point of view of internal and external context:
E-government Change rate for the reason: Site type / Not having site
Wald 95%
Confidence interval
Informative 0.7742 0.6625 0.9049
Interactive 0.7564 0.5884 0.9725
Internal context: focus on public administration: involves efforts of debureaucratization, transparency, disintermediation and operational efficiency;
External context: focus on the citizen: involves efficacy and public services quality, the development of information society, digital inclusion and social control (BARBOSA et al, 2004).
Regarding the e-government promotion program of the federal government, these initiatives aim to maximize the use of information and communication technologies (ICTs) to democratize the access of information in order to broaden the debate and popular participation in the building of public policies and improve the quality of services and information provided. In short, one can say that e-government policy in Brazil follows a set of guidelines, based upon three key ideas: citizen participation; improvement of state inner management and; integration with partners and suppliers (BRASIL, 2011b). The policy objectives are: transform the relationship of government to society and promote interaction with citizens, businesses and government agencies; contribute to the democratization process of the country; streamline the provision of public services and provide a more efficient public administration – so that society may use these new tools to express itself with the government (BRASIL, 2011c).
For all these reasons, it is not an accident the fact that in Brazilian municipalities the frequency of improbities is negatively associated with the quality of E-government. And this is because, as predicted by the framework, E-government raises the costs of corrupt agent. In sum, the influence of E-Government would be particularly perceived by the corrupt agents:
on reducing the benefits of engagement on corruption, because:
the value contracted by the government would be publicized (preventing overbilling); the wages of the government officers would be publicized (allowing the social control of
unjust enrichment);
on rising the costs of corrupt transactions, because:
better access to information would let the citizens (informally) and agencies (formally) control the public decisions (specially the public budget); [increasing oversight]
better coordination between State agencies, supported by superior information management, perfects their enforcement.
References
ANDERSON, T. B. (2009). E-government as an anti-corruption strategy. Information Economics and Policy. 21 (3). 201-210.
AOEMA. (2005). E-government from a user's perspective. Retrieved December 10, 2011, from: http://www.aoema.org/E-Government/Stages-Phases_of_e-government.htm.
ARAKAKI. C. (2008). O Governo Eletrônico como Instrumento de Aproximação do Governo e o Cidadão. Dissertação de Mestrado. Faculdade de Comunicação. Universidade de Brasília: Brasília.
BIDERMAN, C. & AVELINO, G. (2011). Terceiro relatório de pesquisa. Convênio EAESP/FGV-CGU: A auditoria como instrumento de gestão e de prevenção da corrupção. São Paulo: FGV.
BARBOSA. B. et al. (2004.) Governo Eletrônico: Um Modelo de Referência para a sua Implementação. Congresso Anual de Tecnologia da Informação – CATI. São Paulo: FGV-EAESP.
BARNETT, V. (1974). Elements of SamplingTheory. London: The English Universities Press Ltd.
BECKER, G. (1968). Crime and Punishment: An Economic Approach. Journal of Political Economy. 76. 169-217.
BRASIL. (2011a). e-PWG - Padrões Web e-GOV. Disponível em: http://www.governoeletronico.gov.br/acoes-e-projetos/padroes-brasil-e-gov. Acesso em: 20 jul. 2011.
BRASIL. (2011b). Histórico do Governo Eletrônico. Disponível em: http://www.governoeletronico.gov.br/o-gov.br/historico. Acesso em: 20 jul. 2011.
BRASIL (2011c). Princípios e Diretrizes. Disponível em: http://www.governoeletronico.gov.br/o-gov.br/principios. Acesso em: 20 jul. 2011.
BRASIL. (2007a). Decreto n° 6.029, de 1º de fevereiro de 2007. Institui o Sistema de Gestão da Ética do Poder Executivo Federal. Brasília: Diário Oficial {da} República Federativa do Brasil, Poder Executivo. CGU.
BRASIL. (2007b). Ministério do Planejamento, Orçamento e Gestão. Departamento de Governo Eletrônico. Indicadores e métricas para avaliação de e-Serviços. Brasília.
BRASIL. (2003). Lei nº 10.683, de 28 de maio de 2003. Dispõe sobre a organização da Presidência da República e dos Ministérios, e dá outras providências. Brasília: Diário Oficial {da} República Federativa do Brasil, Poder Executivo. CGU.
BRASIL. (2001). Medida provisória n° 2.143-31, de 2 de abril de 2001. Altera dispositivos da Lei no 9.649, de 27 de maio de 1998, que dispõe sobre a organização da Presidência da República e dos Ministérios, e dá outras providências. Brasília: Diário Oficial {da} República Federativa do Brasil, Poder Executivo. CGU.
BRASIL. (1988). Constituição. 1988. Constituição da República Federativa do Brasil. Brasília: Senado Federal.
BRAZILIAN MUNICIPAL CORRUPTION DATA BANK. (2012). Databank.
BROUSSEAU, E. & GLACHANT, J. (2002). The Economics of Contracts. Theories and Applications. Cambridge University Press, Cambridge.
CASTELLS, M. (2000) A Sociedade em Rede. Tradução de Roneide Venâncio Majer. São Paulo: Paz e Terra.
CGU. (2012). Ofício n° 63XX/2010/SE/CGU-PR. Informações sobre Programas de Fiscalização e atualizações. Database. Brasília: 04 de março de 2010.
CGU. (2006.) Manual Operacional do Programa de Fiscalização a partir de Sorteios Públicos. Brasília: Secretaria Federal de Controle.
CHADWICK, A. (2006). Internet Politics: States, Citizens, and New Communication Technologies. Oxford: Oxford University Press.
COASE, Ronald. 1937. The Nature of the Firm. Economica 4 (16): 386–405.
DELLA PORTA, D. & VANUCCI, A. (2005). The Governance Mechanisms of Corrupt Transactions. In S. ROSE– ACKERMAN (Ed.). Institutional Economics of Corruption. New York: Routledge.
DOBSON, A. (2001). An Introduction to Generalized Linear Models. London: Chapman & Hall.
DEMÉTRIO, C. (2002). Modelos Lineares Generalizados em Experimentação Agronômica. ESALQ/USP – Piracicaba, SP
EIDE, E. (1994). Economics of Crime – Deterrence and the Rational Offender. Amsterdam, North. Holland.
GAMBETTA, D. (1998). Comment on Corruption and Development. In S. ROSE–ACKERMAN. Proceedings of the Annual World Bank Conference on Development. Economics, 1998, 58–61.
GONG, T.; Wu, A. (2012). Does Increased Civil Service Pay Deter Corruption? Evidence from China. Review of Public Personnel Administration. 32 (2). 192-204.
GONZALEZ, J. & POWER, T. (2003). Cultura Política, Capital Social e Percepções sobre Corrupção: Uma Investigação Quantitativa em Nível Mundial. Revista de Sociologia e Política. (21). 51-69.
GORTA, A. (2006). Corruption Risk Areas and Corruption Resistance. In C. SAMPFORD; A. SHACKLOCK; C. CONNORS; F. GALTUNG. Measuring Corruption (Law, Ethics and Governance). Burlington: Ashgate Publishing.
IBGE. (2011). Instituto Brasileiro de Geografia e Estatística. Cidades@. Retrieved December 10, 2011, from:
http://www.ibge.gov.br/cidadesat/topwindow.htm?1
IBGE. (2006). Pesquisa de Informações Básicas Municipais - 2006. Database. Rio de Janeiro: IBGE. Retrieved December 10, 2012, from: http://www.ibge.gov.br
JAIN, A. (2001). Corruption: a Review. Journal of Economics Surveys 15(1). 71-121.
JEONG, C. (2007). Fundamental of Development Administration. Selangor: Scholar Press.
KLITGAARD , R. (1994). A Corrupção sobre Controle. Rio de Janeiro: Zahar.
KRUEGER, A. (1974). The Political Economy of Rent-Seeking. American Economic Review 64. 291-303.
LENK, K. & TRAUNMÜLLER, R. (2001). Broadening the Concept of Electronic Government. In: J.E.J. Prins (ed.) Designing e-Government, Amsterdam, Kluwer.
LOPES. M. (2011). Corrupção: estudo sobre as formas de mensuração, seus determinantes e perspectivas sobre as formas de combate. Tese de Doutorado. São Paulo: FGV.
NORTH, D. (1990). Institutions, Institutional Change and Economic Performance. Cambridge: Cambridge University Press.
MACHO-STANDLER. I. & PÉREZ-CASTRILLO, D. (1997). An Introduction to the Economics of Information: Incentives and Contracts. Oxford: Oxford University Press.
PEREIRA, J. (2002). Reforma do Estado e Transparência: estratégias de controle da corrupção no Brasil. VII Congreso Internacional del CLAD sobre la Reforma del Estado y de la Administración Pública, Lisboa, Portugal, 8-11.
PIZZORNO, A. (1992). La corruzione nel sistema político. In D. Della Porta (Ed.), Scambio occult. Casi di corruzione politica in Italia, Bologna: Il Mulino.
PUTNAN, R. (1996). Comunidade e Democracia. A Experiência da Itália Moderna. Rio de Janeiro: FGV.
ROSE-ACKERMAN, S. (1999). Corruption and Government: Causes, Consequences, and Reform. London: Cambridge University Press.
SHIM, D. C. & EOM, T. H. (2009). Anticorruption effects of information and communication technology (ICT) and social capital. International Review of Administrative Science. 75. 99-116.
SHIM, D. C. & EOM, T. H. (2008). E-government and anti-corruption: Empirical analysis of international data. International Journal of Public Administration. 31. 298-316.
SIMON, H. (2000). Public Administration in today´s world of organization and markets. Political Science and Politics, 33 (4), 749-756.
SMITH, S. & LIPSKY, M. (1993). Non-profits for Hire: The Welfare State in the Age of Contracting. Cambridge, Mass: Harvard University Press.
SOOD, R. (2003). The Four Phases of E-Government in the Public Sector Market (Gartner Group Report, 2000). In Pavlichev, Alexei, and G. David Garson, Digital Government: Principles and Best Practices. Hershey, PA: IGI Global, p. 173.
TAKAHASHI, T. (2000). Sociedade da Informação no Brasil – Livro Verde. Retrieved December 10, 2012, from: http://www.mct.gov.br/index.php/content/view/18940.html.
TANZI, V. (1997). Corruption, governmental activities and markets. Trends in Organized Crime 2(4), 67-67.
TOLBERT, C.; MOSSBERGER, K. The Effects of E-Government on Trust and Confidence in Government. Public Administration Review. 66 (3), 354-369.
UNITED NATIONS. (2011). United Nations Department of Economic and Social Affairs. United Nations E-Government
Survey 2010. UN. Retrieved December 10, 2011, from:
http://www2.unpan.org/egovkb/documents/2010/E_Gov_2010_Complete.pdf
VAN RIJCKEGHEM, C. & WEDER, B. (1997). Corruption and the Rate of Temptation: Do Low Wages in the Civil Service Cause Corruption? IMF Working Paper, n. 97/73.
VIEIRA, J. (2012). Brazilian Municipal Corruption Data Bank. Núcleo de Estudos em Democracia, Ética e Governança Pública. NEOMINI/CEAM. University of Brasília.
_______________(2009). O Fundamento das Improbidades na Administração Pública Brasileira. IV Concurso de Monografias da Controladoria-Geral da União - Trabalhos Vencedores. Brasília: CGU.
WILHELM, A. (2000). Democracy in the digital age: challenges to political life in cyberspace. New York: Routledge.
WILLIAMSON, O. (1996). The Mechanisms of Governance. New York: Oxford University Press.
APPENDIX I
TABLE A. Normality test
Kolmogorov-Smirnova Shapiro-Wilk
Statistic GL. Sig. Statistic GL. Sig.
Corruption Index ,229 960 ,000 ,726 960 ,000
a. Lilliefors Significance Correction
Source: Brazilian Municipal Corruption Data Bank (Vieira, 2012)
TABLE B. Descriptive statistics by draw
Audi
t
N Mean
Std.
Deviation
Std.
Error
95% Confidence Interval
Minimum Maximum
Lower Bound
Corruption index
20 60 9,13 10,482 1,353 6,43 11,84 0 54
21 60 6,57 9,560 1,234 4,10 9,04 0 50
22 60 13,90 16,327 2,108 9,68 18,12 0 70
24 60 10,92 14,867 1,919 7,08 14,76 0 59
25 60 10,73 13,243 1,710 7,31 14,15 0 70
26 60 8,50 9,289 1,199 6,10 10,90 0 32
27 60 9,60 11,922 1,539 6,52 12,68 0 63
28 60 8,45 12,074 1,559 5,33 11,57 0 47
29 60 11,15 15,911 2,054 7,04 15,26 0 89
30 60 10,77 13,880 1,792 7,18 14,35 0 67
31 60 9,85 14,570 1,881 6,09 13,61 0 92
32 60 7,23 9,487 1,225 4,78 9,68 0 44
33 60 9,13 11,049 1,426 6,28 11,99 0 58
34 60 5,83 7,934 1,024 3,78 7,88 0 31
35 60 4,32 6,578 ,849 2,62 6,02 0 37
Total 960 9,17 12,364 ,399 8,39 9,95 0 92
TABLE C. ANOVA results by draw
Sum of Squares DF Mean Square F Sig.
Total 919562,563 959
Corruption index
Between groups 5001,683 15 333,446 2,223 ,005
Within groups 141610,300 944 150,011
Total 146611,983 959
Source: Brazilian Municipal Corruption Data Bank (Vieira, 2012)
TABLE D. Descriptive statistics by political-administrative region
Audit N Mean Std. Deviation Std. Error 95% Confidence Interval
Minimum Maximum
Lower Lower
Corruption index
North 111 9,28 9,681 ,919 7,46 11,10 0 53
Northest 384 15,31 15,258 ,779 13,78 16,84 0 92
Midwest 78 6,55 8,502 ,963 4,63 8,47 0 50
Southest 231 3,60 5,593 ,368 2,88 4,33 0 38
South 156 3,54 6,842 ,548 2,46 4,62 0 50
Total 960 9,17 12,364 ,399 8,39 9,95 0 92
TABLE E. ANOVA results by political-administrative region
Sum of Squares DF Mean Square F Sig.
Corruption index
Between groups 27122,095 4 6780,524 54,192 ,000
Within groups 119489,888 955 125,120
Total 146611,983 959
Source: Brazilian Municipal Corruption Data Bank (Vieira, 2012)
TABLE F. Descriptive statistic by municipality size.
Size N Mean Rank Sum Rank
Corruption index
Small 664 459,06 304815,50
Medium 296 528,60 156464,50
Total 960
Source: Brazilian Municipal Corruption Data Bank (2012)
TABLE G. Mann-Whitney Test (Monte Carlo) by municipality sizea
Corruption index
Mann-Whitney U 84035,500
Z -3,605
Asymp. Sig (2 tailed) ,000
Monte Carlo
(2 tailed)
Sig. ,001b
99% Confidence Interval
Lower Bound ,000
Upper Bound ,001
Monte Carlo
(1 tailed)
Sig ,000b
99% Confidence Interval
Lower Bound ,000
Upper Bound ,001
a. Grouping Variable: Size (small/medium)
b. Based on 10000 sampled tables with starting seed 118548781.
Source: Brazilian Municipal Corruption Data Bank (Vieira, 2012)
TABLE H. Statistics from Generalized Linear Models: E-gov
Parameter G
L
Estimative Std.
Error
Wald 95% Confidence
interval
Wald Chi-Square Pr > ChiQd
Intercept 1 -1.9300 0.1374 -2.1992 -1.6607 197.40 <.0001
Midwest 1 0.5407 0.1854 0.1773 0.9040 8.51 0.0035
North 1 0.7524 0.1608 0.4372 1.0676 21.89 <.0001
Southest 1 0.1341 0.1648 -0.1889 0.4571 0.66 0.4158
South 0 0.0000 0.0000 0.0000 0.0000 . .
Egov index Under construction 1 -0.0167 0.0928 -0.1986 0.1651 0.03 0.8569
Informative 1 -0.2559 0.0795 -0.4118 -0.1000 10.35 0.0013
Interactive 1 -0.2792 0.1282 -0.5304 -0.0279 4.74 0.0294
Transactional 1 -0.5595 0.2662 -1.0813 -0.0376 4.42 0.0356
Not available 0 0.0000 0.0000 0.0000 0.0000 . .
Size Medium 1 0.4109 0.0691 0.2755 0.5463 35.37 <.0001
Small 0 0.0000 0.0000 0.0000 0.0000 . .
Scale
Parameter
0 2.9935 0.0000 2.9935 2.9935
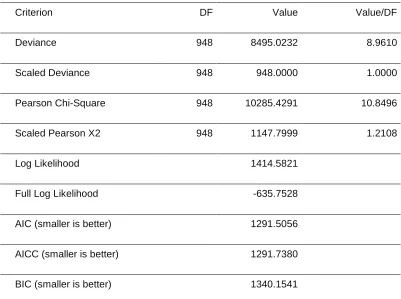
TABLE I. Criteria for assessing goodness of fit
Criterion DF Value Value/DF
Deviance 948 8495.0232 8.9610
Scaled Deviance 948 948.0000 1.0000
Pearson Chi-Square 948 10285.4291 10.8496
Scaled Pearson X2 948 1147.7999 1.2108
Log Likelihood 1414.5821
Full Log Likelihood -635.7528
AIC (smaller is better) 1291.5056
AICC (smaller is better) 1291.7380
BIC (smaller is better) 1340.1541
About the Author
James Batista Vieira
Professor of Public Management at the Federal University of Paraiba. Ph.D. in Political Science at State University of Rio de Janeiro. Researcher at the Center of Multidisciplinary Studies at University of Brasília.