Volume-7 Issue-1
International Journal of Intellectual Advancements
and Research in Engineering Computations
Effective ranking approach for E-data using extensible learning
Mr. C. Mani M.C.A., M.Phil., M.E
1, Mr.M.Mugilan
21
Assistant Professor,
2Final M.C.A Students
Department of Mechanical Engineeing, Nandha Engineering College, Erode - 52.
TamilNadu. India.
ABSTRACT
News media presents professionally verified occurrences or events, whereas social media presents the interests of the audience in these areas, and should therefore give insight into their quality. Social media services like Twitter can also provide additional or supporting information to a particular news media topic.
Meanwhile, truly valuable information may be thought of as the area in which these two media sources topically intersect with each other. Unfortunately, even after elimination of unimportant content, there is still information overload in remaining news-related data, which must be prioritized for utilization.
To assist in prioritization of news information, news must be ranked in order of estimated importance. At first, preprocessing is carried out. Key terms are extracted and filtered from news and social information admires a selected amount of your time. A graph is made (which is known as Key Term graph) from the antecedently extracted key term set, whose vertices represent the key terms and edges represent the co-occurrence similarity between them.
The graph, when process and pruning, contains slightly joint clusters of topics in style in each print media and social media. Then the graph is clustered so as to get well -defined and disjoint sub graphs. The sub graphs from the main graph are selected and ranked based on user attention. Thus the thesis effectively identifies news topics that are prevalent in both social media and the news media, and then ranks them. The Louvain algorithm is used for communication detection for social media. Finally, the results are validated by using the Validation metrics Modularity and Edge density. Clique method is provides the best result, to compare with Louvain algorithm.
Keywords:
Mobility, Load balancing, MCC, Cyber ForagingINTRODUCTION
Data mining or data discovery is that the computer-assisted method of dig through and analyzing huge sets of information and so extracting the means of the information. Data processing tools predict behaviors and future trends, allowing businesses to create proactive, knowledge-driven choices.
Data mining tools will answer business queries that historically were too time overwhelming to resolve. They scour databases for hidden patterns, finding prophetical data that consultants could
mistreatment data processing tools and techniques to require advantage of historical knowledge.
By mistreatment pattern recognition technologies, applied mathematics and mathematical techniques to shift through warehoused data, data processing helps to analyst acknowledge important facts, relationships, trends, patterns, exceptions and anomalies that may otherwise go unnoticed. For businesses, data processing is employed to find patterns and relationships within the knowledge so as to assist create higher business selections. Data processing will facilitate spot sales trends, develop smarter promoting campaigns, and accurately predict client loyalty.
Specific uses of information mining include
Market segmentation - determine the commoncharacteristics of shoppers UN agency purchase constant product from your company. Customer churn - Predict that customers square measure seemingly to depart your company and visit a contestant.
Fraud detection - determine that transactions square measure presumably to be dishonorable.
Direct promoting - determine that prospects ought to be enclosed during a list to get the very best response rate.
Interactive promoting - Predict what every individual accessing an internet website is presumably fascinated by seeing.
Market basket analysis - perceives what product or services square measure unremarkably purchased together; e.g., brew and diapers.
Data Mining is that the method of analyzing unknown patterns of knowledge in line with totally different views for categorization into helpful information, that is collected and assembled in widespread areas, like knowledge warehouses, for economic analysis, data processing algorithms, facilitating business deciding and different data necessities to ultimately cut prices and increase revenue.
RELATED WORKS
In the paper “Toward Collective Behavior Prediction via Social Dimension Extraction” [1] the authors Lei Tang and Huan Liu, Arizona State University within the year of 2010 were expressed that collective behavior refers to however people behave after they area unit exposed during a social network setting. Within the paper, they examined however they may predict on-line behaviors of users during a network, given the behavior data of some actors within the network.
They incontestable several benefits, particularly appropriate for large-scale networks, paving the manner for the study of collective behavior in several real-world applications. Social media like Facebook, Myspace, Twitter, Blog Catalog, Digg, YouTube and Flickr, facilitate folks of all walks of life to specific their thoughts, voice their opinions, and hook up with one another anytime and anyplace. for example, a well-liked content-sharing web site like Delicious, Flickr, and YouTube permits users to transfer, tag and comment differing types of contents (e.g., bookmarks, photos, videos).
One’s behavior is often influenced by the behavior of his/her friends. This naturally results in behavior correlation between connected users. Such collective behavior correlation can even be explained by homophily.
to divide into teams, with dense connections inside teams and solely sparser connections between them.
In social networks, as an example, it's long been accepted that people United Nations agency lie on the boundaries of communities, bridging gaps between otherwise unconnected folks, get pleasure from AN uncommon level of influence because the gatekeepers of data flow between teams.
In this paper “Yes, there's a Correlation - From Social Networks to private Behavior on the Web” the authors ParagSingla and Matthew Richardson expressed that characterizing the connection that exists between a person’s grouping and private behavior has been an extended standing goal of social network analysts. They applied data processing techniques to review this relationship for a population of over ten million folks, by turning to on-line sources of knowledge.
The analysis reveals that folks United Nations agency chat with one another (using instant messaging) area unit a lot of doubtless to share interests (their internet searches area unit a similar or locally similar). The longer they pay talking, the stronger their relationship. People who chat with alternative one another} are a lot of doubtless to share other personal characteristics, like their age and site and, they're doubtless to be of opposite gender. Similar findings hold for those that don't essentially talk over with one another however do have an admirer in common. Their analysis relies on a well-defined mathematical formulation of the matter, and is that the largest such study they were alert to.
In this paper “BIRDS OF A FEATHER: Homophily in Social Networks” the authors Miller revivalist, Lynn Smith-Lovin and James M Cook expressed concerning “Similarity breeds connection”. This principle the homophily principle-structures network ties of each kind, together with wedding, friendship, work, advice, support, data transfer, exchange, co-membership, and different varieties of relationship. The result's that people’s personal networks area unit unvaried with respect to several socio demographic, behavioral, and intrapersonal characteristics. Homophily limits people’s social world during a manner that has powerful implications for the data
they receive, the attitudes, and also the interactions they expertise.
Homophily in race and quality creates the strongest divides within the personal environments, with age, religion, education, occupation, and gender following in roughly that order. Geographic proximity, families, organizations, and isomorphs positions in social systems all produce contexts within which homophilous relations type. Ties between no similar people additionally dissolve at a better rate that sets the stage for the formation of niches (localized positions) inside social area.
They argued for a lot of analysis on: (a) the fundamental ecological processes that link organizations, associations, cultural communities, social movements, and plenty of different social forms. (b) The impact of multiplex ties on the patterns of homophily and (c) The dynamics of network amendment over time through that networks and different social entities co-evolve.
SYSTEM DESIGN
Introduction
Social media and traditional media combined together, they feed off of each other and are mutually beneficial. Together, they create a much stronger, much more effective and successful marketing campaign. The intersection of two media information is used to project the popularity of the news at a particular period of time. Thus the analysis provides a strong opinion about particular news for decision making in future. This chapter states the problem of the community detection in large graph and outlines the overall view of the existing work.
Existing Work
The concept of detecting the community from a large network in the existing work is given below
Girvan-Newman Clustering
nodes in network. For any node, vertex betweenness is defined as the number of shortest paths between pairs of nodes that run through it. If there is additional shortest path between a pair of nodes, each path is assigned equal weight such that the total weight of all of the paths is equal to unity. So the edges connecting communities will have high edge betweenness (at least one of them). By removing these edges, the groups are divided from one another and so the underlying community structure of the network is exposed.
The algorithm’s step for community detection
is summarized as follows
Step 1:Find the edge of highest betweenness - or multiple edges of highest betweenness g (v) =
g(v) (0,1) (1) Where,
isthe total no. of shortest paths starting from beginning node “s” to ending node “t” is number of the shortest path through V.
Step 2: The edge with highest betweennessvalue is removed.
Step 3: Recalculate all betweenness, and again remove the edge or edges of highest betweenness.
Step 4: Proceed in this way as long as edges remain in graph, in each step recalculating all betweenness and removing the edge or edges of highest betweenness.
The betweenness centrality should be recalculated with each step. The reason is that the network adapts itself to the new conditions set after the edge is removed. For example, if two communities are getting connected by more than one edge, then there is no guarantee that all of these edges will have high betweenness. By recalculating betweenness after the removal of each edge, it is ensured that at least one of the remaining edges between two communities will always have a high value.
Drawbacks of Girvan-Newman clustering
Girvan-Newman clustering is too slow for large networks
It yields relatively poor result for dense network
It takes more computation time to partition the large graph
The clustering approach is not employed in order to obtain overlapping topic clusters
PROBLEM DEFINITON
Twitter is an American online news and social networking service on which the users post and interact with messages known as “tweets”. Registered user can post tweets, talk about news and share interesting topics via social network services but those who are unregistered can only read them [2].
The news media (traditional media such as web news crawls, website news forums) contain the professionally verified events. The valuable information is obtained by intersecting two media sources. The community is detected to discover how particular topic is discussed by the user. It can be used to provide the strong opinion on the particular news present in the media. Detecting the communities from the large network is not an easy task.
In the existing system, the community is detected by using the Girvan-Newman clustering method, which detects the communities in smaller graphs. Based on the betweenness the cluster is identified. In order to accomplish the detection of communities from the large graph the proposed work is done. The proposed system utilizes two methods namely, CLIQUE (Cluster Inquest) detection and Louvain method to detect the communities effectively. In CLIQUE detection, it uses the multi-resolution grid data structure. The cluster contains the maximal set of actors in which every actor is connected to each other. It generates the minimal number of description for the clusters. The Louvain method is a greedy optimization method. It allows to efficiently compute the edge ranking in large network in linear time. Finally it discovers the community structure by optimizing the modularity of the network.
IMPLEMENTATION TOOL
R could be an artificial language and free code surroundings for applied mathematics computing and graphics supported by the R Foundation for applied mathematics Computing. The R language is wide used among statisticians and information miners for developing applied mathematics code and information analysis. R includes a command
interface; there are many graphical user interfaces, like RStudio, AN Integrated development surroundings. R is AN implementation of the S artificial language combined with lexical scoping linguistics, impressed by theme.Some of the R packages employed in current work area unit as follows
Table 3.1 R packages
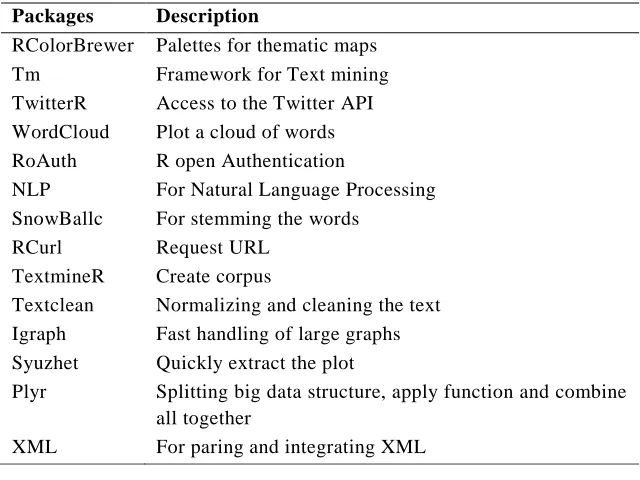
Packages Description
RColorBrewer Palettes for thematic maps Tm Framework for Text mining TwitterR Access to the Twitter API WordCloud Plot a cloud of words RoAuth R open Authentication
NLP For Natural Language Processing SnowBallc For stemming the words
RCurl Request URL TextmineR Create corpus
Textclean Normalizing and cleaning the text Igraph Fast handling of large graphs Syuzhet Quickly extract the plot
Plyr Splitting big data structure, apply function and combine all together
XML For paring and integrating XML
SUMMARY
This chapter describes about the problem definition and the overview of existing algorithm Girvan-Newman clustering. Consider the drawbacks of the existing work; the current work uses the CLIQUE detection and Louvain community detection model to get best community structure than the existing work, which is described in the next chapter 4, System Methodology.
SYSTEM METHODOLOY
Introduction
The keywords of the combined sources (Twitter and News media) help to find out the intersection of the words and co-occurrence words, which help to create the news term graph whereas the vertices are the text and the edges are the relationship, exist among vertices. So that the community detection
algorithm detects the dense region that are frequently crawled information in news and twitter. CLIQUE and Louvain method is used to detect the better communities than the existing method. This chapter describes the proposed algorithm in the current work.
System Architecture
The modules in the current work are as follows
Dataset collection
Preprocessing
Key term graph construction
Key term similarity estimation
Graph clustering : Girvan-Newman clustering
Content selection : User Attention (UA)
CLIQUE detection algorithm
Louvain algorithm
Dataset Collection
News Data
The BBC news website
(https://www.bbc.com/news) contains international news coverage, as well as British, entertainment, science, and political news. Many reports are convoyed by audio/video from BBC's television/radio news services. It is providing the interdisciplinary fields of news such as world, port, weather, travel, business, entertainment, health, science, technology and so on. For the current work the sports category news information from the date 1.11.2018 to 30.11.2018 are downloaded from the website.
Twitter Data
Twitter account[3] is used to create the Application Program Interface (API). The API provides the consumer secret key and access token secret key for authenticated retrieval of tweets. The number of tweets related to sports news is collected. The figure 4.1 shows the overall architecture of the current work. The modules in the work are explained below.
Preprocessing
The collected news articles and the tweets are preprocessed in this step.
Key Term Graph Construction
A graph G is generated, whereas the clustered nodes represent the prevalent news topic in both news and social media. The vertices in the graph G is the terms retrieved from N and T and the edges exhibit the relationship among the nodes. The following methods are used to find out the relationships between the words.
Term Document Frequency
The document frequency of each term in News and Twitter is calculated accordingly. Here df(n) is the occurrence of term n and df(t) is the occurrence of term t.
Relevant Key Term Identification
N represents the keywords present in the news article and T represent all relevant term present in the tweets. To extract the topics that are prevalent in both news and social media, the following formula is used.
I = N T (2) This intersection of N and T eliminates the terms from T that are not relevant to the news and terms from N that are not mentioned in the social media. I (intersection words) are ranked based on their prevalence in both sources. The prevalence of a term is the combination of it occurrence in both N and T.
(3)
Where,|T| is the total number of tweets chosen between dates d1 and d2.|N| is the total number of news chosen in the same period of time.
Key Term Similarity Estimation
The perception behind the co-occurrence is the terms that co-occur frequently are related to the same topic and may be used to summarize and represent it when grouped. The co-occurrence for each term pair (i,j) I found, defined as co(i,j). The term-pair co-occurrence is then used to estimate the similarity between terms. A number of similarity measure were tested, namely Jaccard, Dice and Cosine similarity.
The Dice similarity between term I and j is calculated as follows,
{
(4)
Where,
(i) is the number of tweet that contain term i
(j) is the number of tweet that contain term j
co(i,j) is the number of tweets in which terms i and j co-occur in
The Jaccard similarity between term I and j is calculated as follows,
{
(5)
The Cosine similarity between term I and j is calculated as follows,
{
√
(6)
All of the formerly described similarity measures generate a value between 0 and 1.
Graph Clustering: Girvan-Newman
This algorithm used to find out the word clusters. The goal is to identify and separate the well-defined sub graphs in the graph.
Betweenness
The core idea of Newman clustering is the concept of edge betweenness. The betweenness value of an edge is the number of shortest paths between pairs of nodes that run along it. The betweenness measure of an edge e is calculated a follows,
Betweenness (e) = (7)
Where,
V is the set of vertices
is the number of shortest path between vertex i and j
is the number of those paths that pass through edge e.
Transitivity
It is a property in a relation between three elements such that if the relation holds between the first and second elements, and between the second and third elements, then it also holds between the first and third elements. The transitivity of a graph G is defined as
Transitivity (g) = (8)
Algorithm Girvan - Newman
Improve the Cluster Quality of a Graph
Input: Graph G
Output: Cluster-quality-improved G
B = {} empty set repeat
for all (edge e G) do
Calculate betweenness(e) and append to B end for
if first iteration of loop then bavg = avg(B) end if
bmax = max(B)
trans0 = transitivity(G) previous transitivity Remove edge with bmax from G
trans1 = transitivity(G) posterior transitivity Clear set B
until (trans1 < trans0 or bmax<bavg) Add edge with bmax to G
Step 1:The betweenness values of all edges in graph G are calculated.
Step 2:The initial average betweenness of graph G is calculated.
Step 3: The high betweenness values are iteratively removed in order to separate clusters.
Step 4:The edge removing process is closed when removing additional edges yields no gain to the clustering quality of the graph. Once the process has been topped, the last detached edge is added back to G.
Content Selection : User Attention (UA)
The User Attention (UA) represents the number of unique Twitter user related to the selected tweets. The tweets related to that topic are selected and then the number of unique users who created those tweets are counted. The equation for finding the UA is given below.
(OR)
UA =
(10) Where,
is the number of unique users related to TC
G is the entire graph
This equation produces a value between 0 and 1.
Clique Detection Algorithm
The CLIQUE algorithm was one of the first subspace clustering algorithm. It identifies dense clusters in maximum dimensionality’s subspaces. The algorithm unites density and grid based clustering. It uses an APRIORI styles each technique to detect dense subspaces. Then the algorithm finds adjacent grid units in each of selected subspaces using “depth firsts each”. Clusters are then formed by uniting these units with the help of a greedy growth scheme. The algorithm begins with an arbitrary dense unit and then greedily produces a maximal region in each dimension until the union fall the regions covers the entire cluster. Redundant regions are removed by a repeated procedure.
The region growing, density based approach to generating clusters allows CLIQUE to find clusters of arbitrary shape, in any number of dimensions. Clusters are found in same, disjoint or overlapping subspaces. This is often advantageous in subspace clustering since the clusters often exist in different subspaces and thus represent different relationships.
CLIQUE, consists of the following steps
1. Identification of subspaces that contain clusters
2. Identification of clusters
3. Generation of minimal description for the clusters
Algorithm steps for CLIQUE
Identification of subspace that is dense
Finding of dense units
Find the set D1 of all one dimensional dense unit K=1
While =
K=k+1
Find the set which is set of all k-dimensional dense units whose all lower dimensionprojections (k-1), belong to
End while
Finding sub spaces of high coverage
Identification of clusters
For each high coverage subspace s do
Take the set of all dense units ( E in S) While E! =
M=1
Select a randomly chosen unit u from E Assign to , U and all units of E that are connected to U
E = E- End while End for
Generate minimal cluster descriptions
For each cluster C do Stage
C=0
While c! = X = X+1
Choose a dense unit in C For i = 1 to L
Unit proceeds in both the direction along the dimension.
End for
Represent the set containing the entire unit covered by the above procedure C = C-1
End while
Stage
Remove all covers from the units covered by another cover
Louvain Method
The method consists of two phases
1. It looks for "small" communities by optimizing modularity in a local way.
2. It aggregates nodes of the same community and builds a new network whose nodes are the communities. These steps are iteratively repeated until a maximum of modularity is attained.
The partition found after the first step typically includes many communities of small sizes. At succeeding steps, larger and larger communities are found due to the aggregation mechanism. This process will naturally lead to hierarchical decomposition of the network.This is clearly associate approximate technique and ensures that
the world most of modularity is earned, however many tests have confirmed that our algorithmic rule has a wonderful accuracy and sometimes provides a decomposition in communities that encompasses a modularity that's about to optimality.
are the sets of nodes and edges. Community detection is performed by dividing graph G into
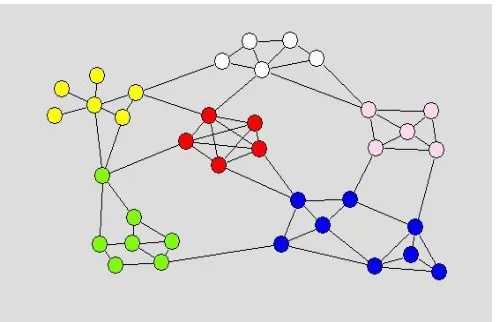
of nodes, is called community. The figure 4.2 shows the large network of nodes and edges which is clustered using Louvain algorithm; the communities are differentiated by using various color nodes.
Figure 4.2. Louvain community detection method
Louvain algorithm (Graph G) = G
C the index of community of each nodes of Initialize each node with its own community q = -
while q< Q( ,G) do q = Q (
c = MoveNodes ( // Phase 1 = Aggregate ( // Phase 2
C = put each node in its own community
End while Return End function
Function MoveNodes (Graph G)
C the index of communities of each nodes of G
While one or more nodes are moved do for random v do
best_q = -
best_c = community of v
for all neighboring nodes n of v do gain_q = between v and n ifbest_q<gain_q< then best_q = gain_q
best_c = community of n end if
end for
C = place v in the best_q end while
Function Aggregate (Graph G, Partition C)
= aggregate nodes which are in same community based on C
Return End function
This is an iterative algorithm repeating till there is no additional modularity improvement. It begins
with initialization ofall nodes with its own community. In Phase 1, for every node in a graph, it computes modularity gain ΔQ for all neighboring communities if the node found to be moving.
Q indicates gain of modularity and is defined by
[
[
] ]-[
[
] [ ] ](11)
where is the sum of the weights of the links inside the community to which the node i is assigned, is the sum of weights of the links incident to community nodes, and is the sum of the weights of the links from i to nodes in the community which is same with the community of node i.
In the Phase 2, all communities are collapsed to the vertices to create a new graph internal community edges are collapsed into a single self-looping edge, and the weight is the sum of edge weights of the entire internal community edges in the community. Multiple edges between every two communities are collapsed to form a single edge, and weight is the sum of edges between them.
SUMMARY
This chapter has described about the community detection using CLIQUE and Louvain method. CLIQUE detection model finds the communities of minimizing dimensionality. And the Louvain method finds the communities by maximizing the modularity. The current work determines that the CLIQUE clustering find out the best communities than the Louvain method. The results obtained by using CLIQUE and Louvain method are given in the next Chapter 5, Results and discussion.
RESULTS AND DISCUSSIONS
Experimental Analysis
The existing and proposed work detects the community structure from the news media and twitter media. The Process of existing and proposed work contains the following steps: Step 1: The input news data is first downloaded from the BBC news portals[4] and tweets are collected by using the Twitter API.
Step 2: The keywords of the news and twitter media is generated separately. The intersection of the two media keywords is found. The frequency of the words is calculated using TF-IDF.
Step 3:The relationship between the keywords can be found by using three similarity measures namely Dice, Jaccard and cosine similarity measures. So the vertices are the text words which are connected by the edges.
Step 4: The vertices and edges forms the clusters that are obtained by using the Girvan-Newman clustering method. And the User Attention (UA) of the resultant cluster is calculated.
Step 5:The resultant graph obtained in step 4 is fed into the CLIQUE community detection and Louvain method as input.
Step 6:At last the dense community graph is produced as output.
Step 7:Finally, the edge density and modularity is calculated to evaluate the quality of the community structure.
COMPARISON RESULT
obtained. The performance is evaluated by increasing the number of news, check whether the methods yield finest community even for large graphs. Among the three methods, the CLIQUE method yields better (strengthen) community structure with the high rate of evaluation metrics,
even the news and tweets are increased to some extent. The results for different number of input are explained in graphs.
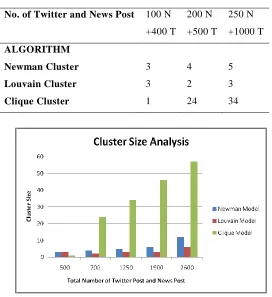
In the table 5.1, the number of clusters created according to the number of tweets and news are given below.
Table 5.1. The number of Clusters
No. of Twitter and News Post 100 N +400 T
200 N +500 T
250 N +1000 T
ALGORITHM
Newman Cluster 3 4 5
Louvain Cluster 3 2 3
Clique Cluster 1 24 34
Figure 5.1. Resultant Graph for Cluster size
CONCLUSION
Classification is applied to developed to automatically analyze the emotional polarity of a text, based on which a value for each piece of text is obtained. The absolute value of the text denotes influential power and the sign of text denotes its emotional polarity.
This Graph clustering is applied to develop integrated approach for online sports forums cluster analysis. Clustering algorithm is applied to classify the forums into various clusters, with the middle of each cluster representing a hotspot forum within current time span.
Along with clustering the forums based on data from current time window, conducted forecast is also conducted for the next time window. Empirical studies give strong proof of existence of correlations between post text sentiments and hotspot distributions.
Education Institutions being information seekers benefit from hotspot predicting approaches in various ways. They followed the same rules as academic objectives, and are measurable, quantifiable, and also time specific. However, in real, parents/students behavior is always hard to be capture explored.
their specific customer's timely concerns regarding goods and services information. Results generated from these approaches can be combined to
competitor analysis to defer comprehensive decision support information.
REFERENCES
[1]. L. Tang and H. Liu,“Toward predicting collective behavior via social dimension extraction,” IEEE Intelligent Systems, 25, 19–25, 2010.
[2]. M. Newman, “Finding community structure in networks using the eigenvectors of matrices” Physical Review (Statistical, Nonlinear and Soft Matter Physics), 74(3), 2006
[3]. P. Singla and M. Richardson, “Yes, there is a correlation: - from social networks to personal behavior on the web,” in WWW ’08: Proceeding of the 17th international conference on World Wide Web. New York, NY, USA: ACM, 2008, 655–664.
[4]. M. McPherson, L. Smith-Lovin, and J. M. Cook, “Birds of a feather: Homophily in social networks,” Annual Review of Sociology, 27, 415–444, 2001.
[5]. M. McPherson, L. Smith-Lovin, and J. M. Cook. Birds of a feather: Homophily in social networks. Annual Review of Sociology, 27, 2001, 415–444.
[6]. M. Granovetter, The strength of weak ties. Am. J. Sociol. 78, 1973, 1360–1380. [7]. R. S. Burt, Positions in networks. Social Forces 55, 1976, 93– 122.