www.atmos-meas-tech.net/4/2065/2011/ doi:10.5194/amt-4-2065-2011
© Author(s) 2011. CC Attribution 3.0 License.
Measurement
Techniques
Processing and validation of refractivity from GRAS radio
occultation data
K. B. Lauritsen1, S. Syndergaard1, H. Gleisner1, M. E. Gorbunov2, F. Rubek1, M. B. Sørensen1, and H. Wilhelmsen1 1Danish Meteorological Institute, 2100 Copenhagen, Denmark
2A. M. Obukhov Institute for Atmospheric Physics, Moscow, Russia
Received: 28 February 2011 – Published in Atmos. Meas. Tech. Discuss.: 13 April 2011 Revised: 22 September 2011 – Accepted: 23 September 2011 – Published: 4 October 2011
Abstract. We discuss the processing of GRAS radio oc-cultation (RO) data done at the GRAS Satellite Application Facility. The input data consists of operational near-real time bending angles from December 2010 from the Metop-A satellite operated by EUMETSMetop-AT. The data are processed by an Abel inversion algorithm in combination with statis-tical optimization based on a two-parameter fit to an MSIS climatology. We compare retrieved refractivity to analyses from ECMWF. It is found that for global averages, the mean differences to ECMWF analyses are smaller than 0.2 % be-low 30 km (except near the surface), with standard deviations around 0.5 % for altitudes between 8 and 25 km. The current processing is limited by several factors, which are discussed. In particular, the penetration depth for rising occultations is generally poor, which is related to the tracking of the L2 sig-nal. Extrapolation of the difference between the L1 and L2 signals below the altitude where L2 is lost is possible and would generally allow deeper penetration of retrieved refrac-tivity profiles into the lower troposphere.
1 Introduction
Radio occultation (RO) uses the radio signals continuously transmitted by the GPS satellites to measure the phase change as the radio signal path skirts the Earth’s atmosphere on its way from the transmitting GPS to a receiver on another orbiting satellite. The phase measurements can be processed into vertical profiles of atmospheric parameters, such as re-fractivity, temperature, pressure and humidity (Kursinski et al., 1997; Healy and Eyre, 2000). RO is an additional ap-plication of GPS signals and RO instruments are currently in orbit on both operational and research satellites. Using
Correspondence to: K. B. Lauritsen ([email protected])
satellite observations more effectively will improve weather forecasting as well as climate change monitoring. RO data are becoming increasingly important for these applications (Anthes, 2011).
The radio occultation method should be regarded as com-plementary to passive atmospheric sounders; it has a high vertical resolution in atmospheric regions and it operates on completely different measurement principles (Collard and Healy, 2003). The fact that RO measurements do not merely reproduce other measurements is clearly shown within the field of Numerical Weather Prediction (NWP), where assim-ilation of RO data has a substantial positive impact (Healy et al., 2005; Healy and Th´epaut, 2006; Cardinali, 2009). One of the key advantages of RO measurements is that they can be assimilated without bias correction. Therefore, they can po-tentially improve the assimilation of satellite radiance mea-surements by correcting model biases and providing “an-chor points” to prevent adaptive, variational bias correction schemes drifting towards the NWP model climatology (see e.g. Dee, 2008). Within the field of climate monitoring (and for detection of climate change) the possibilities to accurately observe climate trends and to make bias corrections from in-dependent measurements based on completely different mea-surement principles are very important, see e.g. Leroy et al. (2006).
2066 K. B. Lauritsen et al.: Refractivity from GRAS radio occultation data “raw sampling mode” (also called “open-loop”; at 1000 Hz)
(Bonnedal et al., 2010). The resulting data profiles extend from the lowest part of the atmosphere up to about 80 km.
Metop-A was launched in October 2006 and is part of the EUMETSAT Polar System (EPS). The EPS is designed for operational data provision, which means that observa-tions are rapidly made available to users. The near real time (NRT) timeliness requirement for level 1 data is availabil-ity to users within 2 h 15 min after sensing time. Each orbit of data (about 100 min) is down-linked over Svalbard, pro-cessed at EUMETSAT, and disseminated to users. Users in-clude e.g. NWP centers worldwide. The data are also pro-cessed further into so-called level 2 geophysical and level 3 climate products at the Satellite Application Facilities (SAF), which are specialized development and processing centers in member states of EUMETSAT. The NRT timeliness on op-erational SAF products is 3 h. For more information and a general introduction of EPS, see Klaes et al. (2007).
Processing of operational GRAS/Metop bending an-gle (BA) data from EUMETSAT is done within the GRAS SAF at the Danish Meteorological Institute (DMI), with partners: European Centre for Medium-range Weather Forecasts (ECMWF), Institute d’Estudis Espacials de Catalunya (IEEC, Spain), and Met Office (UK). The objec-tives of the GRAS SAF are to deliver operational RO prod-ucts from the GRAS instruments onboard the Metop satel-lites, and to supply the Radio Occultation Processing Pack-age (ROPP) containing modules for pre-processing and as-similation of the RO data into NWP models (Offiler et al., 2008). The near real-time GRAS SAF data products consist of profiles of refractivity, temperature, pressure, and humid-ity, whereas off-line and reprocessing products also include bending angles and gridded climate data (Lauritsen et al., 2008). The GRAS SAF receives NRT level 1 bending angle data processed by EUMETSAT Central Applications Facility (CAF). These data are further processed to vertical profiles of refractivity (level 2) using state-of-the art inversion algo-rithms. The products are formatted as BUFR files and dis-seminated over the Global Telecommunication System net-work to NWP users worldwide within 1:41 h (average value), 1:48 h (90 % of the profiles), and close to 100 % of the pro-files within the NRT timeliness of 3 h from observation time (see, e.g. the GRAS SAF website: http://www.grassaf.org).
In the present paper we focus on the validation of refractiv-ity profiles derived from operational NRT bending angle data from GRAS/Metop. The remaining parts of the paper are or-ganized as follows: in Sect. 2 we give a brief description of the data used in this study. In Sect. 3 we give a short overview of the processing and the GRAS RO data. Section 4 presents the analyses of GRAS refractivity data. Section 5 contains discussions and conclusions.
6 K. B. Lauritsen et al.: Refractivity from GRAS radio occultation data
Fig. 1. Geographical distribution of occultations observed by the GRAS instrument onboard Metop-A during the first 10 days of De-cember 2010.
Fig. 1. Geographical distribution of occultations observed by the
GRAS instrument onboard Metop-A during the first 10 days of De-cember 2010.
2 Description of GRAS data
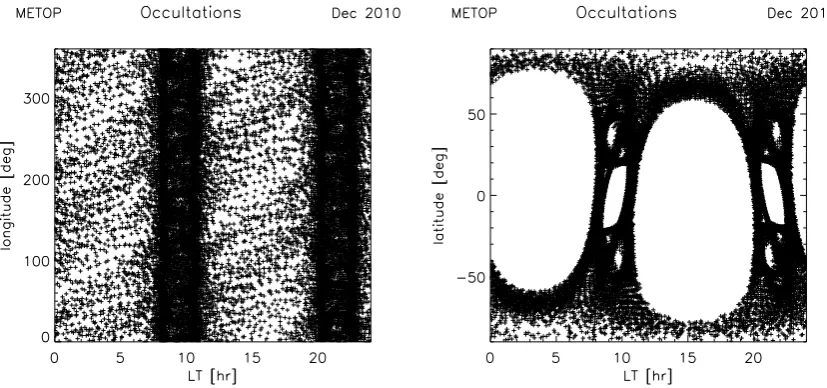
The present study is based on the occultations observed by the GRAS instrument during the first 10 days of Decem-ber 2010. The about 6000 occultations observed during this time period have a global distribution typical for observa-tions made from a satellite in a Sun-synchronous, low-Earth orbit: approximately uniform in longitude but with a higher density (per area unit) toward the poles, and with a charac-teristic local-time structure. Figure 1 shows the geographical distribution of occultation events.
K. B. Lauritsen et al.: Refractivity from GRAS radio occultation data 2067
Fig. 2. Latitude, longitude, and local time (LT) distribution of oc-cultations observed by the GRAS instrument onboard Metop-A dur-ing December 2010.
Fig. 2. Latitude, longitude, and local time (LT) distribution of occultations observed by the GRAS instrument onboard Metop-A during
December 2010.
3 Processing of GRAS data
The processing to refractivity is based on operational bending angles processed by EUMETSAT CAF using the GRAS Processing Product Facility (PPF) version 2.16 from 1 July 2010. The bending angles consist of L1 and L2 re-trieved from the observed L1 and L2 excess phases and a linear combination (LC) of L1 and L2 in order to reduce the influence of the ionosphere. The bending angles are based on geometric optics and accordingly the BA data below 10 km are not optimal for NWP and refractivity calculations (von Engeln et al., 2009). The operational input data may also contain gaps and missing values for bending angles and lat-itudes and longlat-itudes. We do not process over data gaps but cut off the BA data at the first instance of a missing value for either the bending angle or the latitude and longitude coor-dinates. If there are more than one block of data we use the longest block.
For the processing to the refractivity in the upper strato-sphere and mesostrato-sphere, the GRAS SAF operational system includes an approach referred to as optimal linear combina-tion (OLC) of bending angles (Gorbunov, 2002). This ap-proach gives the statistically optimized neutral atmosphere bending angle calculated from the observed L1 and L2 bend-ing angles as well as a background profile based on a spectral representation of the MSIS90 climatological model (Hedin, 1991) transformed to bending angle space. Thus, it combines ionospheric correction and statistical optimization (SO) in a single least squares framework. The OLC method is an op-timal filter based on the estimate of the variances and co-variances of L1 and L2 signals and noises neglecting cross-correlations between different impact parameters (Gorbunov, 2002). The background profile used in the SO for a given
occultation is found through a global search in a small li-brary of MSIS bending angles. By using a global search it is possible to find a background profile that fits the observations better than the local MSIS profile, while still being realistic in a climatological sense. In the searching process the MSIS bending angles are scaled and shifted (in bending angle log-space) in a least squares fit to the observed (non-optimized) LC bending angle between 40 and 60 km. However, the fit is not performed at altitudes where the MSIS bending angle de-viates more than 30 % from the observed LC bending angle. More than 30 % deviation can be explained by ionospheric residual noise in the LC bending angle and stronger noise in the L2 channel. Currently about 6 % of all profiles are dis-carded because of such variations. The chosen background profile is the one where the scaling and shifting is the small-est in the sense described in more detail below. This way of choosing the background profile differs from the approach by Lohmann (2005) as well as that of Gobiet and Kirchen-gast (2004) who suggested to choose the model profile with the best least squares fit. In order to eliminate impact pa-rameter ambiguities, a method consisting of finding the near-est monotonic impact parameter sequence with respect to the L2-norm is employed.
The main steps in the processing from GRAS bending an-gle to refractivity are summarized below:
1. Elimination of impact parameter ambiguities.
2. Linear interpolation to a fixed impact parameter grid with steps of about 100 m.
3. Smoothing of bending angles using a sliding cubic poly-nomial fit with a window of about 1 km.
2068 K. B. Lauritsen et al.: Refractivity from GRAS radio occultation data – Searching through a bending angle model (for
ev-ery month, evev-ery 10◦latitude, and every 20◦
longi-tude) based on the MSIS90 climatological model. – For each model bending angle, model, in this
search, calculation of two parameters (an offset, lnα, and a multiplication factor,β, in bending an-gle log-space) by linear regression to the data in the height interval 40–60 km (i.e. such that the quantity P
(lnα+βlnmodel−lnLC)2is minimized, where the summation is performed over the regression height interval.
– Identification of the model bending angle for which (lnα,β−1) has the smallest L2-norm.
5. Optimal Linear Combination:
– Calculation of strongly smoothed ionospheric sig-nal (L1–L2).
– Estimation of ionospheric signal and noise vari-ance using the highest part (above 50 km) of the occultation. There is an upper height limit that ex-cludes strong variations from the signal-band noise estimates. The limit is estimated dynamically and never exceeds 80 km.
– Calculation of relative mean deviation of neutral bending angle from the scaled and offset model bending angle using the data at heights 12–35 km (giving an estimate of the model variance). – Solving a set of linear equations taking into account
the estimated variances.
6. Inversion to refractivity via the Abel transform using piece-wise analytical integration and asymptotic correc-tion (i.e. assuming exponential decrease of the bending angle profile above∼100 km).
The refractivity profiles are quality-controlled and flagged as “bad” (and does not appear in the validation results shown in Sect. 4) if one of the following is true: (i) refractivity pro-file does not reach below 20 km (4–5 % of propro-files); (ii) one or more points in the refractivity profile below 35 km differ by more than 10 % from the corresponding profile obtained from ECMWF fields (1–1.5 % of profiles); (iii) refractivity profile reaches below the ECMWF model surface (0.8–1.0 % of profiles); (iv) refractivity is negative (0.05–0.1 % of pro-files). These criteria flag about 7 % of all profiles (percent-ages for each criteria are shown in parentheses).
4 Results
In this section, the retrieved refractivity profiles are com-pared to the corresponding ECMWF profiles obtained by for-ward modelling analysis fields (analyses are available every six hour at 00:00, 06:00, 12:00, and 18:00 UTC; we use the
analysis closest to the observation time) of temperature, pres-sure and humidity to refractivity as a function of altitude at the location of the occultations. The location is provided with the bending angle data, and is for each occultation given by the latitude and longitude of the point on the straight line between the occulting GPS satellite and the Metop satellite that grazes the Earth’s surface. This corresponds to a tangent point altitude between 10 and 15 km (Foelsche et al., 2011). Statistics are separated into high latitudes (above 60◦N and below 60◦S), mid latitudes (30–60◦S and 30–60◦N), and low latitudes (between 30◦S and 30◦N).
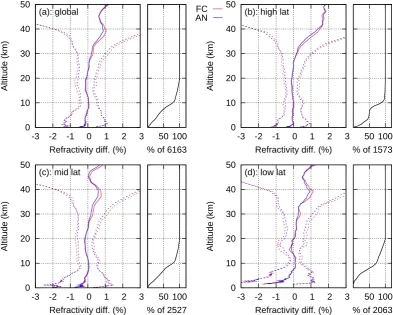
Figure 3 shows the results for the first 10 days of Decem-ber 2010 (cf. Fig. 1). Globally (Fig. 3a), the mean difference to the model profiles are within 0.2 % in most of the inter-val below 30 km (except near the surface). Above 30 km, there is an increasing positive bias relative to the model pro-files, which mainly is believed to be due to a bias in the ECMWF model around 40 km (S. Healy, personal commu-nication, 2009). For reference the figure also contains the statistical comparison to ECMWF short-range forecasts. It is observed that this yields slightly larger standard deviations above about 10 km and a slightly larger bias at about 30– 40 km. Although the approach implemented for statistical optimization at the GRAS SAF seeks to avoid introducing biases (by finding a climatological profile fitting the data be-tween 40 and 60 km), a bias may nevertheless be introduced at this level of processing, possibly because of limitations in the approach and limitations in the MSIS90 climatology. Below about 8 km, data are affected by atmospheric multi-path, which results in a bias in retrieved refractivity because the operational GRAS data are processed using geometri-cal optics. The standard deviation is about 0.5 % between 8 and 25 km. The standard deviation increases significantly above 30 km mainly because of the exponential decrease of refractivity with altitude. The statistics at high (Fig. 3b), mid (Fig. 3c), and low (Fig. 3d) latitudes are somewhat similar to the global statistics, though with a significantly increasing bias in the lower troposphere as one goes towards lower lati-tudes. This again is due to increased multi-path in the moister tropical and extra-tropical regions, in combination with the geometrical optics processing. At low latitudes (Fig. 3d), the standard deviation is a minimum (about 0.25 %) in the upper troposphere and increases to a local maximum (about 0.7 %) near the tropopause.
K. B. Lauritsen et al.: Refractivity from GRAS radio occultation data 2069
0 10 20 30 40 50
-3 -2 -1 0 1 2 3
Altitude (km)
Refractivity diff. (%)
(a): global FC
AN
50 100 % of 6163
0 10 20 30 40 50
-3 -2 -1 0 1 2 3
Altitude (km)
Refractivity diff. (%) (b): high lat
50 100 % of 1573
0 10 20 30 40 50
-3 -2 -1 0 1 2 3
Altitude (km)
Refractivity diff. (%) (c): mid lat
50 100 % of 2527
0 10 20 30 40 50
-3 -2 -1 0 1 2 3
Altitude (km)
Refractivity diff. (%) (d): low lat
50 100 % of 2063
Fig. 3. Statistical comparisons to ECMWF analyses (blue) and short-range forecasts (red) of refractivity derived from GRAS oc-cultations for the first 10 days of December 2010. (a): Global, (b): high latitudes (above 60◦),(c): mid latitudes (between 30◦and 60◦),(d): low latitudes (below 30◦). The mean difference (solid) and standard deviation around the mean (dashed) are indicated in the panels to the left, whereas the number of profiles included in the statistics is indicated in the panels to the right.
Fig. 3. Statistical comparisons to ECMWF analyses (blue) and short-range forecasts (red) of refractivity derived from GRAS occultations
for the first 10 days of December 2010. (a) Global, (b) high latitudes (above 60◦), (c) mid latitudes (between 30◦and 60◦), (d) low latitudes (below 30◦). The mean difference (solid) and standard deviation around the mean (dashed) are indicated in the panels to the left, whereas the number of profiles included in the statistics is indicated in the panels to the right.
0 5 10 15 20
-80 -60 -40 -20 0 20 40 60 80
Altitude (km)
Latitude (deg)
(a)
0 5 10 15 20
-80 -60 -40 -20 0 20 40 60 80
Altitude (km)
Latitude (deg)
(b)
0 5 10 15 20
-80 -60 -40 -20 0 20 40 60 80
Altitude (km)
Latitude (deg)
(c)
0 5 10 15 20
-80 -60 -40 -20 0 20 40 60 80
Altitude (km)
Latitude (deg)
(d)
Fig. 4. Penetration depth of GRAS occultations for the first 10 days of December 2010, as a function of latitude. (a) Rising occultations
2070 K. B. Lauritsen et al.: Refractivity from GRAS radio occultation data is to extrapolate the difference between the L1 and the L2
bending angle to lower altitudes (Kuo et al., 2004), and it is anticipated that the processing of bending angle at EUMET-SAT CAF will include such extrapolation in the near future (A. von Engeln, personal communication, 2010). This al-lows the generation of an extrapolated L2 signal, and thus, the ionospheric correction can be performed down to alti-tudes where the L1 CA signal is tracked in phase-locked loop mode. Figure 4 shows the penetration depth (the alti-tude of the lowest point in the profiles) for rising (left) and setting (right) occultations separately, and without the “L2 extrapolation” (top) and including “L2 extrapolation” (bot-tom). Thus, including the “L2 extrapolation”, most profiles will reach the lower troposphere. The improvement in pene-tration depth is most noticeable for rising occultations, but also setting occultations will benefit from the “L2 extrap-olation”. The evaluation of the quality of the extrapolated profiles is currently ongoing in collaboration with EUMET-SAT CAF.
5 Conclusions
In this paper we have discussed operational bending angle data from December 2010 from the operational GRAS/Metop satellite, and shown statistical comparisons between retrieved refractivity generated at the GRAS SAF and ECMWF analyses. For global averages, the mean dif-ferences to ECMWF analyses are smaller than 0.2 % below 30 km, with standard deviations around 0.5 % for altitudes between 8 and 25 km. The penetration depth for rising oc-cultations is generally poor, which is related to the tracking of the L2 signal. An extrapolation of the L2 bending angle to lower altitudes, currently under evaluation by the EUMET-SAT CAF and the GRAS SAF, is anticipated to improve the penetration in the near future.
Current RO bending angle GRAS data are obtained from closed loop sampling and derived from geometrics optics in-version (von Engeln et al., 2009). Therefore the data only have limited information about the atmosphere below about 8 km. Future GRAS data will be based on wave optics in-version and include both closed loop and open loop (raw sampling) data. This will significantly improve the profile penetration statistics especially in tropical regions (see, e.g. Gorbunov et al., 2011).
Acknowledgements. GRAS bending angle data are provided by
EUMETSAT and ECMWF forecasts and analyses are provided by the European Centre for Medium-range Weather Forecasts. We acknowledge discussions with S. Healy, C. Marquardt, M. Rennie, and A. von Engeln. M. E. G. is supported by the Russian Founda-tion for Basic Research (grant No. 09-05-00180-a). The work has been supported by the GRAS Satellite Application Facility which is an operational RO processing center under EUMETSAT.
Edited by: A. K. Steiner
References
Anthes, R. A.: Exploring Earth’s atmosphere with radio occulta-tion: contributions to weather, climate and space weather, At-mos. Meas. Tech., 4, 1077–1103, doi:10.5194/amt-4-1077-2011, 2011.
Bonnedal, M., Christensen, J., Carlstr¨om, A., and Berg, A.: Metop-GRAS in-Orbit Instrument Performance, GPS Solutions, 14, 109–120, doi:10.1007/s10291-009-0142-3, 2010.
Cardinali, C.: Forecast sensitivity to observation (FSO) as a diag-nostic tool, ECMWF Technical Memoranda 599, October, 2009. Collard, A. D. and Healy, S. B.: The combined impact of fu-ture space-based atmospheric sounding instruments on numerical weather-prediction analysis fields: A simulation study, Q. J. Roy. Meteorol. Soc., 129(593), 2741, doi:10.1256/qj.02.124, 2003. Dee, D.: Reanalysis applications of GPS radio occultation
mea-surements, in: Proceedings of the GRAS SAF Workshop on Applications of GPS Radio Occultation Measurement, ECMWF, 16–18 June 2008, available at: http://www.grassaf.org/AGROM proceedings.php (last access: April 2011), 2008.
Foelsche, U., Syndergaard, S., Fritzer, J., and Kirchengast, G.: Er-rors in GNSS radio occultation data: relevance of the measure-ment geometry and obliquity of profiles, Atmos. Meas. Tech., 4, 189–199, doi:10.5194/amt-4-189-2011, 2011.
Gobiet, A. and Kirchengast, G.: Advancements of Global Navi-gation Satellite System radio occultation retrieval in the upper stratosphere for optimal climate monitoring utility, J. Geophys. Res., 109, D24110, doi:10.1029/2004JD005117, 2004.
Gorbunov, M. E.: Ionospheric correction and statistical opti-mization of radio occultation data, Radio Sci., 37, 1084, doi:10.1029/2000RS002370, 2002.
Gorbunov, M. E., Lauritsen, K. B., Benzon, H.-H., Larsen, G. B., Syndergaard, S., and Sørensen, M. B.: Processing of GRAS/METOP radio occultation data recorded in closed-loop and raw-sampling modes, Atmos. Meas. Tech., 4, 1021–1026, doi:10.5194/amt-4-1021-2011, 2011.
Healy, S. and Eyre, J.: Retrieving temperature, water vapour and surface pressure information from refractive-index profiles de-rived by radio occultation data: A simulation study, Q. J. Roy. Meteorol. Soc., 126, 1661–1683, 2000.
Healy, S. and Th´epaut, J.-N.: Assimilation experiments with CHAMP GPS radio occultation measurements, Q. J. Roy. Me-teorol. Soc., 132(615), 605–623, 2006.
Healy, S., Jupp, A., and Marquardt, C.: Forecast impact experiment with GPS radio occultation measurements, Geophys. Res. Lett., 32, L03804, doi:10.1029/2004GL020806, 2005.
Hedin, A. E.: Extension of the MSIS thermosphere model into the middle and lower atmosphere, J. Geophys. Res., 96, 1159–1172, 1991.
Klaes, K. D., Cohen, M., Buhler, Y., Schl¨ussel, P., Munro, R., Lun-tama, J.-P., von Engeln, A., O’Clerigh, E., Bonekamp, H., Ack-ermann, J., and Schmetz, J.: An introduction to the EUMET-SAT polar system, B. Am. Meteorol. Soc., 88(7), 1085–1096, doi:10.1175/BAMS-88-7-1085, 2007.
Kuo, Y.-H., Wee, T.-K., Sokolovskiy, S., Rocken, C., Schreiner, W., Hunt, D., and Anthes, R. A.: Inversion and error estimation of GPS radio occultation data, J. Meteorol. Soc. Jpn., 82, 507–531, 2004.
occulta-tion measurements using the Global Posiocculta-tioning System, J. Geo-phys. Res., 102, 23429–23465, 1997.
Lauritsen, K. B., Gleisner, H., Gorbunov, M. E., Rubek, F., Syn-dergaard, S., and Sørensen, M. B.: GRAS SAF project and products, in: Proceedings of the GRAS SAF Workshop on Ap-plications of GPS Radio Occultation Measurement, ECMWF, 16–18 June 2008, available at: http://www.grassaf.org/AGROM proceedings.php (last access: April 2011), 11–21, 2008. Leroy, S. S., Anderson, J. G., and Dykema, J. A.: Testing climate
models using GPS radio occultation: a sensitivity analysis, J. Geophys. Res., 111, D17105, doi:10.1029/2005JD006145, 2006. Lohmann, M. S.: Application of dynamical error estimation for sta-tistical optimization of radio occultation bending angles, Radio Sci., 40, RS3011, doi:10.1029/2004RS003117, 2005.
Luntama, J.-P., Kirchengast, G., Borsche, M., Foelsche, U., Steiner, A., Healy, S., von Engeln, A., O’Clerigh, E., and Marquardt, C.: Prospects of the EPS GRAS mission for operational atmo-spheric applications, B. Am. Meteorol. Soc., 89, 1863–1875, doi:10.1175/2008BAMS2399.1, 2008.
Offiler, D.: GRAS SAF Radio Occultation Processing Package: Overview, Ref: SAF/GRAS/METO/UG/ROPP/001, available at: http://www.grassaf.org (last access: April 2011), 2010.
Pirscher, B., Foelsche, U., Lackner, B. C., and Kirchengast, G.: Lo-cal time influence in single-satellite radio occultation climatolo-gies from sun-synchronous and non sun-synchronous satellites, J. Geophys. Res., 112, D11119, doi:10.1029/2006JD007934, 2007.