Baghdad Science Journal
Vol.13(4)2016
DOI:http://dx.doi.org/10.21123/bsj.2016.13.4.0770
Transition Metal Complexes with Tridentate Ligand:
Preparation, Spectroscopic Characterization, Thermal
Analysis and Structural Studies
Abbas Ali Salih Al-Hamdani
Rehab Ghalib Hamoodah
Department of Chemistry, College of Science for Woman, University of Baghdad, Baghdad, Iraq
E-mail:[email protected]
Received 25/ 5/2015 Accepted 4/ 10/2015
This work is licensed under a Creative Commons Attribution-NonCommercial-NoDerivatives 4.0 International Licens
Abstract
New series of metal ions complexes have been prepared from the new ligand 1,5- Dimethyl-4- (5-oxohexan-2- ylideneamino) -2-phenyl- 1H-pyrazol-3 (2H)-one derived from 2,5-hexandione and 4-aminophenazone. Then, its V(IV), Ni(II), Cu(II), Pd(II), Re(V) and Pt(IV) complexes prepared. The compounds have been characterized by FT-IR, UV-Vis, mass and 1H and 13C-NMR spectra, TGA curve, magnetic moment, elemental microanalyses (C.H.N.O.), chloride containing, Atomic absorption and molar conductance. Hyper Chem-8 program has been used to predict structural geometries of compounds in gas phase, the heat of formation, (binding, total and electronic energy) and dipole moment at 298 K.
Key words: Schiff base Ligands, 2,5-Hexandione, Metal Complexes.
Introduction:
Schiff base derivatives attract a significant interest and occupy an important role in the development of coordination chemistry [1]. Moreover,
Schiff base complexes containing
transition metals have been studied in several research areas such as structural chemistry [2]. Metal complex with Schiff bases are important class of ligands due to their synthetic flexibility, selectivity and sensitivity towards the
central metal atom, structural
similarities with natural biological substances, and also, due to presence of azomethine group which imports in
elucidating the mechanism of
transformation and racemisation
reaction in biological system [3-4] also have been studied for their application
in clinical, analytical and
pharmacological areas [5]. In report herein the synthesis and spectroscopic
studies as well as the thermal
Materials and Methods:
The following chemicals were commercially available products of analytical reagent grade. 2,5-hexane dione, 4-amiophenazone, DMSO, pure ethanol, methanol, CaCl2, VOSO4XH2O
NiCl2.6H2O, PdCl2, CuCl2 ReCl5 and
H2PtCl6.6H2O were obtained from
Fluka, Aldrich.
(FT-IR) the spectra were
recorded in the range (4000-400) cm-1 on a Shimadzu 3800, spectrometer. Electronic absorption spectra were recorded in the range (200-1100) nm on a Shimadzu 160 Spectrophotometer.
Thermal analysis studies of the
compounds were performed on Perkin-Elmer Pyris Diamond DTA/TG Thermal system under nitrogen atmosphere at a heating rate of 10°C/min. 1H- 13CNMR spectra were recorded using Bruker 400
MHz spectrometer and elemental
(C.H.N.O) analyses were carried out on a Perkin-Elmer automatic equipment model 240.B. Mass spectra were obtained by LC-Mass 100P Shimadzu. Melting points were obtained on a Buchi
SMP-20 capillary melting point
apparatus and are uncorrected. Metals were identified using a Shimadzu (A.A) 680 G atomic absorption Spectrometer. Conductivity measurements were made with DMSO solutions using a Jenway 4071 digital conductivity meter at room temperature, chlorine content. Magnetic
properties were measured using
(Balance magnetic susceptibility model MSR-MKi).
Synthesis of Ligand: 1, 5-Dimethyl-4- (5-oxohexan-2-ylideneamino)-2-phenyl-1H-pyrazol-3 (2H)-one
A solution of 4-aminophenazone (1 g. 4.92 mmol) in absolute ethanol (25 ml) was mixed with a solution of 2,5 hexandione (0.56g, 4.92mmol). The reaction was stirred and heated in water bath (40-50)°C for four hrs. A colorless precipitated washed with diethyl ether .Recrystallization has been carried out in ethanol: water (1:1). The product was dried via anhydrous CaCl2 in vacuum as
shown in Scheme (1). The yield is (1.38g),
93.66%, mp.179°C.
N N H3C
H3C O
NH2 CH3
C
CH2
H2C
C
H3C
O O
N N H3C
H3C O
N
CH3
C
H2C CH
2
C CH
3
O
1 mol
1 mol
1,5-Dimethyl-4-(5-oxohexan-2-ylideneamino) -2-phenyl-1H-pyrazol-3(2H)-one 4-Amino-1,5-dimethyl-2-phenyl
-1H-pyrazol-3(2H)-one
Hexane-2,5-dione
H2O EtOH / Refluxe
Scheme 1: Preparation of the Ligand
Synthesis of Complexes
A solution of the ligand (0.5 mmol) in methanol (15 ml), and methanol solution (10 ml) of the metal salt (0.5 mmol) (NiCl2.6H2O, CuCl2,
ReCl5, H2PtCl6.6H2O, PdCl2 and
VOSO4.H2O) was then added drop wise.
The resulting mixture was refluxed 3-4 hrs, the solid mass which was washed
several times with hot ethanol and dried under vacuum. Physical properties for the compounds are given in Table (1).
Programs used in Theoretical Calculation
that are known for its quality, flexibility and ease of use, uniting 2D visualization and animation with quantum chemical calculations, molecular mechanics and dynamic. (PM3) and (AMBER) are more popular than other semi-empirical methods due to the availability of algorithms and more accurate than with other methods. It has parameterized primarily for organic molecules and selected transition metals [6, 7].
Results and Discussion:
The UV spectrum for free ligand one peak in (282 nm) attributed to (π→π*
), shown the Figure (1). The LC-Mass for ligand (299.3m/z) with (C17H21N3O2), (244.2 m/z) with
(C14H18N3O), (243.3 m/z) with
(C14H17N3O) and (144.2 m/z) with
(C6H14N3O). 1H-NMR (DMSO-d6,
ppm): δ 2.044 (s‚3H, N=C-CH3), 2.147
(s‚3H, O=C-CH3), 3.11 (s, 3H,
C=C-CH3), 3.31 (s‚3H, N-CH3), 5.88 (tri, 4H,
CH2-CH2), 7.282-7.513 (m, 5H, Ar-H)
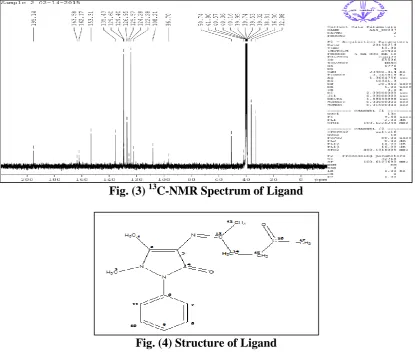
shown the Figure (2). 13C-NMR
(100.622 MHz, DMSO-d6): δ 162.22
(C16), 153.25 (C12), 134.67 (C4), 129
(C2, 6), 127 (C8, 10), 124.31 (C9), 109.83
(C11), 105.95(C7), 77.25(C5,15), 76.93
(C3), 50.41(C17), 36.09 (C4), 12.5 (C13),
10.62 (C1), shown the Figure (3,4).
Molar conductance values were found in the range (3 - 19) S. cm2 mol
-1
for V(IV), Ni(II) and Cu(II) complexes which indicates that they are non-electrolytes, the range (44-45) S. cm2. mol-1for Pd(II) and Pt(IV) complexes which indicates that they are electrolytes (1:1) and (70) S. cm2. mol-1 for Re(V) complex which indicate that the is electrolyte [1:2] [8-9]. These were determined in (DMSO) solution (10
-3
M). Physical properties and elemental microanalysis are listed in Table (1).
Fig. (1) UV-Vis Spectrum of Ligand
Fig. (3) 13C-NMR Spectrum of Ligand
Fig. (4) Structure of Ligand
Table (1) Microanalysis results and some physical properties of the Ligand and its complexes
Elemental Analysis % Calc Molar
conductance S. cm2. mol-1 Color
m. p °C M. wt.
Yield% Sample
Formula Experimental
Cl M O N H C 10.69 14.04 7.07 68.20 - Colorless 179 299.37 89 L
C17H21N3O2 67.76 6.83 15.56 11.12
11.02 24.22 9.09 4.58 44.16 3 Brown reddish 138-139 462.37 86 VL
C17H21N3O7VS
12.76 25.07 9.09 5.74 45.48 16.51 14.12 11.42 11.0 4.36 45.36 15.86 13.13 10.74 9.40 5.19 45.68 13 Brown reddish 285-286 446.98 92 NiL
C17H23N3O3NiCl2 44.87 6.66 11.09 11.25 14.13 15.55
15.69 14.06 10.62 9.30 5.13 45.19 19 Green 230-232 451.83 93 CuL
C17H23N3O3CuCl2 46.09 6.87 10.09 11.23 15.35 14.43
14.87 22.32 6.71 8.81 4.44 42.83 44 Dark brown 244-245 476.69 77 PdL
C17H21N3O2PdCl2 40.97 5.31 10.02 7.76 22.34 14.66
26.74 4.83 6.34 3.19 30.80 70 Dark brown 267- 268 662.84 71 ReL
C17H21N3O2ReCl5 30.32 4.11 5.54 4.32 27.98
22.29 30.66 5.03 6.60 3.33 32.09 45 Red brown 288-290 636.26 PtL
C17H21N3O2PtCl4 33.12 4.03 7.09 4.65 31.22 21.54
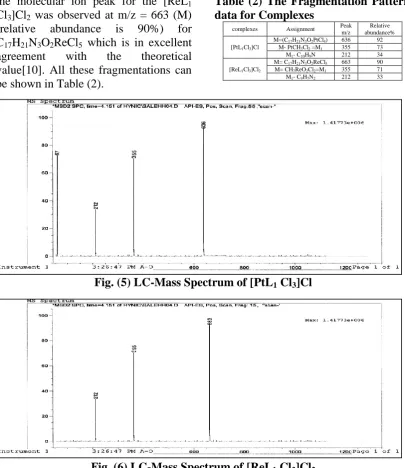
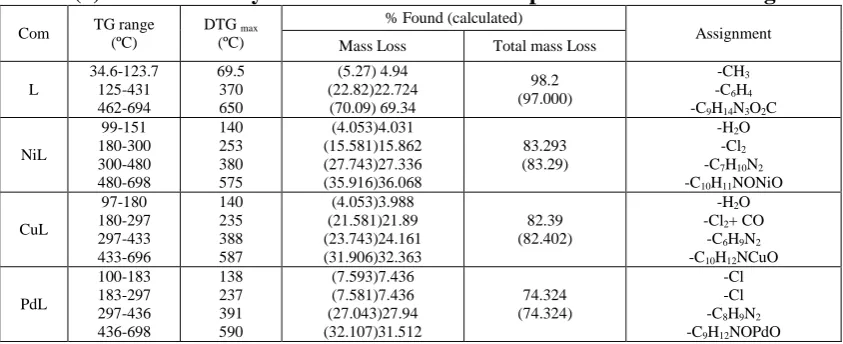
Mass spectra for complexes
The main high resolution mass spectrometer values of the [PtL Cl3]Cl
and [ReL1 Cl3]Cl2 complexes are shown
in Figure (5) and Figure (6) respectively,
the molecular ion peak for the [PtL1
Cl3]Cl was observed at m/z = 636 (M)
(relative abundance is 92%) for
C17H21N3O2PtCl4 which is in excellent
the molecular ion peak for the [ReL1
Cl3]Cl2 was observed at m/z = 663 (M)
(relative abundance is 90%) for
C17H21N3O2ReCl5 which is in excellent
agreement with the theoretical
value[10]. All these fragmentations can be shown in Table (2).
Table (2) The Fragmentation Pattern data for Complexes
complexes Assignment Peak m/z
Relative abundance%
[PtL1Cl3]Cl
M=(C17H21N3O2PtCl4) 636 92
M- PtCH3Cl2 =M1 355 73
M1- C10H9N 212 34
[ReL1Cl3]Cl2
M= C17H21N3O2ReCl5 663 90
M= CH7ReO2Cl2=M1 355 71
M1- C9H7N2 212 33
Fig. (5) LC-Mass Spectrum of [PtL1 Cl3]Cl
Fig. (6) LC-Mass Spectrum of [ReL1 Cl3]Cl2
IR spectra:
The bands IR of spectra of the ligand and its complexes were observed at 1740, 1696 and 1640 cm-1 due to the ν(C=O) ring pyrazol, ν(C=O) and ν(C=N) functional groups, respectively, [11]. The IR spectra of the complexes exhibited bands for the ligand bands
with the appropriate shifts due
complexes formation [12]. Moreover, the ν(carbonyl) ring, ν(carbonyl) and ν(azomethine), bands of the ligand were observed at 1740, 1696 and 1640 cm
-1
and these bands were shifted to the lower frequencies by (76-62), (62-54)
Table (3) The Infrared Spectra Data of the free Ligand and its Metal Complexes in (cm-1)
Comp. υC=O ring υC=O υC=N υH2O υM-N υM-O Others bands
L 1740 1696 1640
CuL 1664 1636 1622 3418
891 447 413
NiL 1678 1642 1620 3410
883 451 424
PdL 1678 1637 1624 467 420
PtL 1675 1634 1624 465 424
ReL 1673 1636 1624 467 420
VOL 1678 1642 1624 470 432 1103, 1084, 1022= υ(SO999= υ(V=O)
4)
UV–Vis Spectra, Magnetic Moments
The electronic spectrum of the ligand exhibit intense absorption at 282 nm attributed to π→ π*. The electronic spectrum of Ni(II) complex showed three broad peaks at 434, 486 and 786 nm assigned to 3A2g (F) → 3T1g (P) , 3A2g
(F) → 3T1g (F) and 3A2g (F)→ 3T2g (F) [16]
and the electronic spectrum of Re(V) complex showed three broad peaks at 489, 637 and other at 715 nm assigned to 3T1g → 3A2g, 3T1g → 3T1g (P) and 3
T1g → 3T2g (F) respectively [17, 18].
The spectrum of VO(II) complex gave two band at 496 and 763 nm assigned to
2
B2 →2B1 and 2B2 →2E transition,
respectively suggesting a square
pyramidal geometry [18,19],
Furthermore, the magnetic moment of
the VO(II) (d1) complex was found to be 1.77 B.M. The electronic spectrum of Pd(II) complex showed two broad peaks at 493 and 765 nm assigned to 1A1g→ 1
B1g and 1A1g→ 1A2g, the electronic
spectrum of Pt(IV) complex showed two broad peaks at 485 and 520 nm assigned to 1A1g→ 1T2g and 1A1g→ 1T1g
respectively, suggesting an octahedral geometry. The electronic spectrum of Cu(II) complex showed one broad peaks at 494 nm assigned to 2B1g→ 2A1g,
suggesting an octahedral geometry. The magnetic moment value 2.84, 1.86 and 2.95 B.M. of Ni(II) (d8), Cu(II) (d9) and Re(V) (d2) complexes respectively are typical for octahedral geometry [18-20]. All these electronic spectra data can be shown in Table (4).
Table (4) Electronic Spectral Data of the Metal Complexes with Ligand and Magnetic Moments
Complex geometry µeff B.M ύ (cm -1
) ABS λmax(nm)
ε max L
mol-1cm-1 Assignments
L - 35460.99 2.48 282 24800 π→π*
[VOL1 (SO4)]
Square pyramidal 1.77
36101.08 20161.29 13106.15 2.377 0.916 0.024 277 496 763 23770 9160 240 π →π* 2
B2 → 2B1 2
B2 → 2
E
[NiL1Cl2(H2O)]
Octahedral 2.84
36363.63 23041.47 20576.13 12722.64 2.401 0.203 0.232 0.084 275 434 486 786 24010 2030 2320 840 π→π* 3
A2g(F)→3T1g(P)ν3 3
A2g(F)→ 3
T1g(F)ν2 3A
2g(F)→3T2g(F)ν1
[CuL1Cl2(H2O)]
Octahedral 1.86
36363.63 20242.91 2.082 0.604 275 494 20820 6040 π→π* 2
B1g → 2A1g
(dx2
-y2
→dz2
)
[PdL1 Cl]Cl
Square planar dia
35971.22 20283.97 13071.89 2.414 0.605 0.101 278 493 765 24140 6050 1010 π→π* 1
A1g→ 1B1 ν2 1
A1g→ 1
A2 ν1
[PtL1 Cl3]Cl
Octahedral dia
37174.72 32786.88 20618.55 19230.76 1.688 2.109 0.627 0.588 269 305 485 520 16880 21090 6270 5880 π →π* C.T 1
A1g→ 1T2g ν2 1
A1g→ 1
T1g ν1
[ReL1 Cl3]Cl2
Octahedral 2.95
36363.63 20449.89 15698.58 13986.01 2.459 0.983 0.546 0.208 275 489 637 715 24590 9830 5460 208 π →π* 3
T1g → 3A2g 3
T1g → 3T1g (P) 3T
1g → 3T2g (F)
dia= diamagnetic
Thermal Gravimetric Analyses TGA
To understand the thermal
decomposition processes of the studied
temperature range of 30–700 ºC. The obtained results from the TG curves for all these compounds are given in Table
(5). The final decomposition products were metal oxide CuO in the 696 ºC, NiO 698 ºC and PdO 698 ºC) [21, 22].
Table (5) Thermal Analysis Data of the Metal Complexes Derived from Ligand.
Com TG range (ºC) DTG (ºC) max
% Found (calculated)
Assignment
Mass Loss Total mass Loss
L 34.6-123.7 125-431 462-694 69.5 370 650 (5.27) 4.94 (22.82)22.724 (70.09) 69.34 98.2 (97.000) -CH3
-C6H4
-C9H14N3O2C
NiL 99-151 180-300 300-480 480-698 140 253 380 575 (4.053)4.031 (15.581)15.862 (27.743)27.336 (35.916)36.068 83.293 (83.29)
-H2O
-Cl2
-C7H10N2
-C10H11NONiO
CuL 97-180 180-297 297-433 433-696 140 235 388 587 (4.053)3.988 (21.581)21.89 (23.743)24.161 (31.906)32.363 82.39 (82.402)
-H2O
-Cl2+ CO
-C6H9N2
-C10H12NCuO
PdL 100-183 183-297 297-436 436-698 138 237 391 590 (7.593)7.436 (7.581)7.436 (27.043)27.94 (32.107)31.512 74.324 (74.324) -Cl -Cl -C8H9N2
-C9H12NOPdO
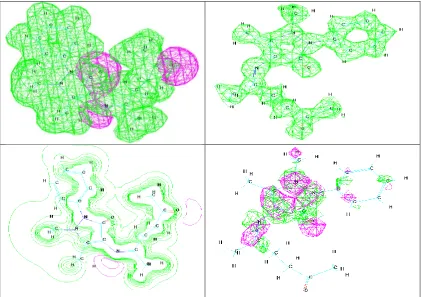
Electrostatic Potentials:
Electron distribution governs the electrostatic potential of the molecules. The electrostatic potential (E.P) describes the interaction of energy of the molecular system with a positive point charge. (E.P) is useful for finding sites of reaction in a molecule; positively charged species tend to attack a molecule where the electro static
potential is strongly negative
(electrophonic attack) [6, 7]. The (E.P) of the free ligand was calculated and plotted as 2D contour to investigate the reactive sites of the molecules, Figure (7). Also one can interpret the stereochemistry and rates of many reactions involving “soft” electrophiles and nucleophiles in terms of the properties of frontier orbital HOMO and LUMO. The results of calculations show that the LUMO of transition metal ions prefer to react with the HOMO of
three-donor atoms of two oxygen of carbonyl and nitrogen of azomethen group for free ligand, Figure (7).
All theoretically probable
structures of free ligand and their complexes have been calculated by (PM3) and (ZINDO/1) methods in gas phase to search for the most probable model building stable structure, Table (6).
Fig. 7: Electrostatic Potential (HOMO and LUMO) Contours for Ligand
Table (6) Conformation Energetic in (K J.Mol-1) for the Ligand and Complexes
Compounds Binding Energy Heat of
Formation Electronic Energy
Dipole moment (debyes)
Total Energy
L -4473.7665926 -16.3765926 -603103.5158746 5.0380 -78660.2887016
NiL -4326.4163316 2015.4616684 -1169716.1185115 19.648 -142058.723112
CuL -4157.8280108 2249.3499892 -1235762.7660891 6.152 -12846.9020078
PdL -2326.163316 2115.4616684 -1369716.1185115 9.648 -122058.723112
ReL -3157.8280108 2349.3499892 -135762.7660891 11.152 -112846.9020078
PtL -1126.463316 2515.4616684 -1149716.1185115 11.648 -112058.723112
VOL -2257.280108 3049.3499892 -1225762.7660891 8.152 -172846.9020078
Table (7) Comparison of Experimental and Theoretical Vibrational Frequencies for Ligand
Ligand υ(CH)aromatic υ(CH)aliphatic υ(C=O)ring υ(C=O) υ(C=N)
L
3035* 3060** -0.82***
2920* 2998** -2.67***
1740* 1668** 4.13***
1696* 1644** 3.06***
1640* 1637** 0.18*** *Experimental frequency. ** Theoretical frequency. *** Error% due to main difference in the experimental measurements and theoretical treatments of vibration spectrum.
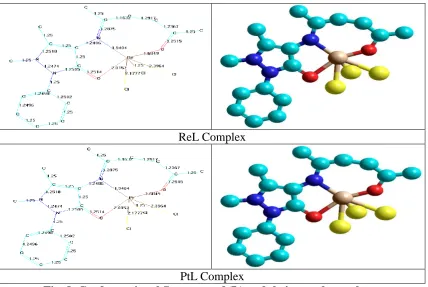
VL Complex
NiL Complex
CuL Complex
ReL Complex
PtL Complex
Fig. 8. Conformational Structure of (L) and their metal complexes
References:
[1] Sani, U. 2011. Synthesis,
Characterization and Antimicrobial Activity of Nickel(II) Complex with
a Schiff base Derived from
Salicyldehyde and phenylhydrazine. Centre point J.; 17(2):113-118 [2] Abdulghani, A. J. and Ahmed, Z.Z.
2011. Synthesis, structure and Characterization of New metal Complexes of Schiff base Derived from Isatin N-Benzylisatin and 4-Aminoantipyrine. Pakistan J of Chem.; 1(3):100-113.
[3] Al-Hamdani, A. A. S. 2010.
Synthesis and Characterization of
some new transition metal
complexes with 2,5-di(4-amino
phenazonyl) hexan. J. of Al-Nahrain Uni.;13(4):15-22.
[4] Al-Hassani, R. A.; Sinan, M. M.
and Abdullah, S. M. 2013.
Synthesis, characterization, photo degradation and biological study of Schiff base of Isatin derivative with Zr(IV), Rh(III) and Pd(II) Ions. Peak J. Phys. Environ. Sci. Res.; 1(6):95-105.
[5] Muna, A. 2013.Coordination
Behavior of N/O donor ligand with some transition metals. Acta Chim. Pharm. Indica.; 3(2):127-134.
[6] Young, D.C. 2001. Computational Chemistry A practical Guide for Applying Techniques to real-world Problems. John Wiley and Sons, Inc. publication, new York.
[7] Mueller, M. 2002. Fundamentals of
Quantum Chemistry, Kluwer
Academic publishers. 280P.
[8] Geary, W. J. 1971. The used
conductivity measurements
inorganic solvents for the
characterization of coordination compounds.; Coord. Chem. Rev:7-81.
[9] Al-Hamdani, A. A. S. and Shaker
Sh. A. 2011. Synthesis,
[10]Al-Hamdani, A. A. S 2013. Metal complexes of Multidentate Schiff
base –Azo Ligand: Synthesis,
Characterization and biological
Activity. Dirasat, PureScie.;
39(1):61-72.
[11]Nakamaoto, N. 2009. Infarared and Raman Spectra of Inorganic and Coordination Compounds, 6th Ed, part 2 John Wiley and Sons, Inc., New Jersy.
[12]Nakamaoto, K. 1981. Infarared
Spectra of Inorganic and
Coordination Compounds, 2th Ed, part 2 John Wiley and Sons, Inc., New Jersy:209-212.
[13]Yousif, E.; Mehdi, B. I.; Rahimi, Y.; Salimon, J.; Salih, N. and Abdullah, B. M. 2014. Synthesis, structure and antibacterial activity
of some triorganotin (IV)
complexes with a benzamido
alanime ligand. J. of Taibah Uni. for Sci.; 8:276-281.
[14]Shaker, Sh. A.; Mohammed, H. A. and Al-Hamdani, A. A. S. 2010. Preparation, Physico-Chemical and Spectroscopic Investigation of
Thiacetazone and Quinalizarin
Complexes with Mn (II), Fe (II), Co (II), Ni (II), Cu (II), Zn (II), Cd (II) and Pb (II). Aus. J. Basic. & Ap. Sci.; 4(10): 5178-5183.
[15]Sliverstien, R.M. and Webser, X. F. 2005.Spctrometric Identification of Organic Compounds. 7th Ed., Jon Wiley and Son, Inc. USA.
[16]Al-Hamdani, A. A.S.; Balkhi, A. M.; Falah, A. and Shaker, Sh.
A.2015. New azo-Schiff base
derived with Ni(II), Co(II), Cu(II),
Pd(II) and Pt(IV) complexes:
Preparation, spectroscopic
investigation, structural studies and biological activity. J. Chil. Chem. Soc.; 60, (1): 2774-2785.
[17]Al-Hamdani,A.A.S and Al-Zoubi, W. 2015. New metal complexes N3 tridentate ligand: Synthesis, spectral studies and biological activity. Spectrochimica Acta Part A : Mole. and Biomol., 137 : 75-89.
[18]Lever, A. B. P. 1968. Inorganic
Electronic Spectroscopy. New
york.; 6. 121.
[19]Al-Hamdani, A. A. S.; Mahmoud, M.A. and Bakir, Sh. R. 2013. Synthesis, Structural Studies of Some new Transition complexes of Semicabazide hydri Chlride Schiff Base Derivatives. J Baghdad for Sci.; 10(3): 583-596.
[20]Al-Hamdani, A. A. S.; Balkhi, A. M. and falah, A. and Shaker, Sh. A. 2015. New Azo-Schiff base Derived with Ni(II), Co(II), Cu(II), Pd(II) and Pt(IV) Complexes: Preparation,
Spectroscopic Investigation,
Structural Studies and Biological Activity. J. Chil. Chem. Soc.; 60(1): 2774-2785.
[21]Al-Hamdani, A. A. S.; Balkhi, A. M. and Falah, A. 2013. Synthesis,
Spectroscopic and biological
activity Studies of Azo-Schiff base and Metal Complexes derived from
5-Methyltryptamine. Damascus
Uni. J. for Basic Sci.; 29(2):21-41. [22]Coats, A. W. and Redfern, J. P.
،يفيط صيخشت ،ريضحت:ديدج نسلا يثلاث دناكيل عم ةيلاقتنلاا رصانعلا تادقعم
اهبيكارت ةساردو يرارح للحت
ينادمحلا حلاص يلع سابع
ةدومح بلاغ باحر
قارعلا ,دادغب ,دادغب ةعماج ,تانبلل مولعلا ةيلك ,ءايميكلا مسق
:ةصلاخلا
عم نداعملا تادقعم نم ةديدج ةلسلس ريضحت ديدجلا دناكيللا
1,5 اييم ياانث
-4 -( 5 -نااسكهوسكوا
-2
-)ونيميا يانث ي
-2 ينف -1 -لوزورياب
-3 نم قتشملا ديدجلا نوا 2,5
عام نوا ياانث نااسكه 4
نوزاانيف وانيما
سامخلا موينيرلا , يانيلا مويدلابلا , يانيلا ساحنلا , يانيلا كينلا , عابرلا مويدانفلا نم ك تادقعم ترضحو ةيجااسفنبلا قوااف ,ءاراامحلا كااحت ةعاا اا حااايعت ةعاااسوب ةرااضحملا تااابكرملا كاالخ عااابرلا نيااتلابلاو –
نزواالا طحارااحلا االحتلا لاانحنمو ,نوبحاااكلاو نوااتوربلا طراايتنل ااسيعانغملا طوواانلا نينراالاو ةاالتكلا ,ةااييرملا االا ااالتماا حواالكلا توااتحمو رااىانعلل قيقداالا اايلحتلاو ااسيعانغملا م ااعلاو ةاايحاوملا ةيليااىوتلاو طحذ
ميك ربياهلا جمانرب مادختساب
-8 باراتلا ةاقاعو نيواكتلا ةحاراح دااجيا طزااغلا حوولااب تابكرملا بيكارت تددح
ةجحدب بوقلا يانث م عو تانورتكلاا ةقاعو ةيلكلا ةحارحلاو 298
نفلك
ةيحاتفملا تاملكلا
, ف دعاوق تادناكيل : 5,2