https://doi.org/10.5194/se-10-893-2019
© Author(s) 2019. This work is distributed under the Creative Commons Attribution 4.0 License.
Lithospheric and sublithospheric deformation under the Borborema
Province of northeastern Brazil from receiver function
harmonic stripping
Gaelle Lamarque1,2and Jordi Julià1,3
1Programa do Pós-Graduação em Geodinâmica e Geofísica, Universidade Federal do Rio Grande do Norte, Natal, RN CEP 59078-090, Brazil
2Ifremer, Geosciences Marines, Centre de Brest, 29280 Plouzané, France
3Departamento de Geofísica, Universidade Federal do Rio Grande do Norte, Natal, RN CEP 59078-970, Brazil
Correspondence:Gaelle Lamarque (gaelle.lamarque@ifremer.fr) Received: 27 February 2019 – Discussion started: 4 March 2019
Revised: 13 May 2019 – Accepted: 14 May 2019 – Published: 21 June 2019
Abstract. The depth-dependent anisotropic structure of the lithosphere under the Borborema Province in northeast Brazil has been investigated via harmonic stripping of re-ceiver functions developed at 39 stations in the region. This method retrieves the first (k=1) and second (k=
2) degree harmonics of a receiver function dataset, which characterize seismic anisotropy beneath a seismic station. Anisotropic fabrics are in turn directly related to the defor-mation of the lithosphere from past and current tectonic pro-cesses. Our results reveal the presence of anisotropy within the crust and the lithospheric mantle throughout the entire province. Most stations in the continental interior report con-sistent anisotropic orientations in the crust and lithospheric mantle, suggesting a dominant northeast–southwest perva-sive deformation along lithospheric-scale shear zones de-veloped during the Brasiliano–Pan-African orogeny. Several stations aligned along a northeast–southwest trend located above the (now aborted) Mesozoic Cariri–Potiguar rift dis-play large uncertainties for the fast-axis direction. This non-azimuthal anisotropy may be related to a complex anisotropic fabric resulting from a combination of deformation along the ancient collision between Precambrian blocks, Meso-zoic extension and thermomechanical erosion dragging by sublithospheric flow. Finally, several stations along the At-lantic coast reveal depth-dependent anisotropic orientations roughly (sub)perpendicular to the margin. These results sug-gest a more recent overprint, probably related to the presence of frozen anisotropy in the lithosphere due to stretching and rifting during the opening of the South Atlantic.
1 Introduction
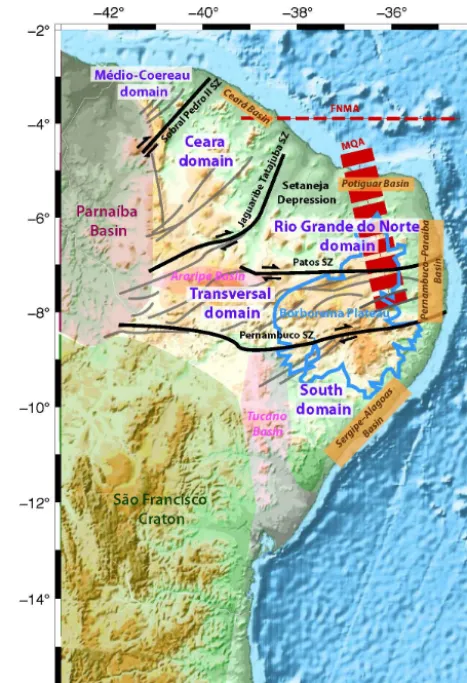
Understanding intraplate deformation and its relationship to deep geodynamic processes such as sublithospheric flow is critical for improving our understanding of the evolu-tion of continents. The Borborema Province in northeast-ern Brazil, for instance, has witnessed several cycles of de-formation, as well as recurrent episodes of intraplate vol-canism and uplift, during its geological history. Brasiliano– Pan-African deformation is well represented through the net-work of shear zones that pervade the Borborema Province (Vauchez et al., 1995; Neves et al., 2000). These shear zones separate several tectonic terrains of the Paleoproterozoic Era and Archean Eon that amalgamated and/or were reworked during the orogeny (Jardim de Sá et al., 1992; Cordani et al., 2003). Major Neoproterozoic shear zones thus constitute in-herited structures that could have influenced the geometry of subsequent tectonic processes, such as the opening of the South Atlantic Ocean (Tommasi and Vauchez, 2001; Kirk-patrick et al., 2013). Also, the current topography of the Borborema Plateau and the Sertaneja Depression may have resulted from a combination of ongoing deep processes, such as edge-driven convection in the asthenospheric man-tle and/or stretching and thinning of the lithosphere during Mesozoic times (de Oliveira and Medeiros, 2012; Almeida et al., 2015).
or P-wave tomography (Simões Neto et al., 2019), and SKS splitting (Bastow et al., 2015) have greatly contributed to fur-ther our understanding of the relationships between inher-ited Precambrian structures, Mesozoic extensional processes, and episodes of post-breakup volcanism and uplift. However, several tectonic and geodynamic questions remain unan-swered. In particular, the presence of the Meso-Cenozoic Macau–Queimadas volcanism (MQA, Fig. 1) – which does not present a clear age progression – remains unclear. More-over, SKS waves showed little to no evidence of splitting in the continental interior (Bastow et al., 2015), which is diffi-cult to comprehend given the complex tectonic and deforma-tional history of the province.
Here, we determine depth-dependent anisotropy in the Borborema lithosphere (crust and mantle) from harmonic analysis of receiver functions. Our results confirm that SKS splitting at coastal stations is dominated by fossil anisotropic fabrics in the lithospheric mantle, likely originating from Mesozoic extension. In the continental interior, receiver function stripping reveal fast-axis orientations consistent with major regional shear zones, suggesting their continua-tion at depth into the lithospheric mantle. Our results also show the presence of non-azimuthal anisotropy above sta-tions located along the now aborted Cariri–Potiguar rift. This non-azimuthal anisotropy is likely related to complex fos-sil anisotropic fabrics, resulting from a combination of de-formation along the ancient collision between Precambrian blocks, the Mesozoic extension, and thermomechanical ero-sion/mantle dragging by sublithospheric flow.
2 Geological setting
The Borborema Province formed during the Neoproterozoic Brasiliano–Pan-African orogeny (600–580 Ma), as a result of the collision between the São Luiz–West Africa Craton to the north and the São Francisco–Congo Craton to the south (Jardim de Sá et al., 1992; Cordani et al., 2003). Thus, it rep-resents the west central portion of a larger Neoproterozoic belt that resulted from the assembly of the Gondwana super-continent.
The basement of the Borborema Province comprises mostly gneisses and migmatitic rocks of Paleoproterozoic age, and small Archean nuclei, overlain by Neoprotero-zoic metasediments formed during the Brasiliano orogeny (Neves, 2003). This basement is affected by an extensive net-work of Neoproterozoic shear zones oriented east–west and northeast–southwest (Fig. 1). These shear zones are major structures several hundreds of kilometers long and tens of kilometers wide (Vauchez and da Silva, 1992) that can be traced into the African continent in paleogeographic recon-structions (Arthaud et al., 2008). The Borborema shear zones were activated in high temperature and high-to-low pres-sure conditions and are associated with a strong production of magmas from both crustal and mantle sources (Vauchez
Figure 1.The main geological features of the Borborema Province superimposed on a topographic map of northeastern Brazil. Black and grey lines correspond to major shear zones (SZ), and red dashed lines correspond to the volcanic alignments of Fernando de Noronha–Mecejana (FNMA) and Macau–Queimadas (MQA). The Borborema Plateau boundaries are indicated in blue.
et al., 1995). The shear zone network can be split into two domains: a western domain of northeast-striking strike-slip faults, and an eastern domain of more sinuous, discontinu-ous east–west-striking shear zones (Vauchez et al., 1995). These two domains could be related to two discrete colli-sional events with the Parnaíba Block to the west and the São Francisco Craton to the south, respectively, which forced northeast extrusion of the province at the end of the Neopro-terozoic (Araújo et al., 2014).
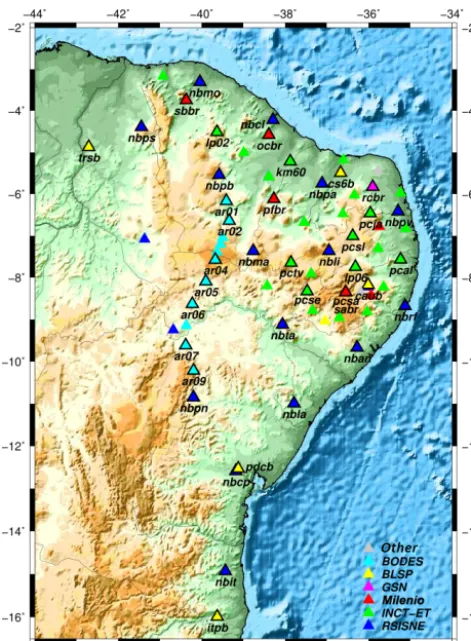
Figure 2. Topographic map of northeast Brazil with locations of broadband and short-period stations considered in this study. Sta-tions are color-coded by network: staSta-tions from the RSISNE net-work are represented by dark blue, INCT-ET by green, Milenio by red, GSN by pink, BLSP by yellow, BODES by light blue and “other” networks by grey (see legend). Only the selected stations have been named and are represented using black contours.
of independent terrains is unclear, but there is a general con-sensus in arranging them into five major Precambrian do-mains: (i) Médio–Coereau, in the northwestern most tip of the province; (ii) Ceará, between the Sobral–Pedro II and Jaguaribe–Tatajuba shear zones; (iii) Rio Grande do Norte, immediately east of the Ceará domain; (iv) transversal or central, between the Patos and Pernambuco lineaments; and (v) southern, immediately north of the São Francisco Craton (Fig. 1). On the other hand, it has been suggested that the Borborema Province has been a single unit since 2.0 Ga and that the shear zones recorded intracontinental supracrustal deformation during the Brasiliano orogeny (Tommasi et al., 1995; Vauchez et al., 1995; Neves, 2003). In this later model, micro-plate amalgamation largely predates the Brasiliano orogeny, which would have only partially reworked preex-isting plate structures in the Borborema Province.
During the Mesozoic, opening of the South Atlantic sep-arated the Borborema Province from its African conjugate (de Matos, 1992). Continental rifting resulted in significant
crustal thinning in the region (Santos et al., 2014; Lima Neto et al., 2013; Luz et al., 2015b), forming both marginal (e.g., Ceará, Potiguar, Pernambuco–Paraíba and Sergipe–Alagoas) and intracontinental (e.g., Araripe and Tucano) sedimentary basins (Fig. 1). The post Gondwana breakup evolution of the Borborema Province is characterized by recurrent magma-tism (Knesel et al., 2011) and postulated episodes of uplift in the Borborema Plateau (Morais Neto et al., 2009; de Oliveira and Medeiros, 2012) and the Araripe Basin (Assine, 2007; Marques et al., 2014). Intraplate volcanism is characterized as small-volume, long-lived and mainly alkalic in nature (Knesel et al., 2011). It is arranged along two main linear alignments of Mesozoic–Cenozoic volcanic rocks (Fig. 1): the Macau–Queimadas Alignment (MQA), mostly onshore and approximately trending in the north–south direction; and the Fernando de Noronha–Mecejana Alignment (FNMA), mostly offshore and trending in the east–west direction (Mizusaki et al., 2002; Knesel et al., 2011, and references therein). The MQA displays K/Ar ages ranging from 80 to 30 Ma (Mizusaki et al., 2002) and 40Ar/39Ar ages ranging from 93 to 7 Ma (Knesel et al., 2011) without a clear age pro-gression, whereas the FNMA displays progressive K/Ar and 40Ar/39Ar ages from the Fernando de Noronha archipelago (22 to 2 Ma) to the west (Knesel et al., 2011, and references therein), to the Mecejana volcanism (34 to 26 Ma) to the east (Mizusaki et al., 2002).
is interpreted as resulting from lateral flow from a distant mantle plume. Such asthenospheric flow might represent the source of Meso-Cenozoic intraplate volcanism in northeast-ern Brazil.
3 Data and methodology 3.1 Seismic data
Seismic data for this study were obtained at 75 seismic sta-tions in northeastern Brazil. These stasta-tions belong to a va-riety of seismic networks, both permanent and temporary. The Rede Sismográfica do Nordeste (RSISNE) consists of 19 broadband stations equipped with RefTek 151-120 sen-sors feeding RT-130 digitizers (24-bit) sampling at 100 Hz, with an interstation spacing of about 250 km and a network aperture of∼800 km. The RSISNE network has been in op-eration since 2011 and was initially funded by the national oil company Petrobras. The Instituto Nacional de Ciência e Tecnologia em Estudos Tectônicos (INCT-ET) network, consists of 7 broadband stations and 22 short-period sta-tions. The broadband stations were arranged along an ap-proximately 1000 km long line with interstation spacing of about 100 km. They were equipped with STS-2.5 Streckeisen sensors and Q330 data loggers (24-bit) sampling at 100 Hz. The 22 short-period stations were equipped with L4A-3D Sercel sensors (2 Hz cutoff frequency) and 24-bit RT-130 digitizers sampling at 100 Hz. They were in operations be-tween 2011 and 2012 and recorded continuously for bebe-tween 6 months and 1.5 years. The INCT-ET network was funded by the Conselho Nacional de Desenvolvimento Científico e Tecnológico (CNPq). Up to six broadband stations operated during the period from 2007 to 2009 under the “Institutos do Milênio” project. These stations were equipped with KS-2000 Geotech sensors and Geotech digitizers sampling con-tinuously at 100 Hz. They recorded concon-tinuously for periods ranging from 6 months to 2 years, with two of them still cur-rently in operation. This network was also funded by CNPq. Station RCBR belongs to the Global Seismographic Network (GSN). This station has been recording since March 1999 using a Guralp CMG-3T sensor (replaced in July 2004 by a STS-2 Streckeisen sensor), which always feeds a Q330 data logger and samples continuously at 40 Hz. Seven broadband stations belonging to the broader Brazilian Lithosphere Seis-mic Project (BLSP) (Assumpção et al., 2004) operated for 1.5 to 3.0 years in northeastern Brazil. They were equipped with either Guralp CMG-3T or STS-2 Streckeisen sensors and 24-bit RT-130 digitizers sampling at 100 Hz. Finally, 11 broadband stations deployed during the Borborema Deep Electromagnetic and Seismic (BODES) experiment were in-stalled along an approximately north–south line crossing the Araripe Basin. They were equipped with RefTek 151-120 sensors and RT-130 digitizers. The stations were in opera-tion between 2015 and 2017 and recorded continuously for
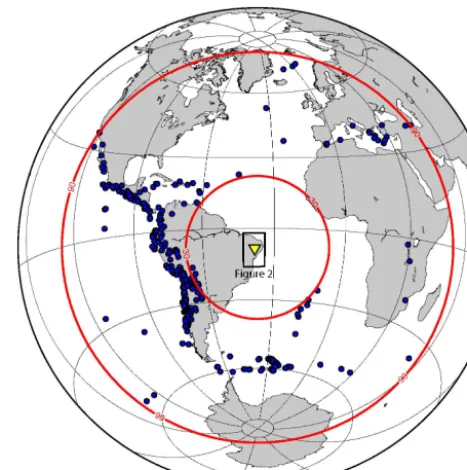
Figure 3.Location of earthquakes (blue circles) used for receiver function analyses, occurring at epicentral distances between 30 and 90◦(red lines) and with a magnitude ofMb≥5.0. The yellow tri-angle corresponds to the seismic network presented in Fig. 2.
∼2 years at 100 Hz. Further details regarding the 75 seis-mic stations are given in the Table S1, and their geographical location is displayed in Fig. 2.
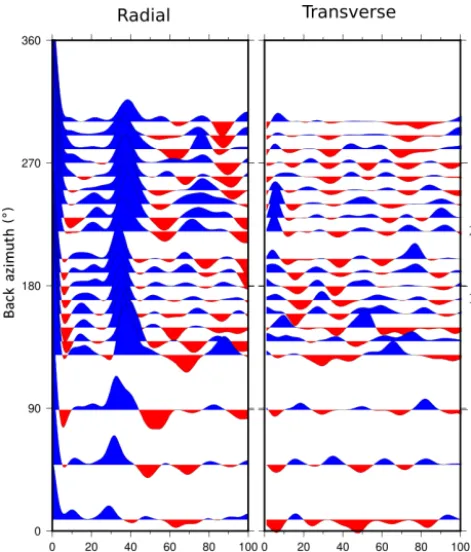
Figure 4. Example of stacked receiver functions represented by back-azimuth bins of 10◦at station PFBR. Grey numbers corre-spond to the number of stacked receiver functions.
The main processing steps involved in the development of the receiver function estimates are summarized below, and further details regarding computational and quality control procedures can be found in Luz et al. (2015a). First, we se-lected seismic sources with magnitude greater than 5.0 Mb and occurring at epicentral distances between 30 and 90◦ from the selected stations (see Fig. 3). The corresponding waveforms were then windowed 10 s before and 110 s after the P-wave arrival time, demeaned, detrended, tapered with a 5 % cosine taper, and high-pass filtered above 0.05 Hz to remove low-frequency noise. All waveforms were resampled to 20 Hz, after low-pass filtering below 8 Hz to avoid alias-ing. Before deconvolution, the waveforms were additionally low-pass filtered below 1.25 Hz with an acausal Gaussian filter (Gaussian width 2.5). The deconvolution procedure of the vertical component from the radial and transverse com-ponents was implemented using the iterative, time-domain procedure of Ligorria and Ammon (1999), with 500 itera-tions. The deconvolved time series were again filtered with the same Gaussian filter (width 2.5). Percent recoveries of the observed radial component under 85 % were automatically rejected, and the remaining receiver functions were visually inspected for each station to identify and remove outliers.
Prior to implementing the anisotropy analysis, each radial and tangential receiver function was migrated to depth after P to S ray-tracing through the global velocity model ak135-f
(Kennett et al., 1995; Montagner and Kennett, 1996). The purpose of the migration is to correct the phase move-out introduced by varying incidence angles among the incoming teleseismic P-wave-fronts, effectively equalizing the receiver function waveforms in the depth domain (Dueker and Shee-han, 1997). Migration before harmonic stripping at individ-ual stations has previously been utilized by Audet (2015), Cossette et al. (2016) and Tarayoun et al. (2017). Similarly, Bianchi et al. (2010), Piana Agostinetti et al. (2011) and Pi-ana Agostinetti and Miller (2014) applied harmonic decom-position on depth-migrated cross sections obtained through CCP stacking of receiver functions. Next, the migrated ra-dial and transverse receiver functions for each station were grouped by back azimuth in 36 nonoverlapping, 10◦ wide bins, and averaged within each bin. A given station was then selected if it presented two averaged receiver functions (one radial and one tangential) in at least nine bins. This selection criterion ensured a sampling of at least 90◦in back azimuth, either continuously or discontinuously, around the station. A back-azimuthal coverage from at least nine bins (each 10◦ wide) allows the mapping of either half the period for a two-lobed pattern (anisotropy with plunging fast axis of symme-try) or a full period for a four-lobed pattern (anisotropy with horizontal fast axis of symmetry). A total of 39 stations were thus selected for anisotropy analysis. An example of stacked and migrated receiver functions is displayed in Fig. 4.
3.3 Estimating depth-dependent anisotropy within the lithosphere
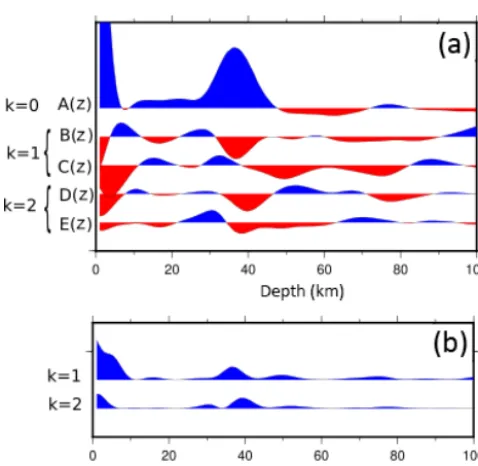
Figure 5.Example of results obtained at station PFBR using the harmonic stripping method of Bianchi et al. (2010).(a)The har-monic functions obtained by solving Eq. (1) are represented from top to bottom: A(z), first harmonic degree (k=0);B(z), cos(φ)
term of the second degree harmonic (k=1);C(z), sin(φ), term of the second degree harmonic (k=1);D(z), cos(2φ)term of the third (k=2) harmonics; andE(z), sin(2φ)term of the third (k=2) har-monics.(b)The energy is represented for harmonic degreesk=1 andk=2.
functions express the projection of this harmonic along the north–south and east–west directions, which correspond to the coefficients multiplying the cos(φ)and sin(φ)terms, re-spectively. Fork=2, a four-lobed periodicity ofπ is related to the presence of an anisotropic layer with a horizontal sym-metry axis (Maupin and Park, 2007). As for the second de-gree harmonic, two coefficient functions express the projec-tion of this harmonic degree along the north–south and 45◦N directions, corresponding to the coefficients multiplying the cos(2φ) and sin(2φ)terms, respectively. The harmonic de-composition can be expressed in matrix form (Eq. 1) and solved for the five coefficients for the three harmonic degrees (k=0,1,2) through a singular value decomposition. These harmonics are calculated for every depth within a selected depth-window.
The matrix equation that implements the harmonic decom-position is given by
R1(z) .. . Rn(z)
T1(z) .. . Tn(z)
=
1 cos(φ1) sin(φ1) cos(2φ1) sin(2φ1) . . . . . . . . . . . . . . . 1 cos(φn) sin(φn) cos(2φn) sin(2φn)
0 cos(φ1+π/2) sin(φ1+π/2) cos(2(φ1+π/4)) sin(2(φ1+π/4)) . . . . . . . . . . . . . . . 0 cos(φn+π/2) sin(φn+π/2) cos(2(φn+π/4)) sin(2(φn+π/4))
× A(z) B(z) C(z) D(z) E(z) , (1)
whereφiis the back azimuth of thei-thR(radial) andT (tan-gential) receiver function doublet,A(z) represents the first harmonic coefficient (k=0), B(z) and C(z) are the coef-ficient functions of the second harmonic (k=1), andD(z) andE(z) are the coefficient functions of the third (k=2) harmonic.
After solving the matrix Eq. (1) within a specific depth-window and calculating the five harmonic coefficients, we search for the presence of anisotropy by inspecting theB(z), C(z),D(z)and/orE(z)terms. If at least one of these com-ponent displays nonzero amplitudes, we calculate the energy of the second (k=1) and the third (k=2) harmonic degrees as proposed by Licciardi and Piana Agostinetti (2016):
Ek=1= n X
z=1
B(z)2+C(z)2 (2)
and
Ek=2= n X
z=1
D(z)2+E(z)2. (3)
is an anisotropic layer with a horizontal axis of symmetry. In that case, we rotateD(z)andE(z)for each angle increment α(whereα∈ [0,2π]) and search for the value ofαthat max-imizesD(z), and therefore minimizesE(z). This value ofα can be directly interpreted as the trend of either the fast or the slow axis of symmetry.
An example of harmonic decomposition is shown for sta-tion PFBR in Fig. 5. In order to estimate uncertainties, we applied a bootstrap statistical approach by randomly resam-pling our receiver functions with replacement. We performed the analyses with 200 replications at each of the selected sta-tions. From these 200 values, we estimated the standard error (2σ), which corresponds to the uncertainty in the direction of the fast axis of symmetry. A measurement is considered as unreliable, and then rejected, if the estimated uncertainties are larger than 20◦.
4 Results
Anisotropy parameters were examined for each station at two depth-window ranges: (1) crust (Fig. 6a), which was as-sumed to be located at a depth of between 0 and 33 km, in agreement with the 32–40 km range estimated by Luz et al. (2015b) under the Borborema Plateau and 30–33 km under the surrounding basins; and (2) lithospheric mantle, which was taken to be at a depth between 33 and 100 km (Fig. 6b). We assume that the layer with the strongest anisotropy will dominate the results in the case of several anisotropic lay-ers. However, it might happen that results reflect the aver-age value from different anisotropic layers, or from different types of anisotropy in the case of similar anisotropic strength. All results are indicated in Table 1.
An inspection of Fig. 6a reveals that the crust of northeast Brazil presents seismic anisotropy, both within the interior of the continent and along the coast. A number of stations, how-ever, display uncertainties larger than 20◦. The significance of these large uncertainties are discussed in Sect. 5. Unre-solved anisotropic directions within the crust are recorded around longitude −40◦ for stations nbpb, ar02, ar05, ar06 and nbpn, at the border of the Borborema Plateau (stations nbta, pctv, nbli and caub), and within the Sergipe–Alagoas and Pernambuco basins (stations nban and pcal). The major-ity of stations that sample clear anisotropic directions display a northeast–southwest to east–west trending axis of symme-try, except stations cs6b (trends ∼ north-northwest–south-southeast), km60 and nbma (trend north–south). We mainly measure anisotropy with 2π-periodicity (k=1) related to a dipping interface or anisotropy with a plunging axis of sym-metry, but some stations display clear π-periodic horizon-tal anisotropy (stations ar09, sabr, pcsa, pcsl, pcja, lp06 and nbmo). We note that, in most cases, even thoughk=1 har-monics display higher energy contents than k=2 harmon-ics, both pairs of harmonics display energies with compara-ble strengths (see Supplement, Fig. S1). For example, station
PFBR (Fig. 5) shows clear, nonzero energy levels for both k=1 andk=2 harmonics in the crust between 0 and 33 km. Figure 6b shows that the lithospheric mantle is character-ized by seismic anisotropy throughout the entire province, with the exception of a few stations that display large uncer-tainties (discussed in Sect. 5). Those include stations within the Parnaíba Basin (trsb), around longitude−40◦(ar01, ao05 and nbpn), along the southern portion of the Borborema Plateau (nbta and pcse) and along a northeast–southwest axis located northwest of the Borborema Plateau (nbma, pfbr, nbpa and cs6b). Most anisotropic directions trend northeast– southwest to east–west, with the exception of stations km60 and nbma that show north–south trends. As for the crust, we mainly measure anisotropy with 2π-periodicity (k=1) related to a dipping interface or anisotropy with a plung-ing axis of symmetry, but some stations display clear π -periodic horizontal anisotropy (stations ar02, km60, lp06, pcal, nban, nbmo, nbpb, pctv and rcbr). Note that stations located along the continental margin show anisotropy within the lithospheric mantle with a fast axis of symmetry that is oblique (stations nbmo, nbpv, nbrf, nban and nbit) or perpen-dicular (stations nbcl and pcal) to the coast.
In the case where stations recorded anisotropic directions at both crustal and mantle levels, most of them show con-sistent orientations in the two domains. There are a few in-stances, nonetheless, in which unaligned orientations for the crust and the lithospheric mantle are observed (ar04, ar09, nbcl, nbit, nbps, nbrf and rcbr).
5 Discussion
A complex combination of lattice-preferred orientation (LPO) and shape-preferred orientation (SPO) could be present in the mantle, although LPO is likely to dominate (Nicolas and Christensen, 1987; Silver, 1996; Mainprice et al., 2000). Fractures and cracks or fine layering, could additionally contribute in the crust. For that reason, our in-terpretations focus dominantly on mantle anisotropy, consis-tency of anisotropy within the lithosphere (crust and mantle), and regional-scale trends. Moreover, to avoid a bias related to local features, we refrain from interpreting small-scale vari-ations in anisotropy within the crust.
5.1 Pervasive anisotropy with a (sub)horizontal fast axis of symmetry
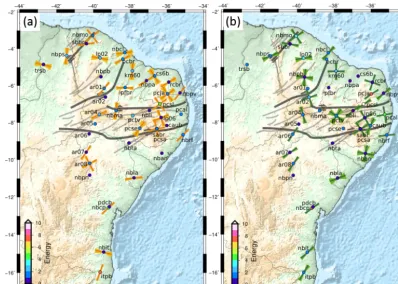
Figure 6. (a)Map of symmetry directions (dark lines) obtained for the crust (0–32 km). When one line is plotted at the station, it represents either the trend of the dip in the case of dipping interface or the trend of the fast axis in the case of plunging anisotropy. When two lines are plotted, they refer to the fast axis and to its perpendicular direction in the case of horizontal anisotropy. Light colors represent 2σuncertainties estimated from the bootstrap (after resampling 200 times).(b)Same for the lithospheric mantle (32–100 km). Station symbols have been color-coded according to the energy level of the dominant harmonic degree.
anisotropy with a slightly (10 to 15◦) dipping axis of sym-metry (see Supplement, Fig. S2). Note that, in that case, both k=1 and k=2 harmonics display consistent orientations. This is, the orientation inferred from thek=1 harmonic de-gree is always parallel to one of the two orientations inferred from thek=2 harmonic degree.
Moreover, we noticed that the anisotropic fast axes of sym-metry throughout the crust are consistent with those through-out the lithosphere for most of the stations, suggesting a pro-longation of crustal structures within the lithospheric man-tle. Within the continental interior, the anisotropic orien-tations are parallel or subparallel to the main east–west to northeast–southwest shear zone directions (stations ar02, nbli or lp06, for example). The consistency of the fast-axis direction of lithospheric anisotropy with large structures ob-served at the surface suggest a continuation of the main shear zones into the lithospheric mantle, as suggested by Vauchez et al. (2012). Nonetheless, a few exceptions are observed, for example, at stations sabr, sbbr and nbpb. Such discrepan-cies in the anisotropy orientations could be related to more local features such as fluid content, presence of cracks or plutonic bodies along the shear zones, fractures or mineral
assemblages (Levin and Park, 1997; Mainprice and Nicolas, 1989).
5.2 Anisotropy along the passive margin
Inspection of stations located along the eastern and equato-rial margins reveals that anisotropy exhibits – on average – directions either perpendicular or oblique to the coast in the lithospheric mantle. This observation is in agreement with SKS-splitting measurements in this area performed by Bas-tow et al. (2011) and Assumpção et al. (2011). These authors concluded that the anisotropy reported from SKS splitting along the northeastern Brazilian margins must be related to fossil anisotropy inherited from the opening of the South At-lantic Ocean. This interpretation is based on the relatively small time delay measured along the coast.
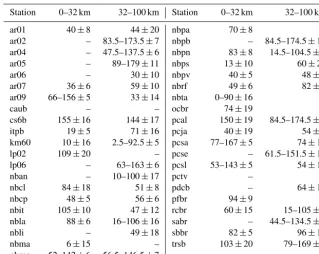
Table 1.Results of anisotropic symmetry directions for several depth ranges: 0–32, 32–100 and 0–100 km. One direction corresponds to either the trend of the dip in the case of dipping interface or to the trend of the fast axis in the case of plunging anisotropy. When two directions are indicated, they refer to the fast axis and to its perpendicular direction (horizontal anisotropy). Uncertainties were estimated from bootstrap quantification (resampling 200 times at every station).
Station 0–32 km 32–100 km Station 0–32 km 32–100 km
ar01 40±8 44±20 nbpa 70±8 –
ar02 – 83.5–173.5±7 nbpb – 84.5–174.5±12
ar04 – 47.5–137.5±6 nbpn 83±8 14.5–104.5±8
ar05 – 89–179±11 nbps 13±10 60±20
ar06 – 30±10 nbpv 40±5 48±9
ar07 36±6 59±10 nbrf 49±6 82±9
ar09 66–156±5 33±14 nbta 0–90±16 –
caub – – ocbr 74±19 –
cs6b 155±16 144±17 pcal 150±19 84.5–174.5±5
itpb 19±5 71±16 pcja 40±19 54±5
km60 10±16 2.5–92.5±5 pcsa 77–167±5 74±10
lp02 109±20 – pcse – 61.5–151.5±10
lp06 – 63–163±6 pcsl 53–143±5 54±10
nban – 10–100±17 pctv – –
nbcl 84±18 51±8 pdcb – 64±10
nbcp 48±5 56±6 pfbr 94±9 –
nbit 105±10 47±12 rcbr 60±15 15–105±5
nbla 88±6 16–106±16 sabr – 44.5–134.5±9
nbli – 49±18 sbbr 82±5 96±14
nbma 6±15 – trsb 103±20 79–169±9
nbmo 52–142±6 56.5–146.5±7
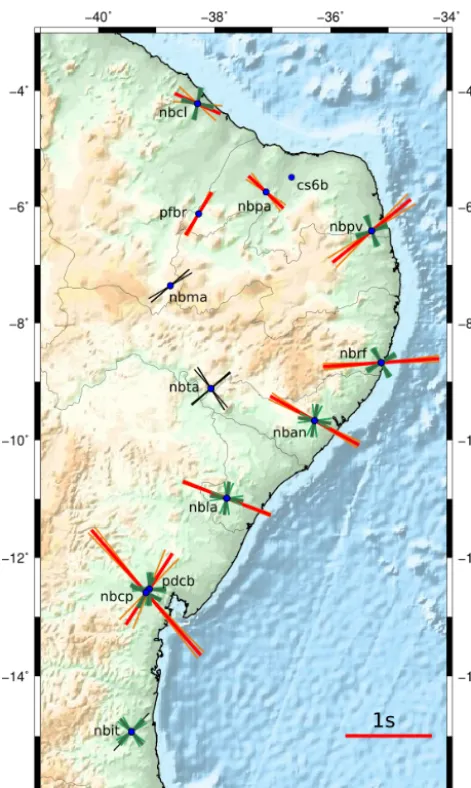
order of magnitude, suggesting slightly dipping to horizon-tal anisotropy beneath most stations; and (iii) SKS waves are mainly sensitive to (sub)horizontal anisotropy (Levin et al., 2007). Figure 7 shows a good agreement between anisotropic orientations recorded by receiver functions and SKS split-ting along the eastern and equatorial margins, confirming that the recorded anisotropy beneath coastal stations is mainly lo-cated in the lithospheric mantle. The oblique to parallel ori-entation of anisotropy along the east and equatorial coasts, respectively, is consistent with the opening trend of the mar-gin (Moulin et al., 2010).
5.3 Non-azimuthal anisotropy along the aborted Cariri–Potiguar rift
At a number of stations (ar05, nbma, pfbr, nbpa and cs6b), uncertainties regarding the direction of the fast axis of anisotropy are larger than 20◦. These stations, however, dis-play similar energy than stations with smaller uncertain-ties (see Fig. 6 and Fig. S3 in the Supplement). Interest-ingly, those stations seem to form a remarkable line trending northeast–southwest that approximately coincides with the location of the Cariri–Potiguar trend. Stations nbta and pcse also seem to align along the same direction more to the east. This northeast–southwest oriented line is located above a northeast–southwest trending channel of thin lithosphere im-aged by the tomographic study of Simões Neto et al. (2019).
We suggest that deformation from thermomechanical ero-sion by horizontal, sublithospheric flow along the channel – also postulated by Simões Neto et al. (2019) – must be on-going above this northeast–southwest channel. Furthermore, as initial thinning of the lithosphere along the channel was triggered by Mesozoic extension along the Cariri–Potiguar trend, alterations to the original Precambrian anisotropic fab-ric by Mesozoic extension might still be present. Addition-ally, we note that the location of the Cariri–Potiguar trend also marks the boundary between the east–west striking shear zones in the southern province from the northeast–southwest striking shear zones in the western province (Fig. 1). This suggests the Cariri–Potiguar trend also marks the location of a former paleo-suture that later acted as a zone of weakness along which the Mesozoic rift (now aborted) could develop. Thus, we believe the non-azimuthal anisotropy recorded at stations located along this trend is likely related to com-plex fossil anisotropic fabrics resulting from a combina-tion of deformacombina-tion along the ancient collision between Pre-cambrian blocks, Mesozoic extension and thermomechanical erosion/mantle dragging by sublithospheric flow.
6 Conclusions
Figure 7.Comparison between fast axis of symmetry recorded by SKS waves (red lines) and k=2 harmonics (green lines). SKS-splitting results are from Bastow et al. (2011) and Assumpção et al. (2011). Red lines refer to mean fast-axis orientation (line direction) and delay time (line size) beneath the station. When SKS mea-surements provide only null meamea-surements, we display black lines which are in the direction of the back azimuth of the recorded event.
decomposition of receiver functions developed at 39 sta-tions in the region. Our main results include the following: (i) anisotropy within the province is characterized by a hor-izontal to slightly dipping fast axis of symmetry; (ii) con-sistency of anisotropic orientations within the crust and the lithospheric mantle suggest a continuation of surface shear-zones down to lithospheric depths; (iii) fast axes of symmetry are oriented parallel to the main shear zones within the con-tinental interior and subparallel to Mesozoic extension along the passive margins, consistent with a fossil origin inherited from the opening of the South Atlantic Ocean; (iv) large un-certainties in the anisotropy orientation along a northeast– southwest trending line in the center of the province might be
related to complex fossil anisotropic fabrics resulting from a combination of deformation along the ancient collision be-tween Precambrian blocks, Mesozoic extension and thermo-mechanical erosion/mantle dragging by sublithospheric flow identified in an independent tomography study.
Data availability. Raw data can be accessed via either the Rede Sismográfica Brasileira (RSBR) website at http://www.rsbr.gov.br (last access: 20 June 2019), or the Pool de Equipamentos Geofísi-cos do Brasil (PEGBR) website at http://www.pegbr.on.br (last ac-cess: 20 June 2019). The receiver function waveforms utilized in this study can be made available from Jordi Julià upon request (jordi@geofisica.ufrn.br).
Supplement. The supplement related to this article is available online at: https://doi.org/10.5194/se-10-893-2019-supplement.
Author contributions. GL processed the receiver functions and har-monic decomposition, carried out the tectonic interpretation of the results and prepared the paper. JJ provided the dataset utilized in this study, helped with the assessment and tectonic interpretation of the results, and actively contributed to the preparation of the paper.
Competing interests. The authors declare that they have no conflict of interest.
Special issue statement. This article is part of the special issue “Advances in seismic imaging across the scales”. It is a result of the 14th International Symposium on Deep Seismic Profiling of the Continents and their Margins, Cracow, Poland, 17–22 June 2018. OR This article is part of the special issue “Advances in seismic imaging across the scales”. It is not associated with a con-ference.
Acknowledgements. We used the GMT v.5.4 open-source toolbox (Wessel et al., 2013) to produce the figures. Thanks are due to Nicola Piana Agostinetti for constructive discussions regarding the harmonic decomposition method and to Andrea Tommasi for in-teresting debates on the tectonics of northeast Brazil. Jordi Julià thanks the Conselho Nacional de Desenvolvimento Científico e Tecnológico (CNPq) for his research fellowship (CNPq, process no. 304421/2015-4).
French government under the “Investissements d’Avenir” program, and by a grant from the Regional Council of Brittany (SAD pro-gramme).
Review statement. This paper was edited by Caroline Beghein and reviewed by two anonymous referees.
References
Almeida, Y., Julià, J., and Frassetto, A.: Crustal architec-ture of the Borborema Province, NE Brazil, from re-ceiver function CCP stacks: Implications for Mesozoic stretching and Cenozoic uplift, Tectonophysics, 649, 68–80, https://doi.org/10.1016/j.tecto.2015.03.001, 2015.
Ammon, C. J.: The isolation of receiver effects from teleseismic P weveforms, B. Seismol. Soc. Am., 81, 2504–2510, 1991. Araújo, C. E. G., Weinberg, R. F., and Cordani, U. G.:
Ex-truding the Borborema Province (NE-Brazil): a two-stage Neoproterozoic collision process, Terra Nova, 26, 157–168, https://doi.org/10.1111/ter.12084, 2014.
Arthaud, M. H., Caby, R., Fuck, R. A., Dantas, E. L., and Parente, C. V.: Geology of the northern Borborema Province, NE Brazil and its correlation with Nigeria, NW Africa, Geological Society, London, Special Publications, 294, 49–67, 2008.
Assine, M. L.: Bacia do Araripe, Boletim de Geociências da PETROBRAS, 15, 371–389, 2007.
Assumpção, M., Feng, M., Mandel, E., Barbosa, J. R., Bianchi, M., van der Lee, S., Marone, F., and van der Meijde, M.: BLSP02: Projeto de estudo sismologico da crosta e manto superior no Brasil, in: Simposio Regional da Sociedad Brasileira de Ge-ofisica, Sao Paulo, Brazil, 2004.
Assumpção, M., Guarido, M., Lee, S. V. D., and Dourado, J. C.: Upper-mantle seismic anisotropy from SKS splitting in the South American stable platform: A test of asthenospheric flow models beneath the lithosphere, Lithosphere, 3, 173–180, https://doi.org/10.1130/L99.1, 2011.
Audet, P.: Layered crustal anisotropy around the San Andreas Fault near Parkfield, California, J. Geophys. Res.-Sol. Ea., 120, 3527– 3543, https://doi.org/10.1002/2014JB011821, 2015.
Bastow, I., Julia, J., Nascimento, A., Fuck, R., and Buck-thorp, T.: Upper mantle anisotropy of the Borborema Province, NE Brazil: Implications for intra-plate deformation and sub-cratonic asthenospheric flow, Tectonophysics, 657, 81–93, https://doi.org/10.1016/j.tecto.2015.06.024, 2015.
Bastow, I. D., Thompson, D. A., Wookey, J., Kendall, J. M., Helffrich, G., Snyder, D. B., Eaton, D. W., and Dar-byshire, F. A.: Precambrian plate tectonics: Seismic evidence from Northern Hudson Bay, Canada, Geology, 39, 91–94, https://doi.org/10.1130/G31396.1, 2011.
Bianchi, I., Park, J., Piana Agostinetti, N., and Levin, V.: Mapping seismic anisotropy using harmonic decompo-sition of receiver functions: An application to North-ern Apennines, Italy, J. Geophys. Res., 115, B12317, https://doi.org/10.1029/2009JB007061, 2010.
Cordani, U. G., D’Agrella-Filho, M. S., Brito-Neves, B. B., and Trindade, R. I. F.: Tearing up Rodinia: The neopro-terozoic palaeogeography of South American cratonic
frag-ments, Terra Nova, 15, 350–359, https://doi.org/10.1046/j.1365-3121.2003.00506.x, 2003.
Cossette, E., Audet, P., Schneider, D., and Grasemann, B.: Structure and anisotropy of the crust in the Cyclades, Greece, using receiver functions constrained by in situ rock textural data, J. Geophys. Res.-Sol. Ea., 121, 2661–2678, https://doi.org/10.1002/2015JB012460, 2016.
da Nóbrega, M. A., Sá, J. M., Bezerra, F. H. R., Hadler Neto, J. C., Lunes, P. J., Guedes, S., Tello Saenz, C. A., Hackspacher, P. C., and Lima-Filho, F. P.: The use of apatite fission track thermochronology to constrain fault movements and sedimentary basin evolution in northeastern Brazil, Rad. Meas., 39, 627–633, 2005.
de Matos, R. M. D.: The Northeast Brazilian Rift System, Tectonics, 11, 766–791, 1992.
de Oliveira, R. G. and Medeiros, W. E.: Evidences of buried loads in the base of the crust of Borborema Plateau (NE Brazil) from Bouguer admittance estimates, J. S. Am. Earth Sci., 37, 60–76, https://doi.org/10.1016/j.jsames.2012.02.004, 2012.
Dias, R. C., Julià, J., and Schimmel, M.: Rayleigh-Wave, Group-Velocity Tomography of the Borborema Province, NE Brazil, from Ambient Seismic Noise, Pure Appl. Geophys., 172, 1429– 1449, https://doi.org/10.1007/s00024-014-0982-9, 2014. Dueker, K. G. and Sheehan, A. F.: Mantle discontinuity
struc-ture from midpoint stacks of converted P to S waves across the Yellowstone hotspot track, J. Geophys. Res., 102, 8313, https://doi.org/10.1029/96JB03857, 1997.
Garcia, X., Julià, J., Nemocón, A. M., and Neukirch, M.: Lithospheric thinning under the Araripe Basin (NE Brazil) from a long-period magnetotelluric survey: Constraints for tectonic inversion, Gondwana Res., 68, 174–184, https://doi.org/10.1016/j.gr.2018.11.013, 2019.
Jardim de Sá, E. F., Macedo, M. H. F., Fuck, R. A., and Kawashita, K.: Terrenos proterozóicos na Província Borborema e a margem norte do Cráton São Francisco, Revista Brasileira de Geociên-cias, 22, 472–480, 1992.
Kennett, B. L. N., Engdah, E. R., and Buland, R.: Constraints on seismic velocities in the Earth from traveltimes, Geophys. J. Int., 122, 108–124, 1995.
Kirkpatrick, J. D., Bezerra, F. H. R., Shipton, Z. K., do Nascimento, A. F., Pytharouli, S. I., Lunn, R. J., and Soden, A. M.: Scale-dependent influence of pre-existing basement shear zones on rift faulting: a case study from NE Brazil, J. Geol. Soc., 170, 237– 247, https://doi.org/10.1144/jgs2012-043, 2013.
Knesel, K. M., Souza, Z. S., Vasconcelos, P. M., Cohen, B. E., and Silveira, F. V.: Young volcanism in the Borborema Province, NE Brazil, shows no evidence for a trace of the Fernando de Noronha plume on the continent, Earth Planet. Sc. Lett., 302, 38–50, https://doi.org/10.1016/j.epsl.2010.11.036, 2011. Langston, C. A.: Corvallis, Oregon, Crustal and upper mantle
re-ceiver structure from teleseismic P and S waves, B. Seismol. Soc. Am., 67, 713–724, 1977.
Langston, C. A.: Structure Under Mount Rainier, washington, Inf-fered from Teleseismic Body Waves, J. Geophys. Res., 84, 4749– 4762, 1979.
Levin, V., Okaya, D., and Park, J.: Shear wave birefringence in wedge-shaped anisotropic regions, Geophys. J. Int., 168, 275– 286, https://doi.org/10.1111/j.1365-246X.2006.03224.x, 2007. Licciardi, A. and Piana Agostinetti, N.: A semi-automated method
for the detection of seismic anisotropy at depth via re-ceiver function analysis, Geophys. J. Int., 205, 1589–1612, https://doi.org/10.1093/gji/ggw091, 2016.
Ligorria, P. and Ammon, C. J.: Iterative Deconvolution and Receiver-Function Estimation, B. Seismol. Soc. Am., 89, 1395– 1400, 1999.
Lima Neto, H. C., Ferreira, J. M., Bezerra, F. H. R., As-sumpção, M. S., do Nascimento, A. F., Sousa, M. O., and Menezes, E.: Upper crustal earthquake swarms in São Cae-tano: Reactivation of the Pernambuco shear zone and trend-ing branches in intraplate Brazil, Tectonophysics, 608, 804–811, https://doi.org/10.1016/j.tecto.2013.08.001, 2013.
Luz, R. M. N., Julià, J., and Nascimento, A. F.: Bulk crustal properties of the Borborema Province, NE Brazil, from P-wave receiver functions: Implications for models of in-traplate Cenozoic uplift, Tectonophysics, 644–645, 81–91, https://doi.org/10.1016/j.tecto.2014.12.017, 2015a.
Luz, R. M. N., Julià, J., and Nascimento, A. F.: Crustal structure of the eastern Borborema Province, NE Brazil, from the joint in-version of receiver functions and surface-wave dispersion: Impli-cations for plateau uplift, J. Geophys. Res.-Sol. Ea., 120, 3848– 3869, https://doi.org/10.1002/2015JB011872, 2015b.
Mainprice, D. and Nicolas, A.: Development of shape and lattice preferred orientations: application to the seismic anisotropy of the lower crust, J. Struct. Geol., 11, 175–189, https://doi.org/10.1016/0191-8141(89)90042-4, 1989.
Mainprice, D., Barruol, G., and IsmaïL, W. B.: The Seis-mic Anisotropy of the Earth’s Mantle: from Single Crys-tal to PolycrysCrys-tal, Earth’s Deep Interior: Mineral Physics and Tomography From the Atomic to the Global Scale, https://doi.org/10.1029/GM117p0237, American Geophysical Union, 2000.
Marques, F. O., Nogueira, F. C. C., Bezerra, F. H. R., and de Cas-tro, D. L.: The Araripe Basin in NE Brazil: An intracontinental graben inverted to a high-standing horst, Tectonophysics, 630, 251–264, https://doi.org/10.1016/j.tecto.2014.05.029, 2014. Maupin, V. and Park, J.: Seismology and Structure of the Earth:
Theory and Observations – Wave propagation in anisotropic me-dia, in: Treatise on Geophysics, Elsevier, Oxford, 289–321, 2007. Mizusaki, A., Thomaz-Filho, A., Milani, E., and de Césero, P.: Mesozoic and Cenozoic igneous activity and its tectonic control in northeastern Brazil, J. S. Am. Earth Sci., 15, 183–198, 2002. Montagner, J.-P. and Kennett, B. L. N.: How to reconcile body-wave
and normal-mode reference earth models, Geophys. J. Int., 125, 229–248, https://doi.org/10.1111/j.1365-246X.1996.tb06548.x, 1996.
Morais Neto, J. M., Hegarty, K. A., Karner, G. D., and Alk-mim, F. F.: Timing and mechanisms for the generation and modification of the anomalous topography of the Borborema Province, northeastern Brazil, Mar. Petrol. Geol., 26, 1070–1086, https://doi.org/10.1016/j.marpetgeo.2008.07.002, 2009. Moulin, M., Aslanian, D., and Unternehr, P.: A new starting point
for the South and Equatorial Atlantic Ocean, Earth-Sci. Rev., 98, 1–37, https://doi.org/10.1016/j.earscirev.2009.08.001, 2010.
Neves, S. P.: Proterozoic history of the Borborema province (NE Brazil): Correlations with neighboring cratons and Pan-African belts and implications for the evolution of western Gondwana, Tectonics, 22, 1031, https://doi.org/10.1029/2001TC001352, 2003.
Neves, S. P., Vauchez, A., and Feraud, G.: Tectono-thermal evolu-tion, magma emplacement, and shear zone development in the Caruaru area (Borborema Province, NE Brazil), Precambrian Res., 99, 1–32, https://doi.org/10.1016/S0301-9268(99)00026-1, 2000.
Nicolas, A. and Christensen, N. I.: Formation of Anisotropy in Upper Mantle Peridotites – A Review, in: Composition, Structure and Dynamics of the Lithosphere-Asthenosphere System, American Geophysical Union (AGU), 111–123, https://doi.org/10.1029/GD016p0111, 1987.
Nogueira, F. C. C., Marques, F. O., Bezerra, F. H. R., de Castro, D. L., and Fuck, R. A.: Cretaceous intracontinental rifting and post-rift inversion in NE Brazil: Insights from the Rio do Peixe Basin, Tectonophysics, 644–645, 92–107, 2015.
Peulvast, J.-P. and Bétard, F.: A history of basin inver-sion, scarp retreat and shallow denudation: The Araripe basin as a keystone for understanding long-term land-scape evolution in NE Brazil, Geomorphology, 233, 20–40, https://doi.org/10.1016/j.geomorph.2014.10.009, 2015. Piana Agostinetti, N. and Miller, M. S.: The fate of the
downgoing oceanic plate: Insight from the Northern Casca-dia subduction zone, Earth Planet. Sc. Lett., 408, 237–251, https://doi.org/10.1016/j.epsl.2014.10.016, 2014.
Piana Agostinetti, N., Bianchi, I., Amato, A., and Chiarabba, C.: Fluid migration in continental subduction: The Northern Apennines case study, Earth Planet. Sc. Lett., 302, 267–278, https://doi.org/10.1016/j.epsl.2010.10.039, 2011.
Pinheiro, A. G. and Julia, J.: Normal thickness of the upper mantle transition zone in NE Brazil does not favour mantle plumes as origin for intraplate Cenozoic volcanism, Geophys. J. Int., 199, 996–1005, https://doi.org/10.1093/gji/ggu281, 2014.
Santos, A. C., Padilha, A. L., Fuck, R. A., Pires, A. C., Vi-torello, I., and Pádua, M. B.: Deep structure of a stretched lithosphere: Magnetotelluric imaging of the southeastern Bor-borema province, NE Brazil, Tectonophysics, 610, 39–50, https://doi.org/10.1016/j.tecto.2013.10.008, 2014.
Shiomi, K. and Park, J.: Structural features of the subducting slab beneath the Kii Peninsula, central Japan: Seismic evidence of slab segmentation, dehydration, and anisotropy, J. Geophys. Res.-Sol. Ea., 113, 1–13, https://doi.org/10.1029/2007JB005535, 2008.
Silver, P. G.: Seismic anisotropy beneath the continents : Probing the Depths of Geology, Annu. Rev. Earth Planet. Sci., 24, 385– 432, 1996.
Simões Neto, F. L., Julià, J., and Schimmel, M.: Upper-mantle structure of the Borborema Province, NE Brazil, from P-wave tomography: implications for rheology and volcanism, Geophys. J. Int., 216, 231–250, https://doi.org/10.1093/gji/ggy421, 2019. Tarayoun, A., Audet, P., Mazzotti, S., and Ashoori, A.:
Tommasi, A. and Vauchez, A.: Continental rifting parallel to ancient collisional belts : an effect of the mechanical anisotropy of the lithospheric mantle, Earth Planet. Sc. Lett., 185, 199–210, 2001. Tommasi, A., Vauchez, A., and Daudré, B.: Initiation and propaga-tion of shear zones in a heterogeneous continental lithosphere, J. Geophys. Res., 100, 22083–22101, 1995.
Van Schmus, W. R., Kozuch, M., and de Brito Neves, B. B.: Precambrian history of the Zona Transversal of the Bor-borema Province, NE Brazil: Insights from Sm-Nd and U-Pb geochronology, J. S. Am. Earth Sci., 31, 227–252, https://doi.org/10.1016/j.jsames.2011.02.010, 2011.
Vauchez, A. and da Silva, M. E.: Termination of a continenta-scale strike-slip fault in partially melted crust: The West Pernambuco shear zone, northeast Brazil, Ge-ology, 20, 1007–1010, https://doi.org/10.1130/0091-7613(1992)020<1007:TOACSS>2.3.CO;2, 1992.
Vauchez, A., Neves, S., Caby, R., Corsini, M., Egydio-Silva, M., Arthaud, M., and Amaro, V.: The Borborema shear zone system, NE Brazil, J. S. Am. Earth Sci., 8, 247–266, https://doi.org/10.1016/0895-9811(95)00012-5, 1995.
Vauchez, A., Tommasi, A., and Mainprice, D.: Faults (shear zones) in the Earth’s mantle, Tectonophysics, 558–559, 1–27, https://doi.org/10.1016/j.tecto.2012.06.006, 2012.