https://doi.org/10.5194/dwes-11-1-2018
© Author(s) 2018. This work is distributed under the Creative Commons Attribution 4.0 License.
Optimum coagulant forecasting by modeling jar test
experiments using ANNs
Sadaf Haghiri1, Amin Daghighi2,3, and Sina Moharramzadeh4
1Department of Environmental Engineering, Middle East Technical University, Ankara, Turkey
2Department of Civil Engineering, College of Engineering, University of Texas at Arlington,
Arlington, Texas, USA
3Consultant engineer at Daneshkar Ahwaz Company, Tehran, Iran
4Department of Civil, Construction and Environmental Engineering, Iowa State University, Ames, Iowa, USA
Correspondence:Amin Daghighi ([email protected])
Received: 3 July 2017 – Discussion started: 5 September 2017
Revised: 20 December 2017 – Accepted: 21 December 2017 – Published: 29 January 2018
Abstract. Currently, the proper utilization of water treatment plants and optimizing their use is of particular importance. Coagulation and flocculation in water treatment are the common ways through which the use of coagulants leads to instability of particles and the formation of larger and heavier particles, resulting in improve-ment of sediimprove-mentation and filtration processes. Determination of the optimum dose of such a coagulant is of particular significance. A high dose, in addition to adding costs, can cause the sediment to remain in the filtrate, a dangerous condition according to the standards, while a sub-adequate dose of coagulants can result in the re-ducing the required quality and acceptable performance of the coagulation process. Although jar tests are used for testing coagulants, such experiments face many constraints with respect to evaluating the results produced by sudden changes in input water because of their significant costs, long time requirements, and complex rela-tionships among the many factors (turbidity, temperature, pH, alkalinity, etc.) that can influence the efficiency of coagulant and test results. Modeling can be used to overcome these limitations; in this research study, an artificial neural network (ANN) multi-layer perceptron (MLP) with one hidden layer has been used for modeling the jar test to determine the dosage level of used coagulant in water treatment processes. The data contained in this research have been obtained from the drinking water treatment plant located in Ardabil province in Iran. To evaluate the performance of the model, the mean squared error (MSE) and correlation coefficient (R2) parame-ters have been used. The obtained values are within an acceptable range that demonstrates the high accuracy of the models with respect to the estimation of water-quality characteristics and the optimal dosages of coagulants; so using these models will allow operators to not only reduce costs and time taken to perform experimental jar tests but also to predict a proper dosage for coagulant amounts and to project the quality of the output water under real conditions.
1 Introduction
Due to the rapid economic development as a result of pop-ulation growth, the scarcity of water resources has been a serious issue for many decades. As a result, this has become a pressing issue in formulating sustainable development poli-cies (Daghighi et al., 2017). Water treatment plant operations means decreasing the final price of the produced water in a way that achieves an optimum combination of efficiency and
affectivity (Ng et al., 2016). The aim of this study is to un-derstand the management of chemical substances to decrease the final cost of water, in which, for very similar inputs, the amount of coagulating chemicals required to decrease water turbidity is determined.
along with water sterilization to ensure water clarity; other-wise the refined water is in no way usable for drinking pur-poses (Ndabigengesere et al., 1995). Materials called coagu-lants are used to decrease water turbidity, with the required amount depending on the environmental conditions (Nord-mark et al., 2016) such as temperature, pH, the amount and type of turbidity, etc. The required amount is usually deter-mined by performing an experiment called a jar test. Since these experiments are time-consuming and also have errors, they do not always provide a correct estimate of the opti-mum amount of coagulant, and they may increase the cost of chemicals used and diminish the management capability of the treatment plants to appropriately decrease the chemical requirements (Shamsnejati et al., 2015). Therefore, propos-ing new models for estimatpropos-ing the optimum amount of co-agulant seems an appropriate way to alleviate costs and gen-erally improve the health of drinking water (Lamrini et al., 2005).
Most particles that cause water to become opaque have the feature of hydrophobicity and are often settled by sim-ple gravitational force as time passes, but there may be some smaller particles that cause water color such as hydro oxides (known as colloids) or acids such as humic acid and folic acid that are organic acids. These are all hydrophilic and tend to not settled. Bacteria are also colloidal particles and are not separated in the basic coagulation phase (Franceschi et al., 2002).
Modeling is an important math-based tool typically per-formed in one of the following ways:
– numeric or deterministic methods
– data-driven methods
Data-driven techniques have been receiving considerable attention in the field of process monitoring due to their easy implementation and less requirements for the underlying model (Yin et al., 2016). Deterministic data-driven methods are divided into classical statistical (multi-variable regres-sion) and machine learning. Although conventional modeling has been used to describe biological procedures, it has been based on writing the equations for the speed of growth of the microorganisms, the consumption of the substrate, and the forming of the product, because microbiological reactions are non-linear and time dependent with a rather complicated nature, such models have many restrictions. The structure of data-driven models is often simpler than that of deterministic models and they provide a more general view of the nature of the issue that recognize the applicable relationships be-tween the efficient parameters as a necessary part of the prob-lem. Also, in gaining knowledge of the relationships between the parts of the model, a need arises for solving complicated equations, and in some situations the answers cannot be ob-tained under general conditions. Thus, numerical methods will not be used in this study. In the linear multiple-variable regression model, there are a great many assumptions, and
using them all in practical problems causes issues. In per-forming research, because these assumptions represent com-plex statistical issues, they many be hidden from researchers’ eyes and not taken seriously (Hornik, 1993). The proposed model would not have the required accuracy, so these types of models cannot be used in problems demanding high accu-racy (Homada and Al-Ghusian, 1999).
Artificial neural networks (ANNs) are one of the machine learning methods used in many scientific fields today. An ANN is a machine learning method able to anticipate non-linear and complex relationships between inputs and outputs, and is often used to replace linear multiple-variable regres-sions. ANNs are a set of non-linear techniques that do not require the choice of a pre-determined mathematical model, because the relationships between input and output variables are automatically set by the utilized algorithm, so ANNs can be a good choice for solving those problems in which cer-tain relationships between the variables are either not known or describing them would be difficult. The ANN was first proposed by McCulloch and Pitts in 1943 (McCulloch and Pitts, 1943) and ANNs have already been successfully used to model salinity, nutrient concentrations, air pollution, and algal growth (Maier and Dandy, 2001; Daghighi, 2017).
Despite using a very simple structure, its speed and the power of the calculation was strongly noted. The regular ar-chitecture of ANNs consist of three layers: the input layer (distributes the data sent into the network), the hidden layer (processes the data), and the output layer (extracts the results as per certain inputs). A network can have several hidden lay-ers.
Theoretical tasks performed in the field have shown that a hidden layer for these models can approximate virtually any complicated and non-linear function (Maier and Dandy, 2005; Cybenko, 1989; Hornik et al., 1989), as proven by ex-perimental and practical results (Homada and Al-Ghusian, 1999; Oliveira-Esquerre et al., 2002).
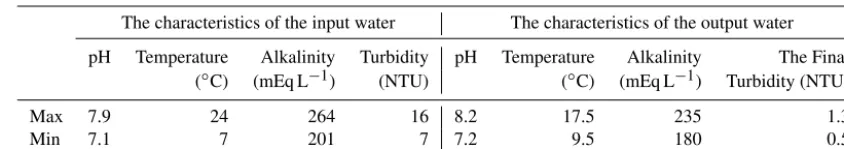
Table 1.Ranges of available data. NTU represents nephelometric turbidity units.
The characteristics of the input water The characteristics of the output water pH Temperature Alkalinity Turbidity pH Temperature Alkalinity The Final
(◦C) (mEq L−1) (NTU) (◦C) (mEq L−1) Turbidity (NTU) Max 7.9 24 264 16 8.2 17.5 235 1.3
Min 7.1 7 201 7 7.2 9.5 180 0.5
the ANN produces better and more accurate results than the situation of considering them separately (Oliveira-Esquerre et al., 2002), so this study will use the same method (Zhang and Stanley, 1999; Baxter et al., 1999) by using the multi-layer perceptron (MLP) structure for the ANN for anticipat-ing the turbidity and the color of the refined water at the Rossdale Water Treatment plant in Alberta, Canada. Gagnon et al. (1997) used the method of inverse models in ANNs, a similar method, for anticipating the necessary amount of alum for the Sainte-Foy Waste Water Treatment Plant in Que-bec, Canada (Joo et al., 2000). Modeling has also been per-formed for the Chungju Wastewater Treatment Plant in Ko-rea. Van Leeuwen prepared an ANN model based on the jar test procedure for use on the collected surface waters in southern Australia (Van Leeuwen et al., 1999). In the studies mentioned, because of the lack of proper output parameters, the ruling equations of the prepared models were not able to adapt themselves to output variable changes.
Zhang and Stanley (1999) added the refined water turbid-ity factor as an input parameter to the water characteristic pa-rameters in their ANN for anticipating the optimum amount of alum for use in the Rossdale Water Treatment Plant. Yu did the same for the Taipei water treatment plant in Taiwan by applying a greater number of parameters, preparing his three ANN models for anticipating the proper amount of alum nec-essary for coagulation (Yu et al., 2000). According to the studied background, this method can be used for anticipating the proper amount of coagulant that in this research will be determined using the data from the Ardabil province drink-ing water treatment plant and for determindrink-ing the available effective factors in the ANN, including the error percentage that can be passed up, the amount of experimental expenses, and the time needed for performing the jar test, all of which can be reduced by preparing the model and using the results. Modeling by the use of ANNs reduces test time and cost, and decreases the necessity of performing experiments cur-rently being performed in the drinking water treatment plant of Ardabil province. In addition, there is no need to know the type of input and output parameters or the quality of perform-ing the process. By only providperform-ing the data to the program in numeric form, the determined answer is obtained along with all the effective factors on the process (which in this project are the temperature, pH, the degree of alkalinity, and the turbidity; according to the accessible data of the treatment plant). The factors are hidden in the data and the ANN has
the capability to recognize complex and unknown systems. Thus, in this research, the following aims are being studied: to anticipate the optimum amount of coagulant, to analyze the collected data, to determine the best type of ANN for the purpose of modeling with the lowest error, to determine the optimum amount of coagulant in the process of coagulation and flocculation, and to validate the operation of the devel-oped models.
Using this model would allow the operators of a water treatment plant to avoid time and cost wastage, and decrease the need to perform some of the experiments that are cur-rently being performed in the drinking water treatment plant of Ardabil.
2 Methodology
2.1 Data
The available data related to the drinking water treatment plant in Ardabil province have been collected over 2 years and the data ranges are presented in Table 1.
2.2 Data division and pre-processing
R² = 0.853
7.3 7.4 7.5 7.6 7.7 7.8 7.9 8 8.1 8.2
7.2 7.4 7.6 7.8 8 8.2
P
re
dict
ed
pH
Actual pH (a)
R² = 0.9942
170 180 190 200 210 220 230 240
170 190 230 250
Predicted
a
lkalinity
210 Actual alkalinity
(b)
R² = 0.9
0 0.2 0.4 0.6 0.8 1 1.2 1.4
0 0.5 1 1.5
Predicted
t
urbidity
Actual turbidity (c)
R² = 0.9323
11.5 12 12.5 13 13.5 14 14.5
11.5 12 12.5 13 13.5 14 14.5
Predicted
t
emp
.
Actual temperature (d)
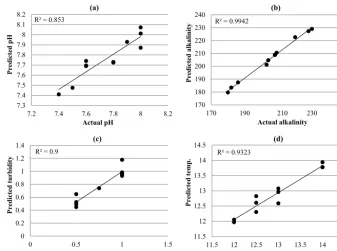
Figure 1.Scatter plots of actual versus predicted values for the validation data obtained using model 1(a)Actual pH,(b)Actual Alkalinity,
(c)Actual Turbidity, and(d)Actual Temperature.
Table 2.Models inputs and outputs.
The characteristics of the input water The characteristics of the output water Alum dose pH Temperature Alkalinity Turbidity pH Temperature Alkalinity The Final
Turbidity
Mod 1 I I I I O O O O I
Mod 2 I I I I I I I I O
The use of this method has resulted in 80, 10, and 10 % of points in the training, testing, and validation, respectively.
For data standardization and also to increase the accuracy and decrease the error (in both prepared models), all data were normalized before being entered into the model using the normal distribution function:
z=(x−x)
SD , (1)
in whichxis the primary amount,xis the average of the data, and SD is the standard deviation.
2.3 Choice of model inputs
2.3.1 Model 1 – prediction of treated water-quality parameters
The model for anticipating the quality of the output water was first prepared. In this model, after normalizing the in-put data (turbidity, alkalinity, temperature, and pH), an MLP ANN with one hidden layer and 15 neurons (produced by
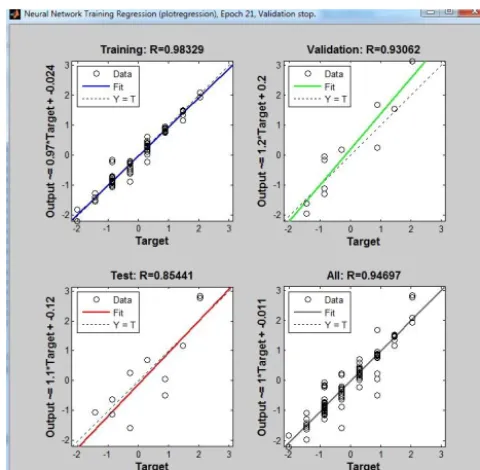
Figure 2.Comparing the coagulant dose real data with predicted data in 3 steps and in form of general.
validation group (also about 10 % of all data) that studies the capability of the network after its training. Training occurs up to the time at which the error related to the monitoring data group decreases, at which point the training is stopped. By using this method, also called the stop training algorithm, use of more complicated architectures in designing the network is provided to the operator without having any over-fitting problem, and by using some of the factors happening while the problem is in the network. The standards mentioned play an important role in this method (Standard Methods, 1998). Figure. 1a–d are related to the data validation that have been prepared by calculating the error of the model and analyz-ing the amount of difference between the real data and the anticipated data reached using 10 % of the data.
2.3.2 Model 2 – prediction of optimal dose (process inverse model)
Model 2, representing the goal of this research, anticipates the amount of necessary coagulant according to the input characteristics of the input water and the desired standard wa-ter characwa-teristics. In this model, afwa-ter normalizing the input data, an MLP ANN with one hidden layer and 16 neurons (produced by trial and errors) was used. In this part, accord-ing to the real inputs taken from the water treatment plant, the final model was built, and the necessary pure input water and the output water characteristics are given to the model, with the amount of the necessary coagulant is given as the output. Table 2 demonstrates the inputs of both models.
Figure 3.Related figure for learning model No. 2 and validation of model.
Figure 4.The graphical user interface (GUI) of the Model No. 1
3 Results and discussions
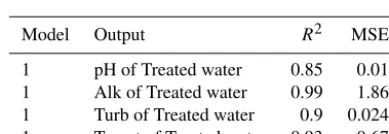
The results produced by using Model 1 (related to pH, al-kalinity, temperature, and turbidity) are shown in Fig. 1a–d, with the relatedR2 and mean squared error (MSE) shown in Table 3 for the 112 data points. The model has accom-plished reasonable accuracy in predicting all three parame-ters of the treated water quality, theR2values from 0.94 for anticipating the amount of alkalinity and 0.85 for anticipat-ing the pH. The mean square errors for the prediction of tur-bidity (measured in nephelometric turtur-bidity units, NTU) are also relatively small (errors of 0.011 NTU, 0.01 pH, 0.67◦C and 26.31 mg L−1).
predict-Figure 5.The Graphical User Interface (GUI) of the Model No. 2.
Table 3.The Results of the Neural Model No .1.
Model Output R2 MSE 1 pH of Treated water 0.85 0.01 1 Alk of Treated water 0.99 1.86 1 Turb of Treated water 0.9 0.024 1 Tempt of Treated water 0.93 0.67
ing the amount of the residual aluminum of the treated water with anR2of 0.93 and a MSE of 0.37 mg L−1.
Finally, a user-friendly model has been prepared for use by the operator. The prepared software is a graphical user in-terface (GUI) generated by the MATLAB software. Figure 4 illustrates how the operator can observe the results related to output water quality by entering the input water data and the amount of coagulant in Model 1.
Also for Model 2, another user-friendly GUI was pro-grammed containing various parameters such as pH, alkalin-ity, temperature, and turbidity for both raw and treated water. After having all input data, the optimum coagulant dosage result is given, as shown in Fig. 5.
4 Conclusions
In this research, the simulation of the jar experiment in the flocculation and coagulation unit at the Ardabil province drinking water treatment plant have been studied using, for the first time, an ANN of type MLP. Using this method, two models were created to enable presentation of water-quality characteristics after coagulation and flocculation and anticipating the optimum amount of the coagulant related to changing characteristics of the input water in the minimum possible time and by the highest accuracy.
By choosing effective parameters in the jar test, some pa-rameters such as the color and hydraulic papa-rameters like the clarifier overflow rate have been taken into consideration, in
Table 4.The Results of the ANN No. 2.
Model Output R2 MSE 2 Training Coagulant dose 0.98 0.09 2 Validation Coagulant dose 0.93 0.37 2 Test Coagulant dose 0.85 0.48 2 All Coagulant dose 0.95 0.12
addition to the parameters considered in this research (tem-perature, pH, turbidity, and the amount of coagulant). As in previous studies (because of not measuring the number of parameters listed and not recording related data, and also be-cause of the relatively small effect they have in comparison to the considered parameters), we were not able to apply their effects. Of course the considered parameters are among the most important effective parameters and because extending all the effective parameters in a single experiment was not feasible, it is possible to consider the prepared model for the results of this experiment as a good approximation.
Because the ANN model is a parametric method, if the amount of recorded data is increased, the model accuracy will increase. In this study, there were 112 recorded data points used over a 2-year period, that included data related to the input (pure) water, the output water, and the proper amount of coagulant. Because of the absence of high rate changes among the data and the absence of outlier data, there was no need to prepare, analyze, and select the data. Since the used components have different units and dimensions, they cannot be compared in terms of average and standard devia-tion, so they have been normalized. The training of the model has performed well according to analysis of existing errors, so the most prominent and the only weak point is access to only a small amount of recorded data.
with a greater amount of recorded data related to the jar ex-periment.
Data availability. All data are available on the website of Ard-abil’s Water and Waste Water Company (2018). All data are pub-licly accessible and are reported in the Persian language in separate tables for all years since 1 January 1991.
Competing interests. The authors declare that they have no con-flict of interest.
Acknowledgements. Great thanks to Naser Mehrdadi, Water Institute of the University of Tehran. This study was supported by the Daneshkar Ahwaz Company.
Edited by: Ran Shang
Reviewed by: Stephen Mounce and two anonymous referees
References
Ardabil’s Water and Waste Water Company: The char-acteristics of the input and output water, available at: http://www.abfa-ardabil.co.ir/HomePage.aspx?lang= en-US&site=DouranPortal&tabid=1, last access: 24 January 2018.
Baxter, C. W., Stanley, S. J., and Zhang, Q.: Development of a full scale artificial neural network model for the removal of natu-ral organic matter by enhanced coagulation, Aqua, 48, 129–136, 1999.
Bowden, G. J., Maier, H. R., and Dandy, G. G.: Optimal division of data for neural network models in water resources applications, Water Resour. Res., 38, 2-1–2-11, 2002.
Bui, H. M., Perng, Y. S., and Duong, H. G. T.: The use of artificial neural network for modeling coagulation of reactive dye wastew-ater using Cassia fistula Linn. (CF) gum, J. Environ. Sci. Manag., 19, 1–8, 2016.
Cybenko, G.: Approximation by Superpositions of a Sigmoidal Function Math, Control Signals Systems, 2, 303–314, 1989. Daghighi, A.: Harmful Algae Bloom Prediction Model for Western
Lake Erie Using Stepwise Multiple Regression and Genetic Pro-gramming, Electronic Thesis, available at: https://etd.ohiolink. edu/ (last access: 24 January 2018), 2017.
Daghighi, A., Nahvi, A., and Kim, U.: Optimal Cultivation Pattern to Increase Revenue and Reduce Water Use: Application of Lin-ear Programming to Arjan Plain in Fars Province, Agriculture, 7, 73, https://doi.org/10.3390/agriculture7090073, 2017.
Franceschi, M., Girou, A., Carro-Diaz, A., Maurette, M., and Puech-Costes, E.: Optimization of the coagulation-flocculation process of raw water by optimal design method, Water Res., 36, 3561–3572, 2002.
Gagnon, C., Grandjean, B. P. A., and Thibault, J.: Modelling of co-agulant dosage in a water treatment plant, Artif. Intell. Eng., 11, 401–404, 1997.
Homada, M. F. and Al-Ghusian, I. A.: Integrated Wastewater Treat-ment Plant Performance Evaluation Using Artificial Neural Net-works, Water. Sci. Tech., 40, 55–65, 1999.
Hornik, K.: Some new results on neural network approximation, Neural Networks, 6, 1069–1072, 1993.
Hornik, K., Stinchcombe, M., and White, H.: Multilayer feed for-ward networks are universal approximators, Neural Networks, 2, 359–366, 1989.
Joo, D. S., Choi, D. J., and Park, H.: The effects of data preprocess-ing in the determination of coagulant dospreprocess-ing rate, Water Res., 34, 3295–3302, 2000.
Kohonen, T.: Self-organized formation of topologically correct fea-ture maps, Biol. Cybern., 43, 59–69, 1982.
Lamrini, B., Benhammou, A., Karama, A., and Le-Lann, M.: Drink-ing water treatment: a neural network Model for coagulation dosing, Adaptive an natural computing algorithms, 96–99, avail-able at: http://scholar.googleusercontent.com/scholar?q=cache: ZkCaWuaybpkJ:scholar.google.com/+DRINKING+WATER+ TREATMENT:+A+NEURAL+NETWORK+MODEL+FOR+ COAGULATION+DOSING+DOI&hl=en&as_sdt=0,44&as_ vis=1 (last access: 24 January 2018), 2005.
Maier, H. R. and Dandy, G. C.: Neural networks for the prediction and forecasting of water resources variables: a review of mod-eling issues and applications, Environ. Modell. Softw., 15, 101– 124, 2000.
Maier, H. R. and Dandy, G. C.: Neural network based modelling of environmental variables: a systematic approach, Math. Comput. Model., 33, 669–682, 2001.
Maier, H. R. and Dandy, G. C.: Input determination for neural net-work models in water resources applications, J. Hydrol., 301, 75– 92, 2005.
McCulloch, W. S. and Pitts, W.: A logical calculus of the ideas im-manent in nervous activity, B. Math. Biophys., 5, 115–133, 1943. Nahvi, A., Daghighi, A., and Nazif, S.: The Environmental Impact Assessment of Drainage Systems: A Case Study of the Karun River Sugarcane Development Project, Arch. Agron. Soil Sci., 64, 185–195, https://doi.org/10.1080/03650340.2017.1340641, 2018.
Ndabigengesere, A., Narasiah, K. S., and Talbot, B. G.: Active agents and mechanism of coagulation of turbid waters using Moringa oleifera, Water Res., 29, 703–710, 1995.
Ng, F., Harding, J. A., and Glass, J.: An eco-approach to optimise efficiency and productivity of a hydraulic excavator, J. Clean. Prod., 112, 3966–3976, 2016.
Nordmark, B. A., Przybycien, T. M., and Tilton, R. D.: Compara-tive coagulation performance study of Moringa oleifera cationic protein fractions with varying water hardness, J. Environ. Chem. Eng., 4, 4690–4698, 2016.
Oliveira-Esquerre, K. P., Mori, M., and Bruns, R. E.: Simulation of an Industrial Wastewater Treatment Plant Using Artificial Neural Networks and Principal Components Analysis, Braz. J. Chem. Eng., 19, 365–370, 2002.
Shamsnejati, S., Chaibakhsh, N., Pendashteh, A. R., and Hay-eripour, S.: Mucilaginous seed of Ocimum basilicum as a natural coagulant for textile wastewater treatment, Ind. Crop. Prod., 69, 40–47, 2015.
Van Leeuwen, J., Chow, C. W. K., Bursill, D., and Drikas, M.: Em-pirical mathematical models and artificial neural networks for the determination of alum doses for treatment of southern Australian surface waters, Aqua, 48, 115–127, 1999.
Yin, S., Wang, G., and Gao, H.: Data-driven process monitoring based on modified orthogonal projections to latent structures, IEEE T. Contr. Syst. T., 24, 1480–1487, 2016.
Yu, R. F., Kang, S. F., Liaw, S. L., and Chen, M. C.: Application of artificial neural network to control the coagulant dosing in water treatment plant, Water Sci. Technol., 42, 403–408, 2000. Zhang, Q. and Stanley, S. J.: Real-time water treatment process