Ocean Sci., 9, 293–300, 2013 www.ocean-sci.net/9/293/2013/ doi:10.5194/os-9-293-2013
© Author(s) 2013. CC Attribution 3.0 License.
EGU Journal Logos (RGB)
Advances in
Geosciences
Open Access
Natural Hazards
and Earth System
Sciences
Open AccessAnnales
Geophysicae
Open AccessNonlinear Processes
in Geophysics
Open AccessAtmospheric
Chemistry
and Physics
Open AccessAtmospheric
Chemistry
and Physics
Open Access DiscussionsAtmospheric
Measurement
Techniques
Open AccessAtmospheric
Measurement
Techniques
Open Access DiscussionsBiogeosciences
Open Access Open Access
Biogeosciences
Discussions
Climate
of the Past
Open Access Open Access
Climate
of the Past
Discussions
Earth System
Dynamics
Open Access Open Access
Earth System
Dynamics
DiscussionsGeoscientific
Instrumentation
Methods and
Data Systems
Open Access
Geoscientific
Instrumentation
Methods and
Data Systems
Open Access DiscussionsGeoscientific
Model Development
Open Access Open Access
Geoscientific
Model Development
DiscussionsHydrology and
Earth System
Sciences
Open AccessHydrology and
Earth System
Sciences
Open Access DiscussionsOcean Science
Open Access Open Access
Ocean Science
DiscussionsSolid Earth
Open Access Open Access
Solid Earth
DiscussionsThe Cryosphere
Open Access Open Access
The Cryosphere
DiscussionsNatural Hazards
and Earth System
Sciences
Open Access
Discussions
Sea level trend and variability in the Singapore Strait
P. Tkalich1, P. Vethamony2, Q.-H. Luu1, and M. T. Babu2
1Tropical Marine Science Institute, National University of Singapore, 14 Kent Ridge Road, 119227, Singapore 2National Institute of Oceanography, Council of Scientific and Industrial Research, Dona Paula, Goa, 403004, India
Correspondence to: P. Tkalich (tmspt@nus.edu.sg)
Received: 16 May 2012 – Published in Ocean Sci. Discuss.: 15 June 2012
Revised: 14 September 2012 – Accepted: 4 February 2013 – Published: 8 March 2013
Abstract. Sea level in the Singapore Strait (SS) exhibits re-sponse to various scale phenomena, from local to global. Longest tide gauge records in SS are analysed to derive lo-cal sea level trend and annual, inter-annual and multi-decadal sea level variability, which then are attributed to regional and global phenomena. Annual data gaps are reconstructed us-ing functions correlatus-ing sea level variability with ENSO. At annual scale, sea level anomalies in SS are (quasi-periodic) monsoon-driven, of the order of±20 cm, the highest during northeast monsoon and the lowest during southwest mon-soon. Interannual regional sea level drops are associated with El Ni˜no events, while the rises are correlated with La Ni˜na episodes; both variations are in the range of±5 cm. At multi-decadal scale, annual measured sea levels in SS are varying with global mean sea level, rising at the rate 1.2–1.7 mm yr−1 for 1975–2009, 1.8–2.3 mm yr−1 for 1984–2009 and 1.9– 4.6 mm yr−1 for 1993–2009. When SS rates are compared with the global trends (2.0, 2.4 and 2.8 mm yr−1, respec-tively) derived from tide gauge measurements for the same periods, they are smaller in the earlier era and considerably larger in the recent one. Taking into account the first estimate of land subsidence rate, 1–1.5 mm yr−1in Singapore, the re-cent trend of absolute sea level rise in SS follows regional tendency.
1 Introduction
The South China Sea (SCS) is the largest semi-enclosed marginal sea in the northwest Pacific Ocean, bounded by 99– 122◦E and 0–25◦N. It consists of a deep basin with two con-tinental shelves along the north and southwest coasts. SCS is connected to the East China Sea through the Taiwan Strait, to the Pacific Ocean through the Luzon Strait, and to the Java
Sea through the Karimata Strait (Fig. 1a). Astronomic tides propagate in the SCS through Luzon Strait, and there are sev-eral amphidromic points in the continental shelves of SCS (Fang et al., 1999; Ko et al., 2008).
Singapore Strait (SS) is situated in the middle of Sunda Shelf, encompassed by SCS and Malacca Strait. SS is con-nected through SCS to the Pacific Ocean on the east, and to the Indian Ocean via the Malacca Strait on the west. Wa-ter transport in SS is in the order of 0.1 to 0.2 Sv from east to west, a minor component of the Indonesian Throughflow (Wannasingha et al., 2003). The water depth of SS ranges between 30 m and 120 m.
It is generally expected that sea level in the Singapore Strait is governed by various scale phenomena, from global to local. Global signals are due to climate change and vari-ability, having a typical temporal scale of the order of decades to centuries. At regional scale, annual and interan-nual sea level variabilities are caused by the Asian mon-soon system, modulated by coupled ocean–atmosphere os-cillations, such as El Ni˜no-Southern Oscillation (ENSO). At local (hourly) scale, sea level elevation is driven by astro-nomic tides distorted by bathymetry gradients.
Table 1. Linear trends of sea level rise (mm yr−1) over selected periods.
Source of record Trend (entire available period) Periods
1975–2009 1984–2009 1993–2009
Global – Tide gauge(1) 1.7±0.2 (1900–2009) 2.0±0.3 2.4±0.4 2.8±0.8 Global – Altimetry 3.1±0.4 (1993–2012)(2) NA(4) NA(4) 3.3±0.4(3) Tanjong Pagar (TP) 3.1±0.8 (1984–2011) NA(4) 2.3±0.9 4.6±1.2 Raffles Lighthouse (RL) 1.8±0.4 (1975–2011) 1.2±0.4 2.1±0.6 3.0±1.3 Sultan Shoal (SH) 2.1±0.4 (1973–2011) 1.7±0.4 2.4±0.7 1.9±1.4 Sembawang (SE) 1.5±0.4 (1973–2011) 1.3±0.4 1.8±0.7 3.9±1.3 Singapore Strait average 2.9±0.6 (1984–2011) NA(4) 2.1±0.6 3.4±1.3
1Church and White (2011);2Nerem et al. (2010);3Nicholls and Cazenave (2010);4not available.
Fig. 1. (a) Study area. (b) The Singapore Strait and its vicinity (bathymetric contours are at 20, 40 and 100 m depths). Black symbols denote the locations of 4 tide gauges, namely Tanjong Pagar, Raffles Lighthouse, Sultan Shoal and Sembawang.
Similar or larger recent MSL rise rates have been observed in the western tropical Pacific, eastern Indian and South-ern Ocean (Carton et al., 2005; Cheng and Qi, 2007; Un-nikrishnan and Shankar, 2007). Church et al. (2004, 2006) have analysed the sea level rise in the region bounded by 40◦S to 40◦N and 30◦E to 120◦W (centered on Sunda Shelf), and found that the average upward trend for the pe-riod 1950 to 2001 was about 2 mm yr−1; in particular, the re-gion encompassing SS the MSL rise during the period 1955– 2003 by Church et al. (2004) is 3.6 mm yr−1, and for the ten year period after 1993 the regional sea level rise rate was about 4 mm yr−1. For the Singapore area, the earlier rate was similar, but the later trend is somewhat higher, centered at 5 mm yr−1. The larger regional trend since 1993 in the tropi-cal Pacific and Indian Oceans has been attributed to consider-able interannual and decadal sea level variability associated, respectively, with the ENSO and the North Pacific Decadal
Oscillation (Trenberth and Hurrell, 1994; Chambers et al., 2002; Church et al., 2004, 2006; and Becker et al., 2011).
likely to be the cause for modulating the inter-annual sea level variability associated with ENSO.
On the Sunda Shelf and particularly in SS, our earlier study (Tkalich et al., 2012) showed that wind over the SCS is arguably the most important factor, which determines the observed annual variability in sea level anomalies (SLAs). SLAs in SS were found to be part of the basin-wide storm surges, of the order of 20 cm, positive during northeast mon-soon and negative during southwest monmon-soon. However, inter-annual and multi-decadal variability of sea level as well as sea level trend in SS are yet to be quantified.
In the present study, tide gauge records and satellite al-timetry are used to analyse long-term sea level signals in the SS. Frequency analysis is performed to filter out astronomic tides from the tide gauge records, and SLAs obtained are cor-related with global MSL as well as regional and global phe-nomena, including ENSO cycle and North Pacific Decadal Oscillation.
2 Data and methodology
There are 12 tide gauge stations in the Singapore and Jo-hor Straits – 8 stations along the coast of Singapore and 4 offshore. We used the data of four research-quality stations, namely, Tanjong Pagar (TP), Raffles Lighthouse (RL), Sul-tan Shoal (SH) and Sembawang (SE), each one having more than 25 years of long-term data and less data gaps compared to other stations (Fig. 1b). Annual, monthly and hourly sea level data for the stations are obtained or derived from the Permanent Service for Mean Sea Level (PSMSL, 2013) and University of Hawaii Sea Level Center (UHSLC, 2013). We truncated segments that have more than 5 years of disconti-nuity, thus, retaining SE and SH data for the period 1973– 2011, as well as data from RL and TP stations for the pe-riods 1975–2011 and 1984–2011, respectively. Even though TP station has data from 1974, the data before 1984 are spo-radic.
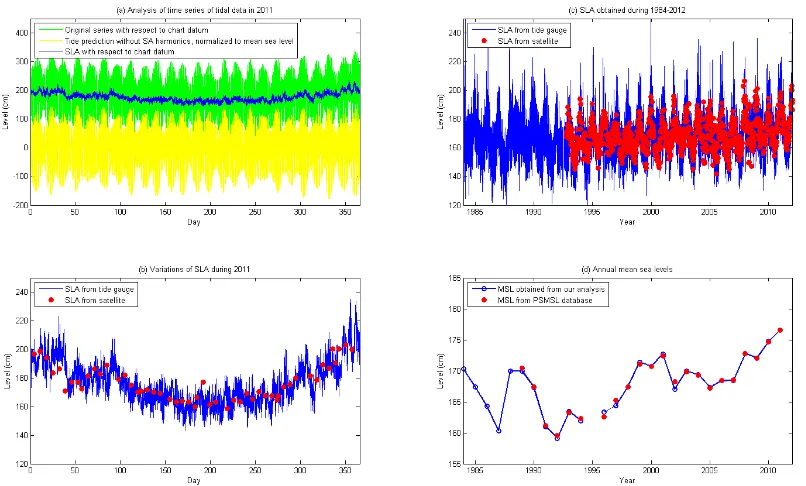
In order to eliminate tidal constituents, the tide gauge data are subject to harmonic analysis using T Tide program (Pawlowicz et al., 2002), and residuals (SLAs) are studied as shown in Fig. 2a for TP station. Satellite altimetry data from the merged global datasets (AVISO, 2013) at the clos-est point to TP tide gauge have been used to verify our anal-ysis (Figs. 2b and c). The algorithm used to detide sea level records is verified on PSMSL data, as shown in Fig. 2d. The average trend of sea level in SS is calculated as the arith-metic mean of four tide gauge records for the common period 1984–2009.
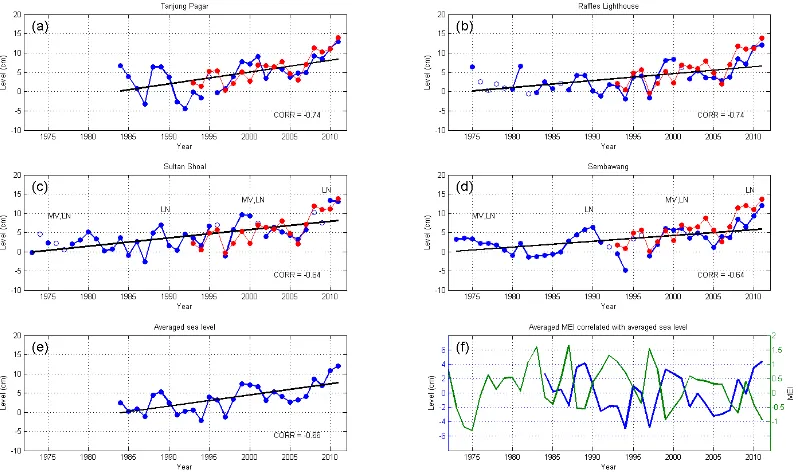
Annual sea level records in SS show variability with ENSO in the range±5 cm, where drops are associated with El Ni˜no events, while the rises are correlated with La Ni˜na episodes (Fig. 4f). This observation helped to derive linear dependencies to fill a few data gaps, identified by open blue circles in Fig. 4a–d. The data reconstruction algorithm is
ver-ified against satellite altimetry during the entire available pe-riod. In relating annual sea level records to ENSO events, the Multivariate ENSO Index (MEI, 2013) is used (Wolter and Timlin, 1993, 1998). It consists of six main variables (sea-level pressure, zonal and meridional components of the sur-face wind, sea sursur-face temperature, sursur-face air temperature and total cloudiness fraction of the sky), which have been observed over the tropical Pacific for many years.
3 Trend and variability of sea level in Singapore Strait
In the following sections, we explore sea level trend and ability in SS and illuminate signals of climate and ocean vari-ability at different temporal and spatial scales.
3.1 Role of Asian monsoon in creating seasonal sea level pattern
The seasonal variability of SLAs at TP station for a typi-cal year (2011) is presented in Fig. 2b. SLAs vary in the range of±20 cm throughout the year, yielding positive val-ues (with respect to their annual mean) during November– February (northeast monsoon, NE) and negative values dur-ing June–August (southwest monsoon, SW). Similar sea-sonal pattern is repeated every year during the considered pe-riod 1984–2012 (Fig. 2c), modulated by climate and weather variabilities. It has been pointed out by Tkalich et al. (2012) that the seasonal and extreme winds over SCS as well as their persistence and direction play the primary role in generating SLAs in SS.
To examine climatological annual patterns of SLAs in SS for the four tide gauge stations, we used monthly averaged values (Fig. 3). All stations show consistent climatology, but with different SLA magnitudes, for instance, SE and TP sta-tions have the most prominent seasonal signals, whereas SH and RL exhibit the weakest anomalies. This difference could be due to the fact that SE and TP stations are located closer to the SCS, thus more exposed to the monsoon surge, whereas SH and RL gauges are shielded from the direct monsoonal force.
3.2 Role of multi-decadal wind-driven circulation variability
Fig. 2. Analysis of Tanjong Pagar tide station data: (a) Typical annual tide gauge record and derived sea level anomalies; Comparison of sea level anomalies derived from the tide gauge and satellite altimetry (AVISO) for (b) a typical year, and (c) the period 1984–2012; (d) Annual sea levels obtained in our analysis (blue lines) in accordance with these achieved in PSMSL database (red symbols).
Fig. 3. Monsoonal and seasonal influence on sea level variations (monthly sea level anomalies).
North Equatorial Current shifted southward along the 137◦E meridian (Qiu and Chen, 2012) leading to an increase in sea surface height east of the Philippines. Thus, regional wind stress curl anomaly is also responsible for the enhanced re-gional sea level rise, exceeding 10 mm yr−1 in the western tropical North Pacific Ocean (Timmermann et al., 2010). Satellite altimetry data suggest that similar pattern has been established over the entire Sunda Shelf in the past 20 yr.
The spikes in averaged sea level in the SS due to the multi-decadal variability are identified in Fig. 4.
3.3 Role of ENSO in SS interannual sea level variability
Figure 4a–d bring out the interannual variability of sea level in SS during the observation periods. One can notice signif-icant negative correlation (with a coefficient –0.7) between the MEI index and averaged annual sea level in SS (Fig. 4e, f) as well as similar order correlation with individual tide gauge annual records, indicated by numerals in Fig. 4a–d. The most prominent troughs in the annual sea level are observed dur-ing El Ni˜no peaks in 1982–1983, 1987, 1992, 1997 and 2003, whereas sea level crests are evident during La Ni˜na extremes in 1975, 1985, 1988, 1999 and 2008. It is clear that mag-nitude of sea level variability due to ENSO is proportional to MEI strength during the observation period. In particular, during the strongest El Ni˜no/La Ni˜na episodes, the sea level annual anomaly is the largest, of the order of 5–8 cm at TP, 3–5 cm at RL, 3–5 cm at SH, and 3–8 cm at SE.
Fig. 4. (a–e) Sea level at tide gauges in Singapore Strait (the zero reference level is adjusted to the beginning of the regression line): blue dot-line identify annual sea level at the tide gauges, with linear trend for the observation period identified by solid black lines; open blue circles indicate restored missing data; correlation of sea level and Multivariate ENSO Index (MEI) is shown for each tide record; red dot-line identify satellite altimetry for the SS region (AVISO). (f) Comparison of anomalies of average annual SS sea level (detrended, blue line) with yearly-averaged MEI (green line). Periods of sea level maxima due to multi-decadal variability and La Ni˜na episodes are indicated by symbols “MV” and “LN”, respectively.
TOPEX/Poseidon altimetry for the SCS to show, in particu-lar, that the MSL over the SCS has risen by 10 cm between 1997 and 1999. As shown in Fig. 2 of Church et al. (2006) that SS region also had a sea level rise of the order of 5– 10 mm yr−1 during 1993–2001, it is lower than or equal to our averaged SS sea level rise rate 10.0 mm yr−1for the same period. It is clear from the short-term analysis that to avoid misinterpretation of sea level trend influenced by ENSO and multi-decadal oscillation signals, the data span should be at least several decades long, preferably exceeding 50–60 years.
3.4 Role of global signal in SS sea level trend
Figure 4 and Table 1 provide comparison of trends obtained from tide gauges in SS with the global trends (Church and White, 2011) for the period 1973–2011 and shorter. Having a moderate start after 1975, SS sea level has increased rapidly till the year 2000. We presume that acceleration after 1993 is partially attributed to the ENSO cycle as well as to multi-decadal climate variability, as indicated in Fig. 4(c,d). An additional possible mechanism behind the acceleration is the global-scale consequences of the eruption of Mt. Pinatubo in the Philippines in 1991 (Church et al. 2004; Church et al. 2005; Gregory et al., 2006; Domingues et al., 2008). Atmo-spheric ashes have slowdown warming of the Earth for two years, but the accumulated commitments have rebounded strongly after 1993. According to Holgate and Woodworth
(2004) during the period January 1993 to December 2002, the corrected tide gauge records provided a global average trend of 4.0 mm yr−1.
3.5 Sea level rise and variability in SS
Globally, sea level rise has been accelerating of the order of 0.01 mm yr−2since 1870 (Church and White, 2006; Jevre-jeva et al., 2008, Church and White, 2011) leading to the 20th century global sea level rise rate 1.7±0.2 mm yr−1. This value could be compared with SS averaged rate (1.8±0.4 mm yr−1) measured at SH and SE tide gauges but for the shorter period, 1973–2011. In particular, measured sea level in SS has been rising at the rate 1.8–2.3 (on an av-erage of 2.1±0.6) mm yr−1during 1984–2009 and 1.9–4.6 (3.4±1.3) mm yr−1 for the period 1993–2009. When com-pared to global rates of 2.4±0.4 and 2.8±0.8 mm yr−1for the same periods, respectively, it is clear that SS sea level rise had a relatively slow start in the early period, but accelerated faster than the global rate later. The sea level increased after 1993 most likely due to multi-decadal climate variability.
4 Conclusion and discussion
and Sembawang (SE). After tide signals are removed from the records, the residuals are analysed to uncover regional and global signals that might be affecting local sea level. At annual scale, sea level in SS is driven by monsoon wind causing a sea level surge of the order of 20 cm, positive dur-ing NE monsoon and negative durdur-ing SW monsoon. Inter-annual variability associated with ENSO cycle is expressed as dropping sea level during El Ni˜no events and rising dur-ing La Ni˜na episodes, both are of the order of±5 cm. Dur-ing 1984–2009, the average sea level rise in SS has accel-erated to 2.1±0.6 mm yr−1, almost reaching the global rate of 2.4±0.4 mm yr−1. In recent years (1993–2009), the aver-age SS sea level has risen at the rate of 3.4±1.3 mm yr−1, exceeding the global trend of 2.8±0.8 mm yr−1. SH seems to be an outlier during the recent period, having the low-est sea level rise rate of 1.9±1.4 mm yr−1among other sta-tions (TP: 4.6±1.2 mm yr−1, RL: 3.0±1.3 mm yr−1, and SE: 3.9±1.3 mm yr−1). This discrepancy might be due to the influence of intensive coastal development in the area (Lui and Tan, 2001). If SH tide gauge readings are dis-carded, the average SS sea level rise has an upward trend of 4.1±1.3mm yr−1during the period 1993–2009.
In order to get an absolute rate of sea level rise in SS as opposed to measured relative sea level, tide gauge records have to be corrected for vertical land motion (VLM). VLM is a highly localised phenomenon, which primarily results from either glacial isostatic adjustment in areas covered by ice sheets, movement of the Earth’s tectonic plates, or local compaction of sediment and underground soil. A few stud-ies have been carried out using GPS measurements to derive the speed of crustal motions in regions adjacent to Singapore (Simons et al., 2007; Trisirisatayawong et al., 2011). How-ever, no study has explicitly provided the VLM estimation for Singapore, except for a pilot investigation by Fernandes et al. (2011) who reported a uniform subsidence rate of 1– 1.5 mm yr−1for the whole island using the limited observa-tions for the period 2006–2011 via the newly established Sin-gapore Satellite Positioning Reference Network (SiReNT). With the limited data available, if the correction is applied to the tide gauge records, Singapore Strait averaged sea level rise rate became closer to the regional MSL rise trend.
Acknowledgements. We thank the Directors of NIO, CSIR and
TMSI, NUS for the facilities provided at their respective Institutes; and MPA for providing the data. P. Vethamony and M. T. Babu are thankful to NUS, Singapore for granting Visiting Research Fellowship. We also thank to A. S. Unnikrishnan, NIO, CSIR and X. Haihua, TMSI, NUS for giving useful suggestions; and acknowledge the anonymous reviewers for the critical comments, which helped us to improve the manuscript substantially.
Edited by: A. Sterl
References
AVISO, Altimetric data, Retrieved Jan 25, 2013, from http://www. aviso.oceanobs.com/en/data.html, 2013.
Becker, M., Meyssignac, B., Letetrel, C., Llovel, W., Cazenave, A., and Delcroix, T.: Sea level variations at tropical Pa-cific islands since 1950, Glob. Planet. Change, 80–81, 85–98, doi:10.1016/j.gloplacha.2011.09.004, 2011.
Bindoff, N. L., Willebrand, J., Artale, V, Cazenave, A., Gregory, J., Gulev, S., Hanawa, K., Le Qu´er´e, C., Levitus, S., Nojiri, Y., Shum, C. K., Talley L. D., and Unnikrishnan, A.: Observations: Oceanic climate change and sea level, in: Climate Change 2007: The Physical Science Basis. Contribution of Working Group I to the Fourth Assessment Report of the Intergovernmental Panel on Climate Change, edited by: Solomon, S., Qin, D., Manning, M., Chen, Z., Marquis, M., Averyt, K. B., Tignor, M., and Miller, H. L., Cambridge Univ. Press, Cambridge, UK and New York, USA, 2007.
Cabanes, C., Cazenzve, A., and Le Provost, C.: Sea level rise during past 40 years determined from satellite and in situ observations, Science, 294, 840–842, doi:10.1126/science.1063556, 2001. Carton, J. A., Giese, B. S., and Grodsky, S. A.: Sea level rise and
the warming of the oceans in the Simple Ocean Data Assimila-tion (SODA) ocean reanalysis, J. Geophys. Res., 110, C09006, doi:10.1029/2004JC002817, 2005.
Chambers, D. P., Melhaff, C. A., Urban, T. J., Fuji, D., and Nerem, R. S.: Low-frequency variations in global mean sea level: 1950– 2000, J. Geophys. Res., 107, 3026, doi:10.1029/2001JC001089, 2002.
Cheng, X. and Qi, Y.: Trends of sea level variations in the South China Sea from merged altimetry data, Glob. Planet. Change, 57, 371–382, doi:10.1016/j.gloplacha.2007.01.005, 2007.
Church, J. A., Gregory, J. M., Huybrechts, P., Kuhn, M., Lambeck, K., Nhuan, M. T., Qin, D., and Woodworth, P. L.: Changes in Sea Level, Intergovernmental Panel on Climate Change, Third As-sessment Report, Cambridge Univ. Press, New York, 639–694, 2001.
Church, J. A., White, N. J., Coleman, R., Lambeck, K., and Mitro-vica, J. X.: Estimates of the regional distribution of sea-level rise over the 1950 to 2000 period, J. Climate, 17, 2609–2625, doi:10.1175/1520-0442(2004)017¡2609:EOTRDO¿2.0.CO;2, 2004.
Church, J. A., White, N. J., and Arblaster, J. M.: Significant decadal-scale impact of volcanic eruptions on sea level and ocean heat content, Nature, 438, Nov. 3, doi:10.1038/nature04237, 2005. Church, J. A., White, N. J., and Hunter, J. R.: Sea-level rise at
trop-ical Pacific and Indian Ocean islands, Glob. Planet. Change, 53, 155–168, doi:10.1016/j.gloplacha.2006.04.001, 2006.
Church, J. A. and White, N. J.: Sea-level rise from the late 19th to the early 21st Century, Geophys. Res. Lett., 33, L01602, doi:10.1029/2005GL024826, 2006.
Church, J. A., White, N. J., Konikow, L. F., Domingues, C. M., Cogley, J. G., Rignot, E., Gregory, J. M., van den Broeke, M. R., Monaghan, A. J., and Velicogna, I.: Revisiting the Earth’s sea-level and energy budgets from 1961 to 2008, Geophys. Res. Lett., 38, L18601, doi:10.1029/2011GL048794, 2011.
Domingues, C. M., Church, J. A., White, N. J., Gleckler, P. J., Wi-jffels, S. E., Barker, P. M., and Dunn, J. R.: Improved estimates of upper-ocean warming and multidecadal sea-level rise, Nature, 453, 1090–1093, doi:10.1038/nature07080,, 2008.
Douglas, B. C.: Global sea level rise, J. Geophys. Res., 96, 6981– 6992, doi:10.1029/91JC00064, 1991.
Fang, G., Kwok, Y.-K., Yu, K., and Zhu, Y.: Numerical simula-tion of principal tidal constituents in SCS, Gulf of Tonkin & Thailand, Cont. Shelf Res., 19, 845–869, doi:10.1016/S0278-4343(99)00002-3, 1999.
Fernandes, R. M. S., Raju, D., and Khoo, V.: Evaluation of the Tec-tonic Stability of Singapore based on SiReNT, Joint International Symposium on Deformation Monitoring, Hong Kong, Nov 4, 2011.
Gregory, J. M., Lowe, J. A., and Tett, S. F. B.: Simulated global-mean sea level changes over the last half-millennium, J. Climate, 19, 4576–4591, doi:10.1175/JCLI3881.1, 2006.
Hamlington, B. D., Leben, R., Nerem, S., Han, W., and Kim, K. Y.: Reconstructing sea level using cyclostationary empir-ical orthogonal functions, J. Geophys. Res., 116, C12015, doi:10.1029/2011JC00752, 2011.
Holgate, S. J. and Woodworth, P. L.: Evidence for enhanced coastal sea level rise during the 1990s, Geophys. Res. Lett., 31, L07305, doi:10.1029/2004GL019626, 2004.
Jevrejeva, S., Moore, J. C., Grinsted, A., and Woodworth, P. L.: Re-cent global sea level acceleration started over 200 years ago?, Geophys. Res. Lett., 35, L08715, doi:10.1029/2008GL033611, 2008.
Ko, D. S., Martin, P. J., Chao, S. Y., Shaw, P. T., and Lien, R. C.: Large-amplitude internal waves in the South China Sea, Ocean Sci. Tech. (Naval Res. Lab. Review), 197–200, 2008.
Li, L., Xu, J., and Cai, R.: Trends of sea level rise in the South China Sea during the 1990s: an altimetry result, Chin. Sci. Bull., 47, 582–585, 2002.
Lui, P. C. and Tan, T. S.: Building integrated large-scale urban in-frastructures: Singapore’s experience, J. Urban Tech., 8, 49–68, doi:10.1080/10630730120052172, 2001.
MEI, Multivariate ENSO Index, Retrieved Jan 25, 2013, from http: //www.esrl.noaa.gov/psd/enso/mei/, 2013.
Meyssignac, B. and Cazenave, A.: Sea level: a review of present-day and recent-past changes and variability, J. Geodyn., 58, 96–109, doi:10.1016/j.jog.2012.03.005, 2012.
Meyssignac, B., Llovel, W., Becker, M., and Cazenave, A.: An as-sessment of two-dimensional past sea level reconstructions over 1950–2009 based on tide gauge data and different input sea level grids, Surv. Geophys., 33, 945–972, doi:10.1007/s10712-011-9171-x, 2012a.
Meyssignac, B., Salas y Melia, D., Becker, M., Llovel, W., and Cazenave, A.: Tropical Pacific spatial trend patterns in observed sea level: internal variability and/or anthropogenic signature?, Clim. Past, 8, 787–802, doi:10.5194/cp-8-787-2012, 2012b. Mitas, C. M. and Clement A.: Has the Hadley cell been
strengthening in recent decades? Geophys. Res. Lett., L03809, doi:10.1029/2004GL021765, 2005.
Nerem, R. S., Chambers, D., Choe, C., and Mitchum, G. T.: Estimating mean sea level change from the TOPEX and Jason altimeter missions, Mar. Geod., 33, Supp 1, 435, doi:10.1080/01490419.2010.491031, 2010.
Nicholls, R. J. and Cazenave, A.: Sea-level rise & it im-pact on coastal zones, Science, 328, 1517, Jun 18, doi:10.1126/science.1185782, 2010.
Pawlowicz, R., Beardsley, B., and Lentz, S.: Classical tidal har-monic analysis including error estimates in MATLAB using T TIDE, Comp. Geosci., 28, 929–937, 2002.
PSMSL, Obtaining Tide Gauge Data, Retrieved Jan 25, 2013, from http://www.psmsl.org/data/obtaining/, 2013.
Qiu, B. and Chen, S.: Concurrent decadal mesoscale eddy mod-ulations in the western North Pacific subtropical gyre, J. Phys. Oceanogr., doi:10.1175/JPO-D-12-0133.1, 2012.
Qu, T., Du, Y., Meyers, G., Ishida, A., and Wang, D.: Connecting the tropical Pacific with Indian Ocean through South China Sea, Geophys. Res. Lett., 32, L24609, doi:10.1029/2005GL024698, 2005.
Ray, R. and Douglas, B.: Experiments in reconstructing twentieth-century sea levels, Progr. Oceanogr., 91, 496–515, doi:10.1016/j.pocean.2011.07.021,, 2011.
Rong, Z., Liu Y., Zong, H., and Cheng, Y.: Interannual sea level variability in the South China Sea and its re-sponse to ENSO, Glob. Planet. Change, 55, 257–272, doi:10.1016/j.gloplacha.2006.08.001, 2007.
Simons, W. J. F., Socquet, A., Vigny, C., Ambrosius, B. A. C., Haji Abu, S., Promthong, C., Subarya, C., Sarsito, D. A., Matheussen, S., Morgan, P., and Spakman, W.: A decade of GPS in Southeast Asia: Resolving Sundaland motion and boundaries, J. Geophys. Res., 112, B06420, doi:10.1029/2005JB003868, 2007.
Tanaka, H. L., Ishizaki, N., and Kitoh, A.: Trend and interannual variability of Walker, monsoon and Hadley circulations defined by velocity potential in the upper troposphere, Tellus A, 56, 250– 269, 2004.
Timmermann, A., McGregor, S., and Jin, F. F.: Wind effects on past and future regional sea level trends in the southern Indo-Pacific, J. Clim., 23, 4429–4437, doi:10.1175/2010jclim3519.1, 2010. Tkalich, P., Vethamony, P., Babu, M. T., and Malanotte-Rizzoli, P.:
Storm surges in the Singapore Strait due to winds in the South China Sea, Nat. Hazards, doi:10.1007/s11069-012-0211-8, 2012. Trenberth, K. E. and Hurrell, J. W.: Decadal atmosphere-ocean variations in the Pacific, Clim. Dyn., 9, 303–319, doi:10.1007/bf00204745, 1994.
Trisirisatayawong, I., Naeije, M., Simons, W., and Fenoglio-Marc, L.: Sea level change in the Gulf of Thailand from GPS-corrected tide gauge data and multi-satellite altimetry, Glob. Planet. Change, 76, 137–151, doi:10.1016/j.gloplacha.2010.12.010, 2011.
Tsimplis, M. N. and Shaw, A. G. P.: The forcing of mean sea level variability around Europe, Glob. Planet. Change, 63, 196–202, doi:10.1016/j.gloplacha.2007.08.018, 2008.
UHSLC, Research quality data Tanjong Pagar, Retrieved Jan 25, 2013 from http://ilikai.soest.hawaii.edu/uhslc/htmld/d0699A. html, 2013.
Unnikrishnan, A. S. and Shankar, D.: Are sea-level-rise trends along the coasts of the north Indian Ocean consistent with global estimates?, Glob. Planet. Change, 57, 301–307, doi:10.1016/j.gloplacha.2006.11.029, 2007.
White, N. J., Church, J. A., and Gregory, J. M.: Coastal and global averaged sea level rise for 1950 to 2000, Geophys. Res. Lett., 32, L01601, doi:10.1029/2004GL021391, 2005.
Wolter, K. and Timlin, M. S.: Monitoring ENSO in COADS with a seasonally adjusted principal component index, Proc. 17th Cli-mate Diagnostics Workshop, Norman, OK, NOAA/NMC/CAC, NSSL, Oklahoma Clim. Survey, CIMMS and School of Meteor., Univ. Oklahoma, 52–57, 1993.
Wolter, K. and Timlin, M.S.: Measuring the strength of ENSO events – how does 1997/98 rank?, Weather, 53, 315–324, doi:10.1002/j.1477-8696.1998.tb06408.x, 1998.