2014 Page 1
Ministry of Education
Annual Report
2013
2014 Page 2
Table of Contents
1. FORWARD FROM THE DIRECTOR GENERAL ... 4
2. CORPORATE STRUCTURE ... 5
3. CORPORATE OVERVIEW ... 9
Vision ... 9
Mission ... 9
Objectives (Goal or Aims) ... 9
Key Strategies, Activities, Accomplishments and Challenges of the Ministry of Education in 2013 ... 9
4. HUMAN RESOURCE ... 13
5. KEY STATISTICAL SUMMARY ... 15
6. EDUCATION SECTOR FINANCING ... 17
Ministry of Education Budget Overview ... 17
Recurrent Budget ... 17
Payroll Expenses ... 19
Operational Expenses ... 20
Allocation of Government Grant ... 26
7. DEVELOPMENT BUDGET ... 28
8. OTHER ISSUES ... 34
Portfolio legislation ... 34
Statutory Authorities and Non statutory Bodies ... 34
International Agreements or Commitments ... 34
Complaints Mechanism ... 35
9. CONTACT OFFICER ... 35
Tables
Table 1: Key Strategies, Activities, Accomplishments and Challenges ... 10Table 2: Number and Status of Positions, 2013 ... 13
Table 3: Budget Allocations and Actual Expenditure Incurred by MoE in 2013 ... 18
Table 4: Major Payroll Expenditure Accounts ... 18
Table 5: Payroll Expenditure by Activity, 2013 ... 19
Table 6: Detail Cost Centre Budget and Actual for 2013 ... 21
Table 7: Grant Summary in Vatu, 2013 ... 27
Table 8: Development Budget, 2013 ... 28
Table 9: VERM Project Budgets vs. Actual - Active Projects ... 29
2014 Page 3 Figures
Figure 1: Approved organization structure for the office of the Director General ... 5
Figure 2: Approved organization structure for the division of Administration and Finance ... 6
Figure 3: Approved organization structure for the division of Policy and Planning ... 7
Figure 4: Approved organization structure for the division of Education Services ... 8
Figure 5: Number and Status of MoE Positions, 2013 ... 13
Figure 6: School enrolment population and estimated right age, 2013 ... 15
Figure 7: GER vs. NER Trend in Primary (Yr. 1-6) ... 15
Figure 8: Pupil to Classroom ratio, 2013 ... 15
Figure 9: Certified and Qualified ratio, 2013 ... 16
Figure 10: Transition rate from year 8 - 9 ... 16
Figure 11: Transition rate to year 11 and to year 13 ... 16
Figure 12: Ministry of Education Budget vs. Actual by Activity, 2013 ... 19
Figure 13: Actual Grant and Financing Allocation ... 25
Figure 14: Percentage (%) Share of Expenditure of Grants and Financing ... 25
Figure 15: Recurrent Expenditure 2013 ... 26
Figure 16: % of VERM Activities Implemented ... 31
Figure 17: Budget and Actual as Shared % of VERM Annual Budget, 2013 ... 32
2014 Page 4
1.
FORWARD FROM THE DIRECTOR GENERAL
Dear, Honorable Minister,
I have the honor in submitting to you the 2013 Annual Report of the Ministry of Education.
This report has been prepared under subsection 20 (1) (L) of the Public Service Act of 1998 and in accordance with the guidelines for the preparation of Annual Reports referred to in this subsection and related documents issued by the Public Service Commission.
Year 2013 has been another challenging year. A lot has been done to implement the activities under the Vanuatu Education Road Map (VERM). The VERM 2010-2012 (extended into 2013) was funded jointly by AusAID, NZAID and UNICEF. The funding arrangement for the VERM activities signifies that the Vanuatu Government through the Ministry of Education has established a closer working relationship with the donors through a Sector Wide Approach (SWAp).
At this point, I wish to thank the team of people who have worked tirelessly in realizing the changes and achievements that have taken place to date. First of all to yourself as Minister responsible, for not only rendering me your full support, but in particular for the level of wisdom expended in navigating the changes, culminating in the successes we have experienced to date. The political advisors made the most difference in working together as a strong team in terms of unconditional support that was rendered. The Directors, both Principals of VIT and Vanuatu Institute of Teacher Education (VITE), the Secretary to the TSC, the PEO’s and the general staff have all contributed in their very unique ways in realizing these positive changes.
Honorable Minister, as you are fully aware, the Ministry of Education is currently going through major changes and I strongly believe that those changes as they unfold, will be of significant benefit not only to the school children of Vanuatu but also for the youth and adult population at large in the years to come.
Yours sincerely,
Jesse Dick Joe
2014 Page 5
2.
CORPORATE STRUCTURE
The Public Service Commission (PSC) approved the Ministry of Education (MoE) organization structure and the Job Description for the office of the Director General (i.e. Corporate Services Unit), division of Administration and Finance, Policy and Planning and Education Services under the Ministry of Education, on
the 19th of November 2009. In addition to that, the PSC also approved the salary grade for each position as
presented on the approved structures.
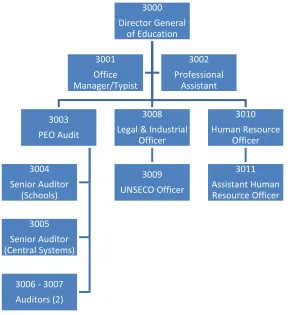
Until 2006, the MoE’s organizational structure had 7 Director Positions. In 2007, a review of the MoE organization structure was made and the 7 Director positions were reduced to 2. The 2 Directors were responsible for the 2 Divisions, particularly the Division of Corporate Services and the Division of Education Services). However, a later review to the structure in 2009 saw the inclusion of one more Director Position which brings the total directorate positions in the MoE structure to 3 (Director of Administration and Finance, Director of policy and planning and the Director of Education Services). Find below is the copy of the approved MoE organizational structure.
The consultation and reviewing of the MoE structure is underway. It is assumed that the review of the MoE structure will ensure there are better alignment of the structure with the revised legislations to address the current MoE policies and the MoE priorities, outlined in the Education sector plans.
Figure 1: Approved organization structure for the office of the Director General
3000 Director General
of Education
3003 PEO Audit
3004 Senior Auditor
(Schools)
3005 Senior Auditor (Central Systems)
3006 - 3007 Auditors (2)
3008 Legal & Industrial
Officer
3009 UNSECO Officer
3010 Human Resource
Officer
3011 Assistant Human Resource Officer 3001
Office Manager/Typist
3002 Professional
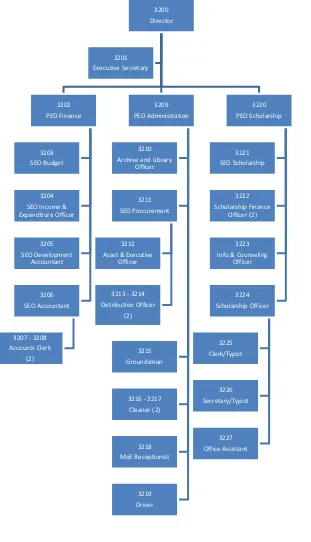
2014 Page 6 Figure 2: Approved organization structure for the division of Administration and Finance
3200 Director
3202 PEO Finance
3203 SEO Budget
3204 SEO Income & Expenditure Officer
3205 SEO Development
Accountant
3206 SEO Accountant
3207 - 3208 Accounts Clerk
(2)
3209 PEO Administration
3210 Archive and Library
Officer
3211 SEO Procurement
3212 Asset & Executive
Officer
3213 - 3214 Distribution Officer
(2)
3215 Groundsman
3216 - 3217 Cleaner (2)
3218 MoE Receptionist
3219 Driver
3220 PEO Scholarship
3221 SEO Scholarship
3222 Scholarship Finance
Officer (2)
3223 Info.& Counseling
Officer
3224 Scholarship Officer
3225 Clerk/Typist
3226 Secretary/Typist
3227 Office Assistant 3201
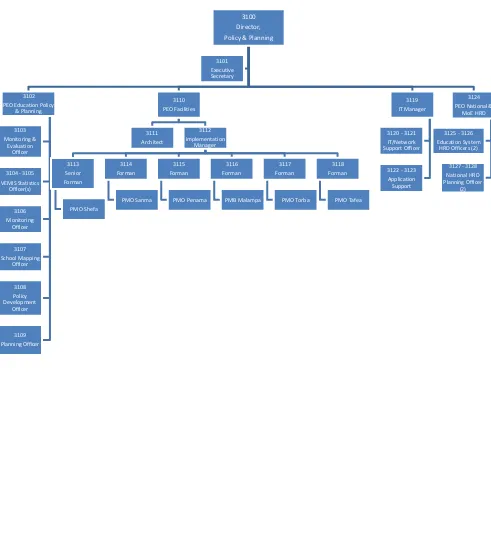
2014 Page 7 Figure 3: Approved organization structure for the division of Policy and Planning
3100 Director, Policy & Planning
3102 PEO Education Policy
& Planning
3103 Monitoring &
Evaluation Officer
3104 - 3105 VEMIS Statistics Officer(s) 3106 Monitoring Officer 3107 School Mapping Officer 3108 Policy Development Officer 3109 Planning Officer 3110 PEO Facilities 3111 Architect 3112 Implementation Manager 3113 Senior Forman PMO Shefa 3114 Forman PMO Sanma 3115 Forman PMO Penama 3116 Forman PMB Malampa 3117 Forman PMO Torba 3118 Forman PMO Tafea 3119 IT Manager
3120 - 3121 IT/Network Support Officer
3122 - 3123 Application Support
3124 PEO National &
MoE HRD
3125 - 3126 Education System
HRD Officers (2)
2014 Page 8 Figure 4: Approved organization structure for the division of Education Services
3300 Director Education Services
3303 PEO Education Services
3304 Pre-School Coordinator
3305 Basic Edu. Coordinator
3306 - 3309 National Programs
3310 Secondary Schl Coord
3311 Secondary Officer
3312 TVET Coordinator
3313 Inclusive Edu Coord
3314 School Research Officer
3315 - 3320 PEO Provincial Edu. (6)
3321 - 3326 Deputy PEO (5)
3339 – 3344 (6) Prov. Fin. and Corp Off.
3333 - 3338 Stat. & Distri.Officer (6)
3345 - 3353 Schl Impro Officer(s) (9)
3354 - 3359 Preschool Coord. (6)
3360 - 3361 Planning Officer(s) (2)
3327 - 3332 Facility Supervisor(s) (6)
3368 - 3373 Secretary (6)
3362 - 3367 Boat/Driver
3374 PEO Curri & Assess.
3375 - 3376 Exam & Assess Off (2)
3377 Assess. Off Data & Stat.
Anal.
3378 - 3380 Assess Process. Off.
3383 Sen. Curriculum Officer
3384 - 3389 Curriculum Coord. (6)
3390 - 3391 Editor/Desktop Publ. (2)
3394 - 3395 Graphic Designers
3392 - 3394 Book Designer (2)
3396 Printer
3397 Driver/Groundsman
3398 – 3399 Cleaner (2) 3381 - 3382
Secretary/Typist (2) Executive Secretary
(Primary)
2014 Page 9
3.
CORPORATE OVERVIEW
Vision
Our vision is for a caring education system which provides every young person with the lifelong skills, values, and confidence to be self-reliant and to contribute to the development of Vanuatu, and which works in partnership with all stakeholders to provide well-managed schools.
Mission
Our mission is to provide student-centered education that is accessible, relevant, sustainable, responsive, and of good quality, to guarantee every young person:
Pre-school and basic education to year 10, including literacy, numeracy, life skills, and livelihood
skills, respect for our history and culture, and respect for human rights;
Expanded opportunities for secondary, technical, tertiary and higher education;
Support for parents and communities to participate in and manage their schools;
A well-managed and accountable education system which focuses on building the human resources
of Vanuatu, improving learning, living, and working opportunities, and enabling young people to contribute to the productive sectors in both rural and urban areas.
Values
Students and schools first
Transparency, fairness, equity, and respect
Professionalism and accountability, focused on results
Grounded in the best of Ni-Vanuatu culture and open to the knowledge of the world
A team/ family approach
Objectives (Goal or Aims)
The Ministry of Education has three major objectives:
To increase equitable access to education for all people at all levels of education in Vanuatu
Improve the quality of education
Improve planning, fiscal and financial management
Key Strategies, Activities, Accomplishments and Challenges of the Ministry of Education in 2013
2014 Page 10
There are five key strategies in the transition plan. These key strategies were identified through systematic reviews conducted by external partners in consultation with the ministry of education. And these five strategies will be the focus of the Ministry of Educations planning and budgeting for the next five years.
Table 1: Key Strategies, Activities, Accomplishments and Challenges
Objective Key Strategies Key Activities Key Accomplishments Challenges/Issues
1. Improve the quality of Education
1. Train and support teachers to implement the new curriculum
Curriculum development (K1- yr. 13)
100 match program
In-service training of teachers Implementation of internal
assessments in schools
Development of teacher guides To procure support learning
materials for school children
Approval of syllabuses for Years 4-6 by NEC
Junior Secondary school syllabus writing completed, ready for consultation
Finalization of the Senior Secondary school syllabus
Learning materials were identified for procuring.
Rules and Procedures & Verification Manuals developed and used with VSSC assessment.
CATs designed in Vanuatu and administered
100% submission of IA marks
70% of VSSC school based IA workshops carried out
Awareness on introduction of IA in French Senior Secondary schools. Reprinting of IA books
Training of IA task designers conducted.
Shortage of human capacity
Lack of skilled personal to carry out the task Lack of specific skills to
meet requirements of certain activities
2. Strengthening of ECCE delivery
Training of provincial coordinators and ECCE key teachers
Registration of ECCE teachers Licensing of ECCE centers (model
kindys)
Developing the Vanuatu National Kindergarten Curriculum
New ECCE tools develop for coordinators, ECCE teachers and communities to use on;
Code of ethics Child readiness Child observation Positive behavior & Early identifying
Lack of budget support to provincial ECCE coordinators and key teachers to fully carry out their mentoring visits
2014 Page 11 Skills learnt in developing lesson plans
National quality framework developed
certain activities
2. To increase equitable access to education for all people at all levels of education in Vanuatu.
3. Engaging
communities through the school base management approach
Conduct follow up trainings on school finance management to all school heads
Roll-out of school improvement plan trainings
Conduct national
awareness/campaign on school grants/minimum quality standards and SBM
Head teachers were trained on making adjustment to financial plans to improve management. Roll out to SHEFA. It includes;
Schools formulating their own improvement planning
Integrating the 15 minimum quality standards into improvement plans &
use school grant according to the grant criteria
School committee members understand their roles
Lack of budget support to roll out training to all provinces
Lack of direction Lack of specific skills to
meet requirements of certain activities
4. Providing locally relevant and efficient delivery of services and equipment
VITE classroom construction supervision
Supervision of other classroom building projects (NZAID, France AID, Japanese AID, USP) Supervise Tafea college water
supply system rehabilitation Supervise repairs on cyclone damaged schools in Tafea
VITE classroom building completed and opened by the minister for 2014 use 10 2013 GGP classroom projects are
completed and will be opened in early 2014
Completion of the multipurpose court for Onesua college
Site inspection conducted (awaiting funding for continuation)
Repair of damage classrooms are completed by Grammar
Slow process of tender
Lack of community motivation
Lack of specific skills to meet requirements of certain activities
3. Improve planning, fiscal and financial management
5. Developing capacity within the Ministry of Education to deliver an effective, well managed and de-concentrated education system in Vanuatu
Facilitate MoE staff participation in the APTC management program Facilitate procurement activities Reviewing of legislations
(Education Act/TSC Act) Carry out reporting’s
(monthly/annual)
Collect, analysis and disseminate data (VEMIS)
VEMIS development
4 MoE staff graduating with APTC diploma in management in May 2014 Procurement procedure is strengthen Education Act review in final stage
(with state law)
TSC Act approved by DCO 2012 annual report submitted
Monthly development reports informs management on progress of activities Annual School Survey administered.
Lack of confidence from management
Lack of directions and delegation from managers
Lack of coordination Lack of recognition and
low staff motivation Lack of determination
2014 Page 12 Planning and budgeting
School grant payment
Organizational structure review Carry out school Auditing/audit
officers training Managing scholarships Manage teacher postings ICT support /MoE website Facilitate the Public Expenditure
Review (PER)
Staging a senior education officers conference meeting
Overall, 89% of surveys received of which 67.7% was received on time VEMIS data base is reviewed for
ownership purposes
Provincial education managers & officers understand planning and budgeting requirements
Grants use to purchase learning materials and resources for schools Organizational structure and Job
descriptions reviewed (on-going) Schools heads comply to the school
grant criteria
Student allowances are well managed Teacher postings are administered
(ongoing)
MoE website development (yet to be launched)
Report produce on public expenditure review
Senior education conference conducted and resolutions integrated into annual work plans
Ad hoc implementation of the MoE Policies Lack of specific skills to
2014 Page 13
4.
HUMAN RESOURCE
A report produced by the Human Resource Management Unit on the number of positions and the status of officers within the Ministry of Education structure has revealed the following information in the table beneath, from 2013 to 6 March 2014;
Table 2: Number and Status of Positions, 2013
DIVISIONS vacant vacant
Total
Occupied
Contract Permanent Temporary
TSC Secondment
occupied Total
Grand Total
Ministry Cabinet 20 20 20
Office of the Director General 3 3 1 10 11 14 Office of the Director of Education
Services 20 20 76 6 3 85 105
Office of the Director of Finance
and Administration 4 4 23 1 24 28
Office of the Director of Policy
and Planning 15 15 14 14 29
Grand Total 42 42 21 123 7 3 154 196
0 20 40 60 80 100 120
Ministry Cabinet Office of the Director General
Office of the Director of
Education Services
Office of the Director of Finance and Administration
Office of the Director of
Policy and Planning
ocupied - TSC Secndmnt ocupied -Temporary ocupied -Permanent ocupied - Contract vacant - (blank)
2014 Page 14
Not much recruitment was done last year however;
About nine (9) staff which was on acting basis since 2010, transferees from the old structure to
current structure have finally been directly appointed and approved on permanent basis by the Public Service Commission.
On that note based on work performance eight (8) staff that has been on temporary
employment against existing positions have been recommended by the superiors and approved by Public Service Commission on permanent basis.
MoE have also temporarily employed nine (9) staff who is not on the current structure but are
needed for effective workflow, waiting for the proposed structure to be finalized and approved.
Apart from other means of recruitment, seven (7) staff have been assessed, selected, appointed
2014 Page 15
5.
KEY STATISTICAL SUMMARY
School enrolment represents approximately 28.2 per cent of the estimated total population of Vanuatu in 2013. The shaded pyramid on the right shows the shape of the enrolment, age 6-10 in 2013. In orange is the estimated population of correct age 6-18. The pyramid shows two important characteristic about the school enrolment.
The school enrolment population in the first five years of
primary schooling is larger than the estimated population of the correct age, which means significant number of children in these year levels may not be at their correct
ages (eitherunder or over age).
The school enrolment population showed significant
decrease in numbers from year seven up to year 13, meaning high number of drop-outs.
The Net Enrolment Rate (NER) has increased by one and levels off, meaning MoE has a lot to do in terms of advocating and managing the children to attend primary school at the right age.
The primary school grant incentive, introduced in 2010 has seen an increase in the primary school enrolment. The Gross Enrolment Rate (GER) trend shows a steady increase, and leveling in 2013, meaning more unofficial age children are present in the system.
The graph on the right shows the pupil to classroom ratio for
the primary school (Government and Government assisted) in 2013. The norm pupil to classroom ratio in primary schools is 1:30.
The portrait shows that the ratio of pupil to
classroom is very high in the two urban centers compared to the province
Enrolment in the rural provinces does not meet the
standard ratio.
Enrolment and 2013 estimated population
6000 4000 2000 0 2000 4000 6000 Year 1 Year 2 Year 3 Year 4 Year 5 Year 6 Year 7 Year 8 Year 9 Year 10 Year 11 Year 12 Year 13 Male Female
110.8% 119.4%
85.6% 86.7%
0.0% 20.0% 40.0% 60.0% 80.0% 100.0% 120.0% 140.0%
2009 2010 2011 2012 2013
GER vs NER, Primary 1-6
GER NER
Figure 6: School enrolment population and estimated right age, 2013
Figure 7: GER vs. NER Trend in Primary (Yr. 1-6)
17.3 23.3
24.1 18.8 19.2 19.8 45.6 54.9 0.0 10.0 20.0 30.0 40.0 50.0 60.0 Rural Urban
2014 Page 16
Qualified is defined as a teacher that is not specifically trained at VITE but has an academic qualification. Certified is a teacher that has an academic qualification background and have been trained at VITE. Among the total number of 3,738 teachers, VEMIS is showing that still there are 1,334 teachers that are not qualified to teach, meaning these teachers do not meet the relevant academic qualification to teach or teachers that are actually teaching on temporary and contract basis.
The transition rate to year 9 in average is 83.9% between 2009 and 2013. VEMIS is recording a gradual increase starting at 79.1% in 2009 to 89.2% in 2013. There might be 100% of student who sat the national year 8 exam but not all of them have been placed in year 9 due to other factors; It is possible that the difference of 89.2% out of 100% transition rate to year 9 repeat year 8 in 2014. A more in-depth analysis is needed to actually trace where these students go.
The transition rate to year 11 and year 12 is fluctuated over years since 2009; there is a decrease of 4% difference in 2013 from 85.9% in 2012 to 81.6% in 2013. However the transition rate to year 13 show a big decrease over years from 28.8% in 2009 to 11.6% in 2013. The big gap on the transition rate between year 11 and 13 is significant, it could be defined by the high drop out after the year 10 and year 12 exams or a high percentage of student who carry on at VIT or in any formal and non-formal tertiary institutions in Vanuatu.
48.2%
60.7% 60.1% 57.6%
50.6%
69.8% 65.9% 64.3%
0.0% 10.0% 20.0% 30.0% 40.0% 50.0% 60.0% 70.0% 80.0% Early Childhood Education
Primary School Secondary School VANUATU
Certified and Qualified ratio, 2013
Certified Ratio Qualified Ratio
79.7% 79.8% 82.1%
88.1% 89.2%
74.0% 76.0% 78.0% 80.0% 82.0% 84.0% 86.0% 88.0% 90.0%
2009 2010 2011 2012 2013
Transition rate
74.2% 81.5% 72.5%
85.9% 81.6%
28.8% 22.9%
14.0% 10.6% 11.6%
0.0% 20.0% 40.0% 60.0% 80.0% 100.0%
2009 2010 2011 2012 2013
to year 11 to year 13
Figure 9: Certified and Qualified ratio, 2013
Figure 10: Transition rate from year 8 - 9
2014 Page 17
6.
EDUCATION SECTOR FINANCING
Ministry of Education Budget Overview
In summary, the Ministry has continued to implement activities within the Vanuatu Education Road Map (VERM) with technical and budget support from development partners. In 2013, as 72.2% of the recurrent budget was for staff personnel emoluments, the development budget was utilized to carry out priority activities identified within VERM to achieve the Ministry’s objectives, which were not funded within the recurrent budget.
At the end of 2013 total net value of assets for the Ministry as captured in Smart Stream for 540 was 116 million vatu ,550 was 7.3 million vatu and 510 10.7 million vatu. Therefore in total there was a total of 134 million vatu was recorded and captured in the system. However this does not capture and include all assets at the provincial and most importantly at the school level as yet with the vast amount of resource and support being provided by the Vanuatu Government and the other donor partners. There are three categories of revenue for the Ministry;
1. Housing recovery
2. Exams Levee
3. Other payments for school registration fees
The total revenue collected for these categories was 3.7 million vatu.
Furthermore the Ministry will need to continue to work more closely with managers to ensure that planned budgets and activities for the year can be fulfilled within a given timeframe, and all resources are available to ensure that efficiency prevails within the system, and all funds are well accounted for and utilized to ensure the Ministry is able to deliver on its objectives.
Recurrent Budget
This report has collated all budget and expenditure activities for overhead and payroll under the Ministry of Education which comprises of the Cabinet Services (510), Department of Education (540) and Teaching Service commissions and other Education Commissions and Councils for the financial year of 2013.
In 2013, the Ministry of Education was allocated an annual Budget of 4,285,025,195 vatu. This was approximately 26.2 % of the total Government appropriated recurrent budget of 16.33 billion vatu which is an increase in budget of 2.1% compared to the 2012 appropriated annual budget.
This budget of 4,285,025,195 vatu is at 31st of December 2013, which represents the actual appropriated
budget by the parliament as at 31st of January which was 3,987,025,195 (MFEM, Budget 2013, Vol. 1 &
2) and the final budget, which included the Vanuatu Government scholarship supplementary of 298
million vatu.
2014 Page 18
Program Activity Details Budget Total
Expenditure Remaining Balance
MEA MEAA Cabinet 47,447,892 48,190,157 - 742,265
MEB MEBA Office of the Director General 25,386,224 24,047,891 1,338,333
MEBB Office of the Director of
Corporate Services 88,659,167 84,985,814 3,673,353
MEBC Policy & Planning 52,061,344 46,418,371 5,642,973
MEC MECA School Support Services 126,611,935 122,772,203 3,839,732
MECB Secondary Schools 1,151,654,328 1,185,048,593 (33,394,265)
MECC Primary Schools 1,721,180,473 1,715,321,656 5,858,817
MECD Post-Secondary Schools 813,457,882 697,217,351 116,240,531
MECE School Support Services 142,333,413 136,367,150 5,966,263
MED MEDA Teaching Service
Commission 99,400,602 99,403,210 (2,608)
MEDB Other Education
Commissions & Councils 116,232,537 116,082,954 149,583
Total Ministry of Education 4,285,025,195 4,176,452,140 108,573,055
Source: Extracted from Vanuatu Government Smart stream Vision Report (20/03/2014)
Overall, the Ministry had a favorable variance of 108.6 million vatu. The above favorable accounts were mainly due to the Vanuatu Government Scholarship Supplementary funds of 119.4 million vatu not fully utilized. This was due to lack of timely communication between the Scholarship office and the Institutions to providing invoices on time for payments to be committed and paid to be cleared.
Of that 119.4 million vatu of the Vanuatu Government Scholarship Funds remaining, 10.9 million vatu was used to offset overspending in the payroll .About 93.2 % of the total overspending in payroll was from the Teachers’ payroll as shown in the table below.
These major overspending in the Teachers’ payroll was for the housing allowances, special allowances for head teachers especially, leave allowance payouts with severances, overtime wages, permanent wages and employee recreation leave. See as attached Annex for details.
Table 4: Major Payroll Expenditure Accounts
# Cost Centre Budget Remaining
Balance
Total Committed Budget to date
1 Secondary schools 547,980,472 577,682,962 - 29,702,490
2 Primary schools 543,482,998 558,259,860 - 14,776,862
3 Vanuatu Institute of Technology 107,453,633 113,931,640 - 6,478,007
Total 1,198,917,103 1,249,874,462 -50,957,359
2014 Page 19
Figure 12: Ministry of Education Budget vs. Actual by Activity, 2013
Payroll Expenses
The Ministry has overspent its annual payroll budget of 100.5 % on staff personnel entitlements, including salaries, family allowances, housing allowances, and superannuation. Most of these payroll expenditures are for primary and secondary teachers of both government and government assisted schools and post-secondary institutions, VIT & VITE. Additional payroll commitments arose from backlog of teachers’ salaries, scholarship teachers being paid on full salary for the duration of their 3 year program which was unbudgeted for, arrears of family and housing allowances, and overtime payments. See attached Annex for details of payroll expenditure for 510,540 and 550.
All teachers who have either retired, died in service or have been dismissed from the TSC have been replaced by graduates from the Vanuatu Institute of Teacher Education (VITE), or from regional institutions such as USP and PAU. Of the 22 PSC vacancies budgeted for 2013, there were only 3
permanent recruitments to the PSC, and the rest of the recruitments were deferred to 2014.Annex to
this report is the detail of budgeted positions and any or all vacancies.
Table 5: Payroll Expenditure by Activity, 2013
No. Activity Annual Payroll
Budget
Total Payroll Expenditure
% as share of total payroll expenditure
1 510 – Cabinet Services 40,026,962 40,534,167 101.3
2 540 – Department of Education 3,025,508,691 3,038,862,092 100.4
3 550 – Teaching Service Commission & Education Commission.
&Councils
15,747,247 15,702,943 99.7
0 500,000,000 1,000,000,000 1,500,000,000 2,000,000,000
Cabinet Office of the Director General Office of the Director of Corporate Services Policy & Planning School Support Services
Secondary Schools Primary Schools Post-Secondary Schools School Support Services Teaching Service Commission Other Education Commissions & Councils
Total Expenditure
2014 Page 20
Operational Expenses
In 2013, the Ministry incurred expenses which were unplanned for therefore there virements and advances prepared within the Activities and Programs payroll and overheads to ensure that operational costs were met and managed well.
In total there was a total of 197.5 million vatu worth of virements prepared and approved of which 41.1 % was for payroll to meet payroll expenditures or overspending and ensure availability of overhead warrants. The other 58.9 % was done for over heads and that was done to meet mostly unplanned or under budgeted activities as such for the Council of Ministers’ trips, international trips with additional delegation, school grants for secondary, freighting of the three school buses and the Tafea Education Office vehicle, purchasing of the Tafea Education Office new vehicle and so on.
Furthermore there was a total of 104.2 million vatu worth of advances prepared and approved by the department of finance to meet other activities as school grants, for unplanned trips or to balance any shortfall in payroll or overhead expenditures.
The major activities affected were the:
Vanuatu Government Scholarship – The increased number of intakes this year required an extra supplementary budget to sustain the Vanuatu Government Scholarship scheme for the full year. This supplementary was for payments for the student fees, allowances, food allowances, medical insurance, students international travelling and all other related costs;
NEC Sitting – Due to and increase with the Vanuatu Government Scholarship awardees ,there needed to be an increase in the frequency of meets for the Nation Educational Commission to discuss and manage the Scholarship Scheme appropriately .Therefore their sitting allowances increased as well.
Land Compensations – However unlike 2012, this year all School Land Compensation were no longer single handed handled by the Ministry but through a working committee comprising of Ministry of Finance, Ministry of Lands and Ministry of Education in which it had eased the work ,process and burden .There was only one School land compensation and that was for Tafea College.
VAT - Current tax charges for the department were under-budgeted;
Unplanned Travelling – These referred to the Council of Minister’s meetings held in Torba and Shefa which required delegation from the Ministry to part take in ,other international trips for meetings ,trainings and so on which was very costly when there were long list of delegation than what was planned and budgeted for initially ;
Tafea Education Office – New vehicle was purchased and freighted to the Tafea Education office of which this was not budgeted and planned for;
Freighting – There was the freighting of the three school buses was also unplanned for [‘as distributed by MOIA from after the ACP EU meeting which was held in Port Vila;
Utilities bills - including telephone and electricity were under-budgeted;
2014 Page 21
Outstanding – The meal allowance outstanding with Sucre Sale for 2012 for Vanuatu Government Scholarship Students in New Caledonia was paid this year. This payment was pending awaiting advice from the State Law.
Facilities Hire – For annual work plan meetings, reviews, the SEO conference, Unit retreats etc.
Refunds - There were refunds for teacher transfers ,for domestic allowances when funds were not available at the time of travelling , tuition/course fee refunds for scholarship students, medical refunds and so on ;
General materials - Other minor overspending occurred in areas of cleaning supplies, repair and maintenance materials, vehicles fuel, freight, equipment hire, stationery, and other rentals (this covers the JICA volunteer house rent and the Central School Chinese teacher as per agreement signed between MOE and Chinese Embassy / JOCV).
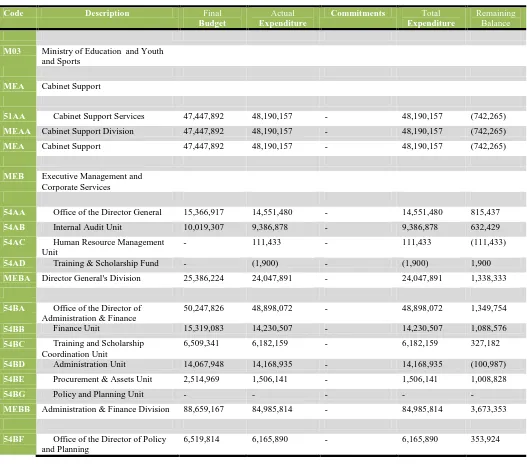
Table 6: Detail Cost Centre Budget and Actual for 2013
Code Description Final
Budget
Actual
Expenditure
Commitments Total
Expenditure
Remaining Balance
M03 Ministry of Education and Youth and Sports
MEA Cabinet Support
51AA Cabinet Support Services 47,447,892 48,190,157 - 48,190,157 (742,265)
MEAA Cabinet Support Division 47,447,892 48,190,157 - 48,190,157 (742,265)
MEA Cabinet Support 47,447,892 48,190,157 - 48,190,157 (742,265)
MEB Executive Management and Corporate Services
54AA Office of the Director General 15,366,917 14,551,480 - 14,551,480 815,437
54AB Internal Audit Unit 10,019,307 9,386,878 - 9,386,878 632,429
54AC Human Resource Management
Unit
- 111,433 - 111,433 (111,433)
54AD Training & Scholarship Fund - (1,900) - (1,900) 1,900
MEBA Director General's Division 25,386,224 24,047,891 - 24,047,891 1,338,333
54BA Office of the Director of
Administration & Finance
50,247,826 48,898,072 - 48,898,072 1,349,754
54BB Finance Unit 15,319,083 14,230,507 - 14,230,507 1,088,576
54BC Training and Scholarship
Coordination Unit
6,509,341 6,182,159 - 6,182,159 327,182
54BD Administration Unit 14,067,948 14,168,935 - 14,168,935 (100,987)
54BE Procurement & Assets Unit 2,514,969 1,506,141 - 1,506,141 1,008,828
54BG Policy and Planning Unit - - - - -
MEBB Administration & Finance Division 88,659,167 84,985,814 - 84,985,814 3,673,353
54BF Office of the Director of Policy
and Planning
2014 Page 22
54BG Policy and Planning Unit 8,366,500 7,366,490 - 7,366,490 1,000,010
54BH Facilities Unit 7,156,981 5,774,917 - 5,774,917 1,382,064
54BI Information and Communication
Technology Unit
20,503,119 20,369,634 - 20,369,634 133,485
54BJ VEMIS Unit 9,514,930 6,741,440 - 6,741,440 2,773,490
MEBC Policy & Planning Division 52,061,344 46,418,371 - 46,418,371 5,642,973
MEB Executive Management and Corporate Services
166,106,735 155,452,076 - 155,452,076 10,654,659
MEC School Education
54CA Office of the Director of School
Administration
11,747,198 11,713,488 - 11,713,488 33,710
54CB Primary Education Unit 12,135,540 10,589,932 - 10,589,932 1,545,608
54CC Secondary Education Unit 5,763,891 5,477,629 - 5,477,629 286,262
54CD Early Childhood Education Unit 2,242,667 2,046,989 - 2,046,989 195,678
54CE Torba Provincial Education Office 9,986,397 9,742,245 - 9,742,245 244,152
54CF Sanma Provincial Education Office 9,453,461 8,393,044 - 8,393,044 1,060,417
54CG Penama Provincial Education
Office
12,107,235 12,300,039 - 12,300,039 (192,804)
54CH Malampa Provincial Education
Office
11,563,876 11,768,514 - 11,768,514 (204,638)
54CI Shefa Provincial Education Office 14,120,648 14,462,627 - 14,462,627 (341,979)
54CJ Tafea Provincial Education Office 11,507,902 10,223,636 - 10,223,636 1,284,266
54CK Government Assisted Education
Authority Unit
7,886,514 7,755,489 - 7,755,489 131,025
54CL Training & Scholarship
Coordination Unit
15,580,860 15,854,333 - 15,854,333 (273,473)
54CM Technical & Higher Education Unit 2,515,746 2,444,238 - 2,444,238 71,508
54ED Malampa Primary Schools - - - - -
MECA School Administration Division 126,611,935 122,772,203 - 122,772,203 3,839,732
54DA Torba Secondary Schools 12,485,815 12,231,833 - 12,231,833 253,982
54DB Sanma Secondary Schools 156,088,876 154,613,513 - 154,613,513 1,475,363
54DC Penama Secondary Schools 45,756,566 44,425,490 - 44,425,490 1,331,076
54DD Malampa Secondary Schools 120,586,413 120,883,175 - 120,883,175 (296,762)
54DE Shefa Secondary Schools 285,107,977 284,943,382 - 284,943,382 164,595
54DF Tafea Secondary School 88,704,213 95,638,881 - 95,638,881 (6,934,668)
54DG Catholic Secondary Schools 171,325,213 177,888,058 - 177,888,058 (6,562,845)
54DH Protestant Secondary Schools 26,757,192 27,722,967 - 27,722,967 (965,775)
54DI Apostolic Secondary Schools 3,255,289 4,119,674 - 4,119,674 (864,385)
54DJ SDA Secondary Schools 42,888,503 45,455,853 - 45,455,853 (2,567,350)
54DK Church of Malanesia Secondary
Schools
32,648,960 35,500,498 - 35,500,498 (2,851,538)
54DL Church of Christ Secondary
Schools
24,476,021 27,333,649 - 27,333,649 (2,857,628)
54DM Prebyterian Secondary Schools 37,338,668 43,082,873 - 43,082,873 (5,744,205)
54DN Secondary Schools Grant 101,301,822 101,301,822 - 101,301,822 -
2014 Page 23
54DP Bahai'i Secondary Schools - 886,072 - 886,072 (886,072)
54DQ VFF Academy Secondary Schools - 922,879 - 922,879 (922,879)
54DR NTM Secondary Schools - 1,525,975 - 1,525,975 (1,525,975)
54ED Malampa Primary Schools - - - - -
54EE Shefa Primary Schools - - - - -
54FA Vanuatu Institute of Technology - 3,679,256 - 3,679,256 (3,679,256)
MECB Secondary Schools Division 1,151,654,328 1,185,048,593 - 1,185,048,593 (33,394,265)
54DO Secondary Teachers Incidentals - - - - -
54EA Torba Primary Schools 63,065,009 60,011,825 - 60,011,825 3,053,184
54EB Sanma Primary Schools 209,157,116 208,429,127 - 208,429,127 727,989
54EC Penama Primary Schools 154,856,793 155,857,156 - 155,857,156 (1,000,363)
54ED Malampa Primary Schools 178,072,908 171,488,712 - 171,488,712 6,584,196
54EE Shefa Primary Schools 360,928,879 372,274,902 - 372,274,902 (11,346,023)
54EF Tafea Primary Schools 190,068,256 181,690,653 - 181,690,653 8,377,603
54EG Catholic Primary Schools 266,991,650 266,518,203 - 266,518,203 473,447
54EH Protestant Primary Schools 43,263,842 41,245,173 - 41,245,173 2,018,669
54EI Apostolic Primary Schools 3,758,592 2,972,017 - 2,972,017 786,575
54EJ SDA Primary Schools 27,697,326 30,127,802 - 30,127,802 (2,430,476)
54EK Schools Solar Panel Maintenance - (35,296) - (35,296) 35,296
54EL Provincial Education Office
Maintenance
2,900,000 2,894,749 - 2,894,749 5,251
54EM Pre Schools Grant 4,000,000 4,000,000 - 4,000,000 -
54EN Primary Schools Grant 202,312,534 202,312,534 - 202,312,534 -
54EO Primary Teachers Incidentals 4,332,080 4,332,080 - 4,332,080 -
54EP Church of Melanesia Primary
Schools
2,054,708 2,553,639 - 2,553,639 (498,931)
54EQ Presbyterian Primary Schools 5,582,918 2,567,963 - 2,567,963 3,014,955
54ER Neil Thomas Ministry Primary
Schools
2,137,862 2,184,770 - 2,184,770 (46,908)
54ES Bahai'i Primary Schools - 2,665,312 - 2,665,312 (2,665,312)
54ET VFF Academy Primary Schools - 798,024 - 798,024 (798,024)
54EU Primary Scholarship Teachers - 427,810 - 427,810 (427,810)
54GC Curriculum Development Unit - - - - -
54HB Penama Primary Schools - 4,501 - 4,501 (4,501)
MECC Primary Schools Division 1,721,180,473 1,715,321,656 - 1,715,321,656 5,858,817
54DD Malampa Secondary Schools - 57,334 - 57,334 (57,334)
54DE Shefa Secondary Schools - - - - -
54EB Sanma Primary Schools - - - - -
54FA Vanuatu Institute of Technology 107,453,633 110,252,384 - 110,252,384 (2,798,751)
54FB Vanuatu Institute of Teacher
Education
80,328,551 79,915,303 - 79,915,303 413,248
54FC In Service Unit 17,050,692 16,980,153 - 16,980,153 70,539
54FD Vanuatu Government Scholarship
Fund
2014 Page 24
54HF Tafea Primary School - 827,130 - 827,130 (827,130)
MECD Technical & Higher Education
Division
813,457,882 697,217,351 - 697,217,351 116,240,531
54EG Catholic Primary Schools - - - - -
54EJ SDA Primary Schools - - - - -
54GA Office of the Director of School
Support Services
1,287,725 277,445 - 277,445 1,010,280
54GB Examination & Assessment Unit 22,143,137 20,141,708 - 20,141,708 2,001,429
54GC Curriculum Development Unit 25,135,420 22,852,414 - 22,852,414 2,283,006
54GD School Based Management Unit 15,119,009 14,142,565 - 14,142,565 976,444
54GE Zone Curriculum Advisors 78,648,122 78,953,018 - 78,953,018 (304,896)
MECE School Support Services Division 142,333,413 136,367,150 - 136,367,150 5,966,263
MEC School Education 3,955,238,031 3,856,726,953 - 3,856,726,953 98,511,078
MED Teaching Services Commission & Other Education Commissions and Councils
55AA Teaching Service Commission 99,400,602 99,403,210 - 99,403,210 (2,608)
MEDA Teaching Service Commission 99,400,602 99,403,210 - 99,403,210 (2,608)
55AB National Qualification &
Accreditation Council
1,602,584 1,556,923 - 1,556,923 45,661
55AC Vanuatu National Commission for
UNESCO
8,470,457 8,470,344 - 8,470,344 113
55AD National Education Advisory
Council
4,726,164 4,640,097 - 4,640,097 86,067
55AE National Education Commission 2,032,730 1,973,449 - 1,973,449 59,281
MEDB Other Education Commissions &
Councils
16,831,935 16,640,813 - 16,640,813 191,122
MED Teaching Services Commission & Other Education Commissions and Councils
116,232,537 116,044,023 - 116,044,023 188,514
MEF Teaching Service Commission
5501 Teaching Service Commission - 38,931 - 38,931 (38,931)
MEFB Teaching Service Commission - 38,931 - 38,931 (38,931)
MEF Teaching Service Commission - 38,931 - 38,931 (38,931)
116,232,537 116,082,954 - 116,082,954 149,583
M03 Ministry of Education and Youth and Sports
4,285,025,195 4,176,452,140 - 4,176,452,140 108,573,055
Grand Total 4,285,025,195 4,176,452,140 - 4,176,452,140 108,573,055
2014 Page 25
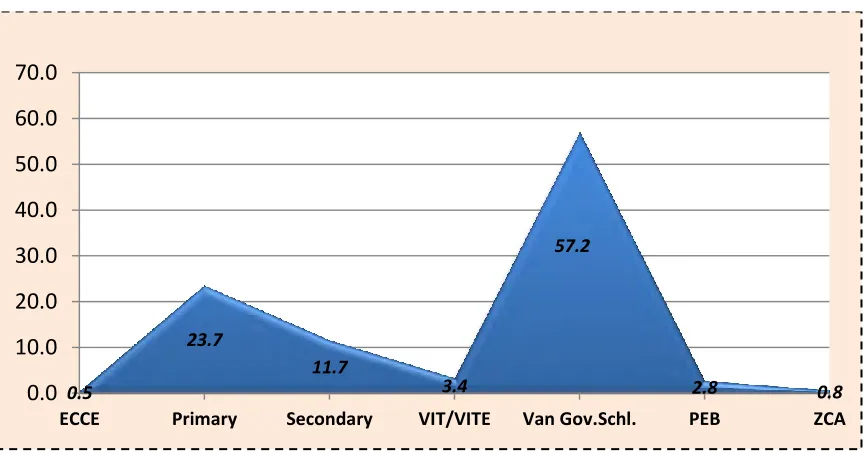
Figure 13: Actual Grant and Financing Allocation
The total actual cost of financing the different levels of the Education system, Institutions and the provincial offices amounted to 855.4 million vatu. The chart below will give a clearer picture of the share percentage of expenditure of the total.
Figure 14: Percentage (%) Share of Expenditure of Grants and Financing
Also as part of the grants payments was the two separate payments to Commonwealth of learning for Vanuatu Country Profile fee and the annual contribution to Commonwealth of learning by the Ministry which was an obligation .As part of other non-Profitable ,grant was paid to Vasanoc to help with the Inter-Provincial games that was held in the Torba Province.
The Ministry paid a grant as well to Vanuatu National Broadcasting Corporation (VBTC) as part of its annual contribution for using its radio programs to make announcements, school programs aired live, school grants recording and so on .About 2.2% was spent on the teachers termination and death benefits and of which all funds were made and managed by the Teaching Service Commission. The
4,000,000
202,312,534 100,034,322
29,248,699
489,185,047 24,000,000
6,650,538
ECCE Primary Secondary VIT/VITE Van.Gov.Schl. PEB ZCA
0.5
23.7
11.7
3.4
57.2
2.8 0.8
0.0
10.0
20.0
30.0
40.0
50.0
60.0
70.0
2014 Page 26
remaining 5.5% was spent on the Ministry’s administrative expenses. The pie chart below shows the major expenditure items under MOE Recurrent Budget for 2013.
Figure 15: Recurrent Expenditure 2013
Allocation of Government Grant
All government and government-assisted schools are paid grants twice each year, directly to their official bank account held with the National Bank of Vanuatu. No grants are paid to private schools which operate in the country. In 2013, the first tranche was paid in February and the second tranche paid in August. The total grant paid to educational institutions in 2013 was 537.1 million vatu of which 407.9 million vatu at primary level, 100 million vatu at the secondary level and 29.2 million vatu for VIT and VITE.As share percentage of total payments made for grants, 76 % were for primary schools while 19 % was for secondary schools and 5.4% was for the post-secondary levels.
Government-assisted education authorities (GAEA) schools receive equalfunding in terms of operational
grants and teachers personnel emoluments, as government schools. In addition, directors nominated by the education authorities and that are employed by the Teaching Service Commission are funded by the MOE. In 2013, the GAEA comprised of schools administered by the Apostolic Church, Catholic Mission, Church of Christ, Anglican Church of Melanesia, Bahai ,La Federation De L’ Ensignement Libre Protestant, Neil Thomas Ministry, Presbyterian Church, Protestant Church and Seventh Day Adventist Mission. Bahai is the new GAEA that was included recently for the first time with the School Grants Scheme of which after complying and meeting the school grants criteria and was eligible to receive the school grants in the second tranche allocation in August.
The grant allocation per student differed across the levels of education. For primary schools, years 1 to 6, the grant allocation was 8,900 vatu per student, for years 7 to 8 (in centre schools and secondary schools) was 3,668 vatu per student, and for years 9 to 13, the grant allocation per student was 8,125 vatu. The following table shows the total primary and secondary education actual grants expenditure to all respective education authorities around the country. The final column shows the total grant paid to each education authority at the primary and secondary level in 2013.
72.2% 11.4%
8.7% 5.5% 2.2%
Recurrent Expenditure 2013
Salaries, Wages, Allowances & VNPF Contributions
Government Scholarship Funds
Grants
MOE Administrative Costs
2014 Page 27
Table 7: Grant Summary in Vatu, 2013
AUTHORITIES PRIMARY TOTAL SECONDARY TOTAL TOTAL
# Years 1 - 6 PRIMARY Years 7 - 8 Years 9 -
14
SECONDARY ALL SCHOOLS
1 Torba Provincial Education Board
17,307,651 17,307,651 1,014,569 942,500 1,957,069 19,264,720
2 Sanma Provincial Education Board
61,459,840 61,459,840 4,115,496 9,246,250 13,361,746 74,821,586
3 Penama Provincial Education Board
40,712,160 40,712,160 1,690,948 2,803,125 4,494,073 45,206,233
4 Malampa Provincial Education Board
46,539,880 46,539,880 2,831,696 8,011,250 10,842,946 57,382,826
5 Shefa Provincial Education Board
89,548,459 89,548,459 7,052,831 18,894,625 25,947,456 115,495,915
6 Tafea Provincial Education Board
53,996,670 53,996,670 3,006,293 7,596,875 10,603,168 64,599,838
7 Apostolic Education Authority 2,411,900 2,411,900 231,084 560,625 791,709 3,203,609 8 Church of Melanesia Education
Authority
2,607,700 2,607,700 393,943 3,228,657 3,622,600 6,230,300
9 Bahai 0 194,404 820,625 1,015,029 1,015,029 10 Catholic Mission Education
Authority
66,454,520 66,454,520 3,755,298 8,750,625 12,505,923 78,960,443
11 La FELP Education Authority 8,833,492 8,833,492 348,460 731,250 1,079,710 9,913,202 12 Presbyterian Education
Authority
2,251,700 2,251,700 - 3,485,625 3,485,625 5,737,325
13 Seventh Day Adventist Education Authority
14,654,740 14,654,740 1,232,448 5,671,250 6,903,698 21,558,438
14 Neil Thomas Ministry Education Authority
1,032,400 1,032,400 124,712 528,125 652,837 1,685,237
15 Church of Christ Education Authority
-
-
414,484 2,356,250 2,770,734 2,770,734
TOTAL GRANT 407,811,112 407,811,112 26,406,666 73,627,657 100,034,323 507,845,436
Usually the school grants are paid in two tranches the first one in the beginning of the schooling year which is 60% of the total schools’ grants for the year and 40% in the second half of the year. However this year due to lack of sufficient cash flow, primary schools being the bulk of school grants payment were paid 40% as first tranche in the beginning of the year and were later paid the other 60% when there was sufficient available funds in August.
This was the case only for primary school grants payments as the secondary and post-Secondary school grants were paid accordingly which is 60% in the first tranche and the other 40% in the other half of the year.
2014 Page 28
7.
DEVELOPMENT BUDGET
In 2013, the Ministry received financial and technical support from donor partners to fund the activities contained within the Vanuatu Education Road Map (VERM) and the Grass root Projects (GGP).There were also funding and support provided through the New Zealand Small Basket projects, the French Embassy, Unicef, UNESCO and the Commonwealth of Learning through the University of the South Pacific. In total the Ministry received 537.2 million vatu to implement these activities of which 407.9 million was funded by AusAID, NZAID and UNICEF. There was a total of 104.2 million vatu which was supported by the other donor partners as mentioned earlier apart from VERM. These were the active projects.
There also the funds available for the inactive projects which amounted to a total of 25.1 million vatu. These projects were funded through UNESCO and New Zealand which have to be closed or reimbursed and this is summarized in the table below.
Table 8: Development Budget, 2013
Projects Budget Actual % Expenditure Remaining
balance Active Projects
1 VERM 407,864,473 362,180,109 88.8 45,684,364
2 UN, UNESCO, Unicef etc. 6,759,163 4,791,077 70.9 1,968,086
3 Japan GGP 52,052,017 50,644,003 97.3 1,408,014
4 NZ Small Basket 29,767,524 17,638,676 59.3 12,128,848
5 French 15,623,595 13,293,095 85.1 2,330,500
Sub -total 512,066,772 448,546,960 87.6 63,519,812
In-Active Projects
1 UN, UNESCO, Unicef etc. 7,641,514 7,504,803 98.2 136,711
2 NZ AID 17,450,463 11,783,751 67.5 5,666,712
Sub-total 25,091,977 19,288,554 76.9 5,803,423
Total 537,158,749 467,835,514 87.1 69,323,235
Source: Extracted from Vanuatu Government Smart stream Vision Report (03/04/2014)
2014 Page 29
Table 9: VERM Project Budgets vs. Actual - Active Projects
VERM Project
Project
Code
Description Revenue Actual Expenses
Commitment
Total Remaining
Balance
1 13Z25401 Internal Audit Unit 871,575 827,439 - 827,439 44,136
2 13Z25411 Policy and Planning Unit 2,375,746 2,006,680 - 2,006,680 369,066
3 13Z25415 Data Gathering Analysis and Dissemination 1,507,013 1,337,522 - 1,337,522 169,491
4 13Z25421 Coordination and Decentralization Schools 4,884,003 4,884,003 - 4,884,003 -
5 13Z25425 100 Maths Program 5,922,918 5,521,208 - 5,521,208 401,710
6 13Z25431 Leftimap ECE 33,059,291 31,540,717 - 31,540,717 1,518,574
7 13Z25432 Teacher Training 1,137,577 1,099,091 - 1,099,091 38,486
8 13Z25433 Vanuatu National Kindergarten Curriculum 5,888,479 4,491,813 - 4,491,813 1,396,666
9 13Z25434 Consultancy And Printing For ECCE 6,795,847 3,154,242 - 3,154,242 3,641,605
10 13Z25435 Vanuatu East-Asia Pacific Early Childhood
Development Standards Survey 2013
4,822,750 4,506,197 - 4,506,197 316,553
11 13Z25436 Early Childhood & Care 2013 to 2014 29,791,439 - 29,791,439
12 13Z25441 Complete Tafea College Water Supply - - -
13 13Z25442 Complete 2009 to 2011 Classrooms 224,190 224,190 - 224,190 -
14 13Z25443 Complete Tafea Cyclone Damaged Classrooms 23,208,178 23,208,178 - 23,208,178 -
15 13Z25451 Primary School Grants 206,605,399 206,605,399 - 206,605,399 -
16 13Z25452 Survey of Impact School Grants 4,916,560 1,888,723 - 1,888,723 3,027,837
17 13Z25461 VITE - - -
18 13Z25462 VITE Pre-Service Teacher Training - - -
19 13Z25463 Complete VITE Classrooms 7,769,651 7,769,651 - 7,769,651 -
20 13Z25464 VITE Teachers In-Service Training 20,097,844 19,557,415 - 19,557,415 540,429
21 13Z25471 EAU Prepare National Year 12 Examinations 5,993,450 5,577,181 - 5,577,181 416,269
22 13Z25472 EAU Implement Internal Assessment in Schools 6,074,945 5,234,075 - 5,234,075 840,870
23 13Z25481 Curriculum - - -
24 13Z25482 Years 1 to 3 Curriculum 835,119 633,048 - 633,048 202,071
25 13Z25483 Years 4 to 6 Curriculum 983,353 983,353 - 983,353 -
26 13Z25484 Years 1 to 6 Support Materials - - -
27 13Z25485 Years 1 to 6 Teacher Guide - - -
28 13Z25486 Years 7 to 10 Curriculum 10,774,127 10,035,127 - 10,035,127 739,000
29 13Z25487 Years 11 to 13 Curriculum 3,537,697 2,978,452 - 2,978,452 559,245
30 13Z25488 Years 11 to 13 Support Materials - - -
31 13Z25489 CDU Publications Process and Environment
Support and Training
540,146 540,146 - 540,146 -
32 13Z25491 SBM Management and Administration 15,158,140 14,619,648 - 14,619,648 538,492
33 13Z25492 SBM Communication Strategy 1,360,467 1,360,467 - 1,360,467 -
34 13Z25493 Education In Emergency 1,793,784 661,359 - 661,359 1,132,425
35 13Z25494 Inclusive Education 934,785 934,785 - 934,785 -
Total 407,864,473 362,180,109 - 362,180,109 45,684,364
2014 Page 30
Project Description Actual Actual Commitment Total Remaining
Balance
NZ Small Basket Projects
1 12H154 The Upgrade of Five Secondary Schools 442,850 442,850 - 442,850 -
2 12E655 Laruanu Community Kindergarten 3,999,471 3,381,584 334,761 3,716,345 283,126
3 13J354 Central School Enhancing Physical Wellbeing 4,900,000 - 4,900,000
4 12G254 Sanma Province Eli Jaelud Edukesen 2,855,000 2,855,000 - 2,855,000 -
5 12G658 Multipurpose Court for Onesua Presbyterian College
3,816,952 2,585,350 - 2,585,350 1,231,602
6 13J254 Saletui School Library 933,000 568,143 - 568,143 364,857
7 12G154 Malampa Province Kindy Teacher Training 2,731,653 2,731,653 - 2,731,653 -
8 13J154 Double Classroom Lenakel Harbour View Primary School
2,519,136 2,220,259 2,220,259 298,877
9 12F954 Port Narvin Pre School 1,137,692 987,306 - 987,306 150,386
10 13K954 Pinapow Primary School Desk 1,088,920 1,088,920 - 1,088,920 -
11 13J354 Central School Enhancing Physical Wellbeing 4,900,000 - 4,900,000
12 12H154 The Upgrade of Five Secondary Schools 442,850 442,850 - 442,850 -
Sub Total 29,767,524 15,083,656 2,555,020 17,638,676 12,128,848
French
1 13D554 License AES Francophone Au Vanuatu 11,445,330 11,445,330 - 11,445,330 -
2 13D354 Diplome Access Etudes Universitaires 1,847,765 1,847,765 1,847,765 -
3 13D454 Conception Et Reduction,Reforme Du Systeme Scolaire du Vanuatu
2,330,500 - 2,330,500
Sub Total 15,623,595 13,293,095 - 13,293,095 2,330,500
USP
1 13A154 Open School Concept Vanuatu 595,700 352,575 100,000 452,575 252,575
Sub Total 595,700 352,575 100,000 452,575 252,575
Commonwealth
1 13C154 Open Distance Learning (ODL) 1,238,563 984,702 - 984,702 253,861
Sub Total 1,238,563 984,702 984,702 253,861
UNICEF
1 13L654 ECCE Identification Tool 3,000,000 1,625,850 - 1,625,850 1,374,150
2 13L754 Pacific Regional Council For Early Childhood Care
129,400 - 129,400
Sub Total 3,129,400 1,625,850 - 1,625,850 1,503,550
UNESCO
1 13M354 Professional Standard For School Principals 1,795,500 1,727,950 - 1,727,950 67,550
Sub Total 1,795,500 1,727,950 - 1,727,950 67,550
Total 52,150,282 33,067,828 2,655,020 35,722,848 16,536,884
The actual budget for VERM in 2013 was 407.9 million vatu of which by the 31st of December only 88.8
2014 Page 31
Of the 35 activities to be implemented in VERM 2013 , over 24 of them have either over half way through implementation and nearing completion of the activities or have completed implementing. The percentage rating range for these activities was between 70 – 100 % of implementation.
The other 11 activities were in-complete and have been rolled over to 2014 to be completed by February as the VERM program is nearing its end .Any funds remaining will either be refunded back or reallocated to other priority activities to implement within VERM as agreed by the Pool partners and Ministry’s management.
The Pie chart will give a better picture of the VERM program as at the 31st of December 2013 in terms of
its performance
.
Figure 16: % of VERM Activities Implemented
The chart below shows VERM expenditures by different VERM Activities.
69%
31%
Complete or nearing
completetion
2014 Page 32 0% 10% 20% 30% 40% 50% 60% 70% 80% 90% 100% Internal Audit Unit
Policy and Planning Unit Data Gathering Analysis and Dissemination Coordination and Decentralization Schools 100 Maths Program Leftimap ECE Teacher Training Vanuatu National Kindergarten Curriculum Consultancy And Printing For ECCE Vanuatu East-Asia Pacific Early Childhood…
Early Childhood & Care 2013 to 2014 Complete Tafea College Water Supply Complete 2009 to 2011 Classrooms Complete Tafea Cyclone Damaged Classrooms Primary School Grants Survey of Impact School Grants VITE VITE Pre-Service Teacher Training Complete VITE Classrooms VITE Teachers In-Service Training EAU Prepare National Year 12 Examinations EAU Implement Internal Assessment in Schools Curriculum Years 1 to 3 Curriculum Years 4 to 6 Curriculum Years 1 to 6 Support Materials Years 1 to 6 Teacher Guide Years 7 to 10 Curriculum Years 11 to 13 Curriculum Years 11 to 13 Support Materials CDU Publications Process and Environment Support…
SBM Management and Administration SBM Communication Strategy Education In Emergency Inclusive Education
2014 Page 33
Figure 18: Budget and Actual for other small projects
14,400,677
52,052,017 47,217,987 15,623,595
12,295,880
50,644,003 29,422,427
13,293,095
0 10,000,000 20,000,000 30,000,000 40,000,000 50,000,000 60,000,000