International Journal of Biomedical Science and Engineering
2015; 3(2): 18-24Published online March 30, 2015 (http://www.sciencepublishinggroup.com/j/ijbse) doi: 10.11648/j.ijbse.20150302.12
ISSN: 2376-7227 (Print); ISSN: 2376-7235 (Online)
Analysis by Computer Simulation of Factors Affecting the
Extracellular Slow Wave Features of the Human Colon
Nicola Mirizzi
1, *, Giuseppe Riezzo
21
Department of Physics, University of Bari, Bari, Italy
2
Laboratory of Nutritional Pathophysiology IRCCS “S. de Bellis” National Institute for Digestive Diseases Castellana Grotte (BA), Italy
Email address:
[email protected] (N. Mirizzi)
To cite this article:
Nicola Mirizzi, Giuseppe Riezzo. Analysis by Computer Simulation of Factors Affecting the Extracellular Slow Wave Features of the Human Colon. International Journal of Biomedical Science and Engineering. Vol. 3, No. 2, 2015, pp. 18-24. doi: 10.11648/j.ijbse.20150302.12
Abstract:
The study reported in this paper analyses, by computer simulation, factors affecting the features (amplitude, frequency and phase lag) of the slow waves of the extracellular myoelectrical activity of the human ascending colon. It takes into account both the anatomic and functional aspects of the colon haustra, the myoelectrical dynamics of the cells and the geometric modification of haustra’ configuration. The variable sacculated geometry of the colon wall, segmented into typical haustra, has been represented by a sequence of truncated round ellipsoids. According to the propagation of the front of depolarization-repolarization of the cells, slow waves are simulated by the cyclic movement of an annular band polarized by electrical dipoles oriented perpendicularly with respect to the surface of the ellipsoids and activated by a pacemaker. The simulation highlighted that the amplitude of the slow waves physiologically depends on the dipole moment of cells, and the frequency depends on the velocity of the polarized annular band. In addition, the amplitude, the frequency and the phase lag also depend on the dynamic modification of the geometrical factors (colon length and haustrum radius). Furthermore, the simulation results showed that the shape of the slow wave and the amplitude of its peaks depend on the inter-electrode distance and on the electrode positioning with respect to the lower edge of ellipsoids.Keywords:
Computer Simulation, Extracellular Myoelectrical Activity, Human Colon1. Introduction
The human colon is a sacculated organ composed by a set of haustra brook apart by semilunar folds that retain digesta [1]. The structure with haustra and folds allows to obtain a considerable change in the internal volume of the organ with a relatively little contractions of the musculature, i.d. small changes of the surface area carry out an effective type of regulation of the digesta transit through the tract [1].The human colon has a thick circular muscle coat arranged in loosely packed bundles and is covered with a continuous thin coat composed by longitudinal musclar cells that thickens in three regions called taeniae coli. Contractile activities of the smooth muscle are regulated to produce the storage, the mechanical and chemical decomposition, and the transport of digesta. During the transport of digesta, muscles are stimulated to contract pushing the contents to the next haustrum. One of the control systems that regulates the chemical and mechanical actions that accomplish the digestive process is the myogenic control system involving
the electrical activity of the membrane of the smooth muscle cells [2]. While much is known about the mechanism underlying the origin and the regulation of the electrical activity of the stomach [3], such mechanisms are still poorly known regarding to the human colon. Most of our knowledge regarding the electrophysiology of the colon derives from experiments made on animals, such as the pig, the dog and the cat [4-7]. Studies on the cat colon [4] suggested that circular smooth muscle layer is the site of origin and propagation of electrical slow waves. Studies on the canine colon electrophysiology identified the cells that activate the electrical slow waves [5]. Now it is known that the interstitial cells of Cajal, organized as a network of specialized cells, are the pacemaker of the gastrointestinal electrical activity [8-9]. The available literature related to the understandings of the myoelectrical activity of the human colon, as recorded with
International Journal of Biomedical Science and Engineering 2015; 3(2): 18-24 19
irregular and time varying. In details, Sarna et al. [10-11] stated that in the ascending colon the dominant frequency component was in the range of 2.0−9 cpm with a mean value equal to 4.57 cpm; the signal level was in the range 0.1 – 0.5 mV/cm; waveforms picked up with adjacent electrodes were not phase locked. Condon et al. [12] stated that in ascending colon the slow waves are omnipresent and have three ranges of frequency: from 2.7±0.1 cpm to 4.3±0.2 cpm, from 10.09±0.2 cpm to 11.5±0.1 cpm, and from 25.5±2.3 cpm to 32.6±2.3 cpm. Taylor et al. [13] reported that the slow wave activity of the human colon is not present at all times and that two rhythms are present, a predominantly higher one at 6 to 12 cycles/min and one at a lower frequency at 2 to 4 cycles/min. However, little has been done to investigate the possible reasons for these irregularities.
The modeling approach can be useful to investigate, by simulation, the myoelectrical activity of the human colon and to analyze the factors affecting the extracellular slow waves. While many theoretical models have been developed for the slow wave of the human stomach and gastrointestinal tract [18-27], few have been developed for the slow wave of the colon [28-31]. First models to simulate the colonic slow waves were based on the relaxation oscillators that do not refer to the anatomy and physiology of the organ [28,29]. The basic modeling approach proposed here is based on the electric dipole model we used to simulate slow waves of the human stomach [20,21] and the cat colon [30-31]. This approach has proved to be useful in reproducing the characteristics of both the slow waves and the burst activity [21, 30]. The mathematical model was developed taking into account the geometrical characteristics of the human colon and the myoelectrical dynamics of cells. The ascending tract of the colon was taken into account.
The aim of this study was to analyze, by computer simulation, whether changes in the physiological factors (dipole moment and velocity of depolarization-polarization of cells) and in the geometrical factors (colon length and haustrum radius) may change the features (amplitude, frequency and phase lag) of slow waves as obtained with implanted bipolar electrodes. Furthermore, the effects on peaks’ amplitude due to the inter-electrode distance and to the electrode positioning with respect to the lower edge of the ellipsoids were analyzed.
2. Material and Methods
2.1. The Basics of the Model
The development of model takes into account the following conditions:
the haustrum wall was considered composed only by the circular muscle coat since it is the site where electrodes were implanted to record the slow waves with in vivo
and in vitro experiments [4-6];
the smooth muscle layer was considered as homogeneous. Its electrical permittivity is ε = ε0εr . ε0 is
the electrical permittivity in free space; Appendix C of
[32] reports the diagrams showing the value of the relative electrical permittivity εr and other properties of
many body tissue in the frequency range 1.0E+1 to 1.0E+11 Hz;
the colon haustra were represented by a set of truncated ellipsoids obtained by rotating a truncated ellipses (Figure 1);
Figure 1. Schematic representation of the colon haustra. The geometrical arrangement of the vectors , , , d , the size of the colon length lc, of the ellipsoids rh, of the annular band δ and the infinitesimal area segment dS are highlighted.
cells were represented by electric dipoles since they have a resting membrane potential due to a balanced ionic distribution across the cells’ membrane. The pacemaker potential generated by the interstitial cells of Cajal [33,34] upsets the balance and causes the inversion of polarity across the cells’ membrane by a periodic membrane depolarization;
the cells of the smooth muscle that, at a given instant, give rise to the membrane depolarization were spread in an annular band, δ−wide polarized by electric dipole perpendicularly oriented to the surface of the ellipsoid (Figure 1);
the distribution of the dipoles in the remaining part of the ellipsoids was considered as random so that it
x
y z
P
z
R
z
p + Q
Q q
y
f j
r
dS
xy xy
d
lc
rh
P R
r
dp r
20 Nicola Mirizzi and Giuseppe Riezzo: Analysis by Computer Simulation of Factors Affecting the Extracellular Slow Wave Features of the Human Colon
generated a null potential in each and every point of space;
the dipole density of the polarized annular band was taken as constant, The dipole moment of the infinitesimal area dS is = ;
since the depolarization activated by the cells of Cajal, after its initiation, propagates as a wave into the adjacent muscle layers [33,34], we considered that slow waves were generated by the periodic movement of the polarized annular band, δ−wide in the aborad direction from the bottom to the top of the ellipsoids (peristaltic movements).
For a segment of length lc, the velocity v to obtain the frequency f (measured in Hertz) was determined by the following relationship:
v = lc · f (1)
The electrostatic potential generated by an electric dipole of moment consisting of charges ±q separated by a distance λ at a generic point P in the space at a distance
ρfrom the dipole for ρ» λ is:
= 1 ∕ 4 ⋅ ∕ (2)
Consequently, from Fig 1, if is the dipole density of the annular polarized band and is the dipolemoment of the infinitesimal area dS, being = then:
r = ∬% !⋅"#$ (3)
Now expressing , , by means of the cartesian coordinates, after manipulation, the function to integrate becomes:
& ', Θ, * = + ,- '.− ' cos * − 3 ,-4 − ,- ,-cos Θ − 5 6 sin *9 + ,-4 + '4+ ,-4 + '.4− 23''.+ ,- ,-cos Θ − 5 69<4= ,-4 + '4><4
So for r , the following is obtained:
r, ? = 4 @ @ & ',Θ,* ' ΘAABC 4
Since the annular band moves along the ellipsoids surface, z = z(t), then:
r, ? = D E E +FGHAIJA KLM NJ3FGHO JFGH#GHKLM PJQ 6 MRS N9ATATP +FGHO BAOB#GHO BAIOJ43AAIBFGH#GHKLM PJQ 69$ O<=FGHO BAO>U O< A V BC
A V 4
(4)
2.2. Anatomical and Electrophysiological Parameter of the Colon
The values of the physical, anatomical and electro- physiological parameters of the ascending colon used to simulate the amplitude and the frequency of the slow waves are reported in Table 1 [8-15 35-36]. The length of the ascending colon and that of the greatest radius of haustra are the average values since those in the literature are not univocally defined.
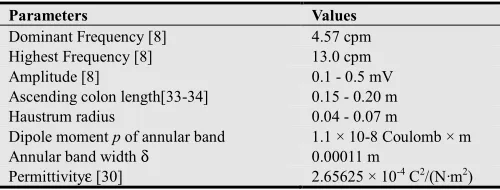
Table 1. Values of parameters used to simulate human colon slow waves.
Parameters Values
Dominant Frequency [8] 4.57 cpm
Highest Frequency [8] 13.0 cpm
Amplitude [8] 0.1 - 0.5 mV
Ascending colon length[33-34] 0.15 - 0.20 m
Haustrum radius 0.04 - 0.07 m
Dipole moment p of annular band 1.1 × 10⁻⁸ Coulomb × m
Annular band width δ 0.00011 m
Permittivityε [30] 2.65625 × 10⁻⁴ C2/(N·m2)
2.3. The Slow Wave Simulation
The slow waves as recorded with bipolar electrodes implanted in the muscular layer were simulated. The temporal variation in the electrical potential difference between two points on the surface of an ellipsoid, due to the periodic movement of the polarized annular band, was valued by performing a numerical Simpson integration in two dimension Eq. (4). To obtain slow waves plotted against time
it was assumed that the band moved according to the law z(t) = v⋅t.
To simulate the slow waves the values of the length lc=0.20 m and of the radius rh=0.04 m (anatomical parameters), the values of the dipole moment p = 1.1×10⁻⁸ Coulomb×m and of the annular band velocity v=0.0157 m/s (physiological parameters) were taken as reference. Furthermore the inter-electrode distance of 0.005 m and the distance of 0.0235 m, from the lower edge of the second ellipsoid, to which the electrodes were positioned were taken as reference.
To examine the factors that modify the amplitude, the frequency and the phase of the slow waves and their observability, during the simulation process, we varied the dipole moment p, the speed of the annular band v, the length
lc, and the largest radius rh of the ellipsoids. Furthermore, the inter-electrode distance, and the electrode positioning with respect to the lower edge of the ellipsoids were varied.
The simulation program was written in the MATLAB language.
3. Results and Discussion
International Journal of Biomedical Science and Engineering 2015;
Figure 2a. Waveform obtained by keeping constant parameters. The length lc was taken as equal to 0.20 taken as equal to 0.04 m. The inter-electrode distance 0.005 m. The probe was placed at the distance 0.0235 the second ellipsoid. The dipole moment was kept as 1.1× 10⁻⁸ Coulomb × m. The velocity of the annular The positive peak amplitude of the waveform is 0.5 mV. of the waveform is 12.76 s corresponding to the frequency
The effect on the peak amplitude due to of the dipole moment is shown in Figure 2b
Figure 2b. Effect of the change of the dipole moment amplitude. The waveform was obtained with lc = 0.20 inter-electrode distance as equal to 0.005 m. The electrodes distance 0.0235 from the lower edge of the second moment was equal to 1.5 × 10⁻⁸ Coulomb × m. The band was 0.0157 m/s. The positive peak amplitude of the
The amplitude of the peaks in Figure 2b is the peaks in Figure 2a. Therefore the simula that the increase in the dipole moment increases of the slow wave peaks. The changes in the moment did not modify the slow wave frequency.
The effect due to the variation in the size the slow wave amplitude is shown in Figure amplitude is time-varying since rh was varied of the annular band. The simulation highlighted amplitude decreased when rh increased. The 0.005 m in rh was sufficient to modify the can be seen by comparing the amplitudes of
International Journal of Biomedical Science and Engineering 2015; 3(2):
18-constant all the reference 0.20 m, the radius rh was distance was taken as equal to 0.0235 from the lower edge of as constant and equal to annular band was 0.0157 m/s. mV. The measured period frequency 4.7 cpm.
to the modification 2b.
value on the slow wave 0.20 m rh = 0.04 m, the electrodes were placed at the second ellipsoid. The dipole velocity of the annular the waveform is 0.72 mV.
is larger than that of simulation pointed out increases the amplitude value of the dipole frequency.
of the radius rh on ure 2c. The peaks’ varied in every cycle highlighted that the peaks’ The change of only peak amplitude as of the first and of the
second peak. The waveform is the colon tract was kept constant band.
Figure 2c. Effects of the modification in amplitude. Electrodes were placed at a edge of the second ellipsoid. The inter dipole moment was kept as constant and The velocity of the annular band was 0.0157 kept constant in every cycle of the annular changed. In the first cycle rh = 0.04 m. The is 0.53 mV, and the one of the negative peak = 0.045 m. The amplitude of the second of the negative peak is -0.57 mV. In amplitude of the third positive peak is peak is -0.28 mV. In the fourth cycle rh positive peak is 0.26 mV, and the one period of the waveform is 12.76 s corresponding
The effect on the slow wave modification of the inter-electrode Figure 3.
Figure 3. The effect of the variation in the amplitude. The waveform was obtained the inter-electrode distance was 0.002 0.0235 m from the lower edge of the second equal to 1.1 × 10⁻⁸ Coulomb × m. .The 0.0157 m/s. The positive peak amplitude
The simulation pointed out distance was 0.0025m. At a distance
-24 21
periodic since the length lc of constant in every cycle of the annular
in the size of radius rh on the slow wave a distance of 0.0235 m from the lower inter-electrode distance was 0.005 m. The and equal to 1.1× 10⁻⁸ Coulomb × m. 0.0157 m/s. The length lc = 0.20 m was annular band while the size of rh was The amplitude of the first positive peak peak is -0.66 mV. In the second cycle rh second positive peak is 0.44 mV, and the one In the third cycle rh = 0.075 m. The 0.17 mV, and the one of the negative = 0.06 m. The amplitude of the fourth of the negative peak is -0.38 mV. The corresponding to the frequency 4.7 cpm.
wave waveform due to the electrode distance is shown in
the inter-electrode distance on the peak obtained by keeping lc = 0.20 m, rh = 0.04m,. m and the probe was at the distance second ellipsoid. The dipole moment was .The velocity of the annular band was amplitude is 0.023 mV .
22 Nicola Mirizzi and Giuseppe Riezzo: Analysis by Computer Simulation of Factors Affecting the Extracellular Slow
positive peaks disappear and at a greater waveform was greatly modified and the positive peaks decreased.
The simulation pointed out that also positioning with respect to the lower edge changed the amplitude of the positive and negative best positioning was the distance 0.0235 edge of each ellipsoid. For distances smaller 0.0235 m the amplitude decreased. We think Figure 2c and in Figure 3 may suggest a possible the different values of the amplitude found results of the experiments made in vivo
researchers and suggest that to make comparable obtained from different experiments it standardize the electrode positioning and distance.
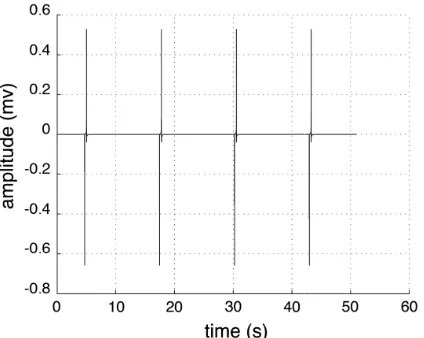
The effect on the slow wave frequency modification of the annular band velocity is 4. The period of the waveform in Figure 4 in Figure 2a. The simulation pointed out frequency decreased/increased when the velocity was decreased/increased. This is a because it indicates that, by increasing velocity, it is possible to simulate the burst
Figure 4. The effect on the frequency due to the modification band velocity. The waveform was obtained keeping lc the inter-electrode distance as equal to 0.005 m and placing distance 0.0235 from the lower edge of the second moment was equal to 1.1 × 10⁻⁸ Coulomb × m. The band was 0.00784 m/s. The period of the slow wave simulated waveform is 25.53s corresponding to the frequency
The effects due to the modification of the frequency and on the amplitude of slow wave Figure 5. Results highlighted that the decrease frequency to increase. The amplitude of the 5 is lower than that of the waveform in Fig was decreased rh was increased.
The effects due to the variation in the phase lag, measured as delay time between recorded with one probe on the surface ellipsoid and the waveform recorded with placed on the surface of the third ellipsoid
Nicola Mirizzi and Giuseppe Riezzo: Analysis by Computer Simulation of Factors Affecting the Extracellular Slow Wave Features of the Human Colon
greater distances the amplitude of the
also the electrode edge of the ellipsoids negative peaks. The m from the lower smaller or greater than ink that the results in possible reason for found comparing the
vivo from several comparable the results is important to the inter-electrode
frequency due to the is shown in Figure 4 is larger than that out that slow wave the annular band a significant result the annular band
activity.
modification in the annular lc = 0.20 m, rh = 0.04 m, placing the probe at the second ellipsoid. The dipole velocity of the annular as calculated from the frequency 2.35cpm.
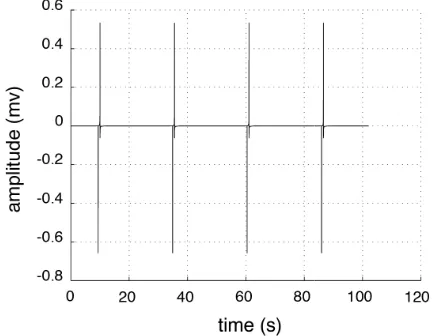
the length lc on the wave are shown in decrease in lc made the the waveform in Fig. Fig 2a since when lc
the length lc on the between the waveform surface of the second with another probe ellipsoid, are shown in
Figure 6.
Figure 5. Effects of modification in the Electrodes were placed on the surface length lc was shorten to 0.10 m so the electrode of the ellipsoid became 0.01175 m and 0.0025 m. The radius rh of the largest dipole moment was kept as constant and The velocity of the annular band was 0.0157 s, corresponding to the frequency 9.40cpm. lower edge and the inter-electrode decreased.
Figure 6. Effects due to the change in the the waveforms recorded from two different kept as constant and equal to 1.1× 10 annular band was 0.0157 m/s. The radius at the beginning of every cycle of the annular frequency of slow wave varied from time and rh = 0.04 m. In the second cycle, lc cycle, lc = 0.20 m and rh = 0.04 m. In 0.06 m. The delay between the first positive one plotted in solid line is 3.19 s; the delay plotted in dotted line and the one plotted between the third positive peak in dotted the delay between the fourth positive peak plotted in solid is 1.91 s. In the waveform between the first and the second positive between the second and the third positive the third and the fourth positive peak is dotted line, the time interval between the the one between the second and the third the third and the fourth peak is 9.48 s.
Nicola Mirizzi and Giuseppe Riezzo: Analysis by Computer Simulation of Factors Affecting the Extracellular Slow
the length lc on the slow wave frequency. surface of the second ellipsoid. The colon electrode distance from the lower edge and inter-electrode distance became circle was taken equal to 0.06 m..The and equal to 1.1× 10⁻⁸ Coulomb × m. 0.0157 m/s. The measured period is 6.38 9.40cpm. The electrode distance from the distance were decreased as lc was
the length lc on the phase lag between different ellipsoids. The dipole moment was 10-8 Coulomb × m. The velocity of the radius rh and the length lc were modified annular band so that the amplitude and time to time. In the first cycle, lc = 0.20 m lc = 0.16 m and rh = 0.03 m. In the third the fourth cycle, lc = 0.12 m and rh = positive peak plotted in dotted line and the delay between the second positive peak plotted in solid line is 2.56 s; the delay dotted line and the one in solid line is 3.19 s;
International Journal of Biomedical Science and Engineering 2015; 3(2): 18-24 23
Both probes were placed at a distance 0.0235 m from the lower edge of each ellipsoid. The inter-electrode distance was 0.005 m for both probes. The size of the radius rh and of the length lc were modified at the beginning of every cycle of the annular band. In Figure 6, a variable phase lag is observable between the waveform in solid line and the one in dotted line.
The waveforms in Figure 6 are not periodic since the time interval between contiguous peaks of the two waveforms varies from time to time. The variability of the amplitude, of the frequency and of the phase due to the modification of the length lc may suggest a possible reason why the main features of the slow waves, as recorded with implanted bipolar electrodes, were highly irregular and time varying [10-17].
We think that the simulation results are significant since pointed out that the slow wave features (amplitude and frequency) can change not only by the modification of the physiological parameters but also by the geometrical modification of the haustra due to functional reasons and for recording conditions. In fact the simulations indicated that:
the slow wave amplitude can be modified by varying only the dipole moment that physiologically is related to the number of cells that depolarize-polarize simultaneously in the annular band while maintaining constant the radius rh. Furthermore the amplitude can also be modified by changes in the radius rh of ellipsoids, without making any change in the dipole moment;
the frequency of the slow waves can be modified by varying only the speed of the annular band that physiologically is related to the velocity of the polarization-depolarization of cells while maintaining constant the length lc. Furthermore the frequency and the phase lag of slow waves can also be modified by changes in the length lc of the colon segment without making any change in the annular band speed;
the amplitude of the peaks of the slow waves was modified also by changes in the inter-electrode distance and in the positioning of the electrodes with respect to the lower edge of the ellipsoids.
The haustra of the colon were represented by ellipsoids since they are similar to them and since their equation may be easily implemented by computer.
The analysis performed in this work considers the abdominal medium homogeneous as this assumption greatly simplifies the modeling.
4. Conclusion
Our results showed that the model offers the possibility to simulate the most significant characteristics of the electrical activity accurately enough, including some specific patterns such as frequency, phase and amplitude variations therefore the aims of the study were reached.
All the results obtained pointed out that the model is effective to explain the complexity of the colon electrical activity and may suggest possible reason concerning the
discrepancy about the amplitude and the frequency reported from different researchers. Even if the recent tendencies are towards realistic but highly complex models, we think that the dipole model can be still useful since has the advantage of simplicity, allows to include the underlying physiology that is the basis of the motility mechanism and does not require large computing power as for some recent models but, it is feasible on a simple personal computer.
As future development we plan to utilize the model: a) to simulate the slow wave recordings made with electrodes placed on the abdominal surface and b) to analyzes the effects of the cutaneous electrode positioning and of the inter-electrode distance on the signal amplitude. Besides, we would verify the detectability with cutaneous electrodes of the frequency, amplitude and phase variations due to the changes of the sizes of ellipsoid axes.
Acknowledgements
The authors thank dr. ing. Roberto Mirizzi for his valuable technical advice in computer simulation and analysis.
References
[1] P. Langer and A. Takács. "Why are taeniae, haustra, and semilunar folds differentiated in the gastrointestinal tract of mammals, including man?," Journal of Morphology,259:308-315, 2004.
[2] N. Mañé and M. Jimenez. Interplay between myogenic pacemakers and enteric neurons determine distinct motor patterns in the rat colon. Neurogastroenterol Motil., 26:1508-1512,2014
[3] G. Riezzo, F. Russo, F. Indrio. Electrogastrography in adults and children: the strength, pitfalls, and clinical significance of the cutaneous recording of the gastric electrical activity. http://dx.doi.org/10.1155/2013/282757 Biomed Res Int. 2013;2013:282757.
[4] J. Christensen, R. Caprilli and G.F. Lund. "Electric slow waves in circular muscle of cat colon," American Journal of Physiology,217: 771-776, 1969.
[5] T.K. Smith, J.B. Reed, K.M. Sanders. "Origin and propagation of electrical slow waves in circular muscle of canine proximal colon," American Journal of Physiology,252: C215-224, 1987. [6] J.D. Huizinga, N.E. Diamont, T.Y. El Sharkawy. "Coordination of electrical activities in muscle layers of the pig colon," American Journal of Physiology, 252: G136-142, 1987. [7] M. Wienbeck. "The electrical activity of the cat colon in vivo. I.
The normal electrical activity and its relationship to contractile activity." Research in Experimental Medicine, 158: 268-79, 1972.
24 Nicola Mirizzi and Giuseppe Riezzo: Analysis by Computer Simulation of Factors Affecting the Extracellular Slow Wave Features of the Human Colon
[10] S.K. Sarna, B.L. Bardakjian, W.E. Waterfall, J.F. Lind. "Human colonic electrical control activity (ECA)," Gastroenterology, 78: 1526-1536, 1980.
[11] S.K. Sarna, W.E. Waterfall, B.L. Bardakjian, and J.F. Lind. "Types of human colonic electrical activities recorded postoperatively," Gastroenterology, 81: 61-70, 1981.
[12] R.E. Condon, V.E. Cowles, A.A. Ferraz, S. Carilli, M.E. Carlson, K. Ludwig, E. Tekin, K. Ulualp, F. Ezberci, Y. Shoji, P. Isherwood, C.T. Frantzides, and W.J. Schulte. "Human colonic smooth muscle electrical activity during and after recovery from postoperative ileus," American Journal of Physiology, 269: G408-G417, 1995.
[13] Taylor I, Duthie HL, Smallwood R, and Linkens D. "Large bowel myoelectrical activity in man," Gut, 16: 808-814, 1975. [14] R.C. Gill, K.R. Cote, K.L. Bowes, and Y.J. Kingm., "Human
colonic smooth muscle: electrical and contractile activity in vitro," Gut, 27: 293-299, 1986.
[15] G. Riezzo, M.A. Maselli, F. Pezzolla, J. Thouvenot, and I. Giorgio."In vitro electro-mechanical activity of human colon. Simultaneous recording of the electrical patterns of the two muscle layers," Archives Internationales de Physiologie, de Biochimie, 100: 93-100, 1992.
[16] S. Sarna, P. Latimer, D. Campbell, and W.E. Waterfall. "Electrical and contractile activities of the human rectosigmoid," Gut, 23: 698-705, 1982.
[17] C.J. Stoddard, H.L. Duthie, R.H. Smallwood, and D.A. Linkens. "Colonic myoelectrical activity in man: comparison of recording techniques and methods of analysis," Gut, 20: 476-483, 1979.
[18] D.A. Linkens and S.P. Datardina. "Frequency entrainment of coupled Hodgkin-Huxley-type oscillators for modelling gastrointestinal electrical activity," IEEE Transactions on Biomedical Engineering, 24: 362-365, 1977.
[19] S.K. Sarna, E.E. Daniel and Y.J. Kingma. "Simulation of the electric control activity of the stomach by an array of relaxation oscillators," The American Journal of Digestive Diseases, 17: 299-310, 1972.
[20] N. Mirizzi, R. Stella, and U. Scafoglieri."A model of extracellular waveshape of the gastric electrical activity," Medical & Biological Engineering & Computing, 23: 33-37, 1985.
[21] N. Mirizzi, R. Stella, and U. Scafoglieri."Model to simulate the gastric electrical control and response activity on the stomach wall and on the abdominal surface," Medical & Biological Engineering & Computing, 24: 157-163, 1986.
[22] B.O. Familoni, T.L. Abell, and K.L. Bowes. "A model of gastric electrical activity in health and disease," IEEE Transactions on Biomedical Engineering, 42: 647-657, 1995.
[23] A. Irimia and L.A. Bradshaw. "Theoretical ellipsoidal model of gastric electrical control propagation," Physical Review E: Statistical, Nonlinear, and Soft Matter Physics, 68: 051905, 2003.
[24] A. Irimia and L.A. Bradshaw. "Ellipsoidal electrogastrographic forward modelling," Physics in Medicine & Biology, 50: 4429-4444, 2005.
[25] M.L. Buist, L.K. Cheng, R. Yassi, L.A. Bradshaw, W.O. Richards and A.J. Pullan."An anatomical model of gastric system for producing bioelectric and biomagnetic fields," Physiological Measurement, 25: 849-861, 2004.
[26] A. Pullan, L. Cheng, R. Yassi, and M. Buist. "Modelling gastrointestinal bioelectric activity," Progress in Biophysics & Molecular Biology, 85: 523-550, 2004.
[27] L.A. Bradshaw, W.O. Richards, J.P. WikswoJr. "Volume conductor effects on the spatial resolution of magnetic fields and electric potential from gastrointestinal electrical activity," Medical & Biological Engineering & Computing, 39: 35-43, 2001.
[28] B.L. Bardakjian, and S.K. Sarna. "A computer model of human colonic electrical control activity (ECA)," IEEE Transactions on Biomedical Engineering, 27: 193-202, 1980.
[29] B.L. Bardakjian, and S.K. Sarna, N.E. Diamant. "Composite Synthesized Relaxation Oscillators: Application to Modelling of Colonic Electrical Control and Response Activity," Neurogastroenterology& Motility. 2: 109-116, 1990.
[30] N. Mirizzi, M.A. Strangio, R. Mirizzi, and G. Riezzo."Mathematical model to simulate the extracellular myoelectrical activity of the cat colon," Medical Engineering & Physics,. 31: 145-152, 2009.
[31] N. Mirizzi, R. Mirizzi, G. Riezzo."Computer simulation based on the electric dipole model: Analysis of the factor affecting the amplitude and the waveform of the cat colon electrical control activity," Journal of Medical and Biological Engineering, 30: 35-40, 2010.
[32] C. Gabriel, S. Gabriel. Compilation of dielectric properties of body tissues at RF and microwaves frequencies. London: King's College; 1996.
[33] K.M. Sanders. "A case for interstitial cells of Cajal as pacemakers and mediators of neurotransmission in the gastrointestinal tract," Gastroenterology, 111: 492-515, 1996. [34] G. David, S. Hirst, H. Suzuky. "Involvement of interstitial cells
of Cajal in the control of smooth muscle excitability," Journal of Physiology, 576(Pt3): 651-652, 2006.
[35] F.H. Netter. Atlante di anatomia umana, terza edizione, ElsevierMasson, 2007. ISBN 978-88-214-2976-7