Published online July 30, 2014 (http://www.sciencepublishinggroup.com/j/ajep) doi: 10.11648/j.ajep.20140304.11
ISSN: 2328-5680 (Print); ISSN: 2328-5699 (Online)
Factors influencing solid waste generation and
composition in urban areas of Tanzania: The case of
Dar-es -Salaam
Jonas Petro Senzige
1, Daniel Oluwole Makinde
2, Karoli Nicolas Njau
3, Yaw Nkansah-Gyeke
11
School of Computational and Communication Science and Engineering - The Nelson Mandela African Institution of Science and Technology (NM-AIST), Arusha Tanzania
2
Faculty of Military Science, Stellenbosch University, Private Bag X2, Saldanha 7395, South Africa 3
School of Materials, Energy, Water and Environmental Science, The Nelson Mandela African Institution of Science and Technology (NM-AIST), Arusha Tanzania
Email address:
senzigej@nm-aist.ac.tz (J. P. Senzige)
To cite this article:
Jonas Petro Senzige, Daniel Oluwole Makinde, Karoli Nicolas Njau, Yaw Nkansah-Gyeke. Factors Influencing Solid Waste Generation and Composition in Urban Areas of Tanzania: The Case of Dar-es-Salaam.American Journal of Environmental Protection.
Vol. 3, No. 4, 2014, pp. 172-178. doi: 10.11648/j.ajep.20140304.11
Abstract:
Solid waste characterisation study was carried in Dar-es-Salaam to quantify the waste generation rates and composition. By studying solid waste generation trends for three socioeconomic statuses, it was found that the solid pa capita generation rate decreases with decreasing socioeconomic status. Solid waste compositions also exhibited variations due to socioeconomic status. It was also found that solid waste generation and population and GDP growth are positively correlated. Furthermore, a comparison of the results with data from previous studies and data from other urban centres in East Africa indicated that solid waste composition in Dar-es-Salaam has been changing over time. This article presents the findings and elucidates factors influencing solid waste generation and composition.Keywords:
Population Growth, GDP Growth, Solid Waste Generation and Composition, Socioeconomic Status, Dar-es-Salaam1. Introduction
Organised solid waste management practices were first implemented in the ancient city of Mahenjo-Daro in the Indus Valley by 2000 BC [1]. According to [2], by 500 BC, the Greeks had both issued a decree banning waste disposal in the streets and setup the first Western-type ‘municipal dumps’ while the Chinese had ‘disposal police’ to enforce disposal laws by 200 BC. The primary purpose for solid waste management strategies is to address the health, environmental aesthetic, land use, resource, and economic concerns associated with improper solid waste management [3-5]. In the modern world, quantification and characterisation are the most important ingredients of any sound solid waste management system. Thorough knowledge of the characteristics of the solid waste is as important as knowing the quantities generated. Solid waste management systems usually handle large quantities of solid waste and it is therefore important to have detailed information on
quantification and characterisation for proper handling at different stages of the system [6]. In their review paper, [6] contend that “... there should be reliable information on solid waste quantification and characterisation, which is the prime requirement of the system”. It is after having a clear picture on the anticipated amount and nature of solid waste to be generated, marshalling of the resources (financial, human, equipment and technologies) in managing the waste can be done. Characterisation provides data on the type of waste generated and thus determines the methods and techniques for disposing them. Furthermore, with data on the type of solid waste, various management options can be explored. For example, investment in recycling, reuse, composting, and energy generation could reduce the amount of waste that the authorities have to dispose off and at the same time creating employment.
quantification have been done worldwide for the purpose of understanding composition of solid waste. Examples include the works of [6-18]. Specific studies on Dar-es-Salaam solid waste management system and characterisation have been carried out by [19- 22].
Furthermore, [6] point out that it is necessary to have detailed information on quantification and characterisation of solid waste for proper handling of solid waste at different levels of the solid waste management system. Thus any proper solid waste management system should inevitably take into consideration the type of waste generated. It is the type and not the quantity that determines the methods and techniques of disposing solid waste. This view is shared by [23] who contend that the type of decision making that leads to adequate solid waste management should be based on sound understanding of composition. Furthermore, [13] noted that characterisation of solid waste generation is fundamental for adequate decision making for a solid waste strategy in a city. It thus clear that without thorough knowledge of the composition, the solid waste is bound to be improperly disposed. In regard to this [8] noted that “… characterisation of solid waste streams and the estimation of solid waste generation rates are critical data required to propose any sustainable and viable alternative solutions to municipal solid waste management”.
Although solid waste management is an important environmental challenge the world over, the problem is bigger in the developing world [24-29] where the waste produced by burgeoning cities is overwhelming local authorities and national governments alike [30-31]. Institutional weaknesses, lack of financial resources, improper choice of technology and public apathy [19, 28, 31- 32] are normally cited as major setbacks to proper solid waste management. Rapid urbanisation [6, 21 and 33] is also said to compound the problem. In developed countries there exist data from long term characterisation studies and monitoring solid waste streams both at the local and national level [15]. However, such data are virtually inexistent in developing world. An example is the African Development Bank report [25]. Governments on the national and local level in countries with less developed economies generally do not have funding for performing such expensive studies like the monitoring of the solid waste stream [15]. If any, the funds are usually from foreign donors or nongovernmental organisations and are usually scarce and limited in scope. However, [15] suggest that periodic short-term (1-2 weeks) studies could be a possible solution in the absence of comprehensive scientifically valid data needed to develop an efficient solid waste management system. Such studies do not require significant resources or funding. Implicitly, it means developing countries can carry out such studies within the confines of their budgets and available resources. In this paper, we identify and elucidate the factors influencing solid waste generation and composition in the three municipalities (Kinondoni, Ilala and Temeke) of Dar es Salam and compare the results with previous researches and data from other East African countries.
1.1. Description of the Research Area
The Dar-es-Salaam city (Figure 1) is located between latitudes 6.36 degrees and 7.0 degrees to the south of Equator and longitudes 39.0 and 33.33 to the east of Greenwich. It is bounded by the Indian Ocean on the east and by the Coast Region on the other sides. Administratively, the city of Dar-es-Salaam is divided into three municipalities of Kinondoni, Ilala and Temeke made up by 73 wards and inhabiting nearly ten percent of the total population of Tanzania (4,364,541 out of 44,928,923) according to the 2012 population census.
It is generally hot and humid throughout the year with an average temperature of 29ºC. The hottest season is from October to March during which temperatures can rise up to 35ºC. It is relatively cool between May and August, with temperature around 25ºC. Humidity is around 96% in the morning and 67% in the afternoon. The climate is also influenced by the southwesterly monsoon winds from April to October and northwesterly monsoon winds between November and March.
Figure 1. Map of Dar es Salaam (Dar Profile, 2004)
1.2. The Current Situation
the three municipalities. These figures show that serious planning is essential if Dar-es-Salaam will ever be clean and solid waste characterisation and quantification are important aspects of that planning process.
Table 1. Current Solid waste generation in Dar es Salaam (WB, 2012)
Municipality Amount Generated (Tonnes/day)
Amount Collected (Tonnes/day)
Collection Rate (%)
Ilala 1,100 430 39
Temeke 1,035 280 27
Kinondoni 2,026 823 41
Total 4,161 1,533 37
2. Methodology
In carrying out the research, the methodology used by [13] was employed. It involved sorting and weighing directly from the household where solid waste is generated. According to [35], this is an established method for characterising solid waste. The methodology involved the following steps: 1) classifying the population by socioeconomic status; 2) selecting households for the study; 3) determining the number of samples; 4) sorting and quantifying the solid waste types and 5) analysing the results
2.1. Classifying the Population by Socioeconomic Status
Classification of the population in socioeconomic status was done using socioeconomic indices for the 73 wards making the three municipalities of Dar-es-Salaam. Socioeconomic status is commonly conceptualized as the social standing or class of an individual or group. It connotes one’s position in the social hierarchy, how the hierarchy is structured, and very often one’s consequent life chances. In other words, socioeconomic status indicates one’s access to collectively desired resources, be they material goods, money, power, friendship networks, healthcare, leisure time, or educational opportunities. Invariably, socioeconomic status is often measured as a combination of education, income, and occupation. Table 2 shows socioeconomic indices used to classify the Dar-es-Salaam wards. A total of nine wards, three from each municipality, were selected for the three municipalities.
Table 2. Socioeconomic indices used (DCC, 2012)
Socioeconomic Index Status
<170 Low
170-180 Middle
>180 High
2.2. Selecting Households for Study
A total of 639 households were selected from three municipalities for the three socioeconomic statuses of HIGH, MIDDLE and LOW. The number of households was selected proportionally depending on the population and total number of households in each category. 229 households were selected from Kinondoni, 253 from Ilala and 157 from Temeke. Accordingly, 111 were selected from high socioeconomic status, 218 from the middle socioeconomic status and 310 from the low socioeconomic status as indicated in Table 3.
2.3. Determining the Number of Samples
The choice of number of samples was solely influenced by solid waste collection trend and the heterogeneity of the solid waste. Moreover, in the literature there is no specific method used for specifying the number of samples for solid waste characterisation [8]. Since solid waste was being collected from households once a week, we decide to sort and weigh the solid waste generated from each household once a week (a day before collection day) for seven consecutive weeks making it a total of 4,473 (777 from high socioeconomic status, 1,526 from middle and 2,170 from low socioeconomic status) samples from the 639 households. Although according to the method recommended by [36] only thirty samples are adequate, we were of the opinion that its reliability may be compromised especially when the samples are taken from various solid waste generating sources and not at dumpsites. Therefore our approach was well-suited for the purpose of this study.
2.4. Sorting and Quantifying the Solid Waste Types
The solid waste was hand sorted and classified into eight categories shown in Table 4. Sorting was based on the types found most often and those most commonly reported in previous studies [14]. The procedure adopted was the same all for waste found in the 639 households for all the seven weeks.
Table 3. Demographics of the studied areas and selected samples
Municipality Wards
Population (selected
wards) Households
High socioeconomic status households
Middle
Socioeonomic Status Households
Low Socioeonomic Status Households
Total Sample Total Sample Total Sample Total Sample Total Sample
Kinondoni 3 177,599 817 46,509 229 12544 61 14907 72 19056 96
Ilala 3 192,855 888 51,365 253 2792 13 19669 95 28904 145
Temeke 3 127,656 587 31828 157 7624 37 10367 51 13828 69
Table 4. Classification of solid waste types
Type of waste Waste Components
Organic waste food waste, garden trimming, wood.
Plastics
any type of polymer content including materials such as PETE, HDPE, LDPE, PVC, PP, and other plastic materials such plastics bags and plastic bottles
Glass any type of glass bottles, containers, sheets and any other type of glass including broken bottles Paper and
cardboards
any type of paper such as newspapers, wrapping materials, paper packaging materials etc.
Metals any scrap metal and aluminum cans
eWaste anything electronic such as mobile phones, batteries, TV, computer and computer accessories etc. Textile any cloth like material
Others any other materials whose nature could not be immediately determined.
3. Results and Discussion
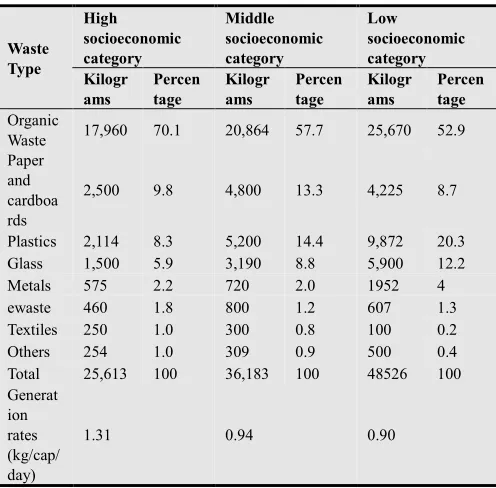
Tables 5 and 6 present the waste generation and composition for each of the three socioeconomic statuses and the average generation and composition. Table 5 presents the results grouped according to socioeconomic status and proportional composition of the various types of waste in terms of percentages. It was found that there is a significant difference in solid waste generation among the three socioeconomic statuses. In the overall, the per capita waste generation was found to increase with improving socioeconomic status with HIGH socioeconomic status generating 1.31 kg/cap/day with the MIDDLE status and the LOW status generating 0.94 and 0.9 kg/cap/day respectively. In terms of composition there was a clear trend for organic waste, textiles and other wastes indicating increasing composition with improvement in socio economic status while plastics and glass showed the opposite trend.
Table 5. Solid Waste Generation by socioeconomic category
Waste Type
High socioeconomic category
Middle socioeconomic category
Low socioeconomic category Kilogr
ams
Percen tage
Kilogr ams
Percen tage
Kilogr ams
Percen tage Organic
Waste 17,960 70.1 20,864 57.7 25,670 52.9
Paper and cardboa rds
2,500 9.8 4,800 13.3 4,225 8.7
Plastics 2,114 8.3 5,200 14.4 9,872 20.3
Glass 1,500 5.9 3,190 8.8 5,900 12.2
Metals 575 2.2 720 2.0 1952 4
ewaste 460 1.8 800 1.2 607 1.3
Textiles 250 1.0 300 0.8 100 0.2
Others 254 1.0 309 0.9 500 0.4
Total 25,613 100 36,183 100 48526 100
Generat ion rates (kg/cap/ day)
1.31 0.94 0.90
The compositions for organics, textiles and other wastes were 70.1%, 57.7% and 52.9% for HIGH, MIDDLE and LOW socioeconomic status respectively. The possible explanation for such difference can be in terms of the differences in consumption patterns derived from the differences in income levels. In addition the high socioeconomic status can afford the luxury of having a garden, trimming of which contributes to organic waste significantly and can afford to throw away more textiles and other wastes. The opposite trend for the plastics and glass may be explained by the fact that reuse and sorting for these items is higher in the LOW category than in the HIGH category. Most of these items do not simply find their way into the waste stream as they are scavenged at the point of generation.
Paper and cardboards, metals and ewaste did not show a clear trend with socioeconomic status. It was rather strange that the percentage of metals in the waste from LOW category was the highest while metal scavenging is usually expected. The ewaste composition in the waste from HIGH category was the highest as would be expected due to more use of e-products by this category. However, for the MIDDLE and LOW categories the difference was small. Surprisingly the MIDDLE category showed the highest composition of paper and cardboards (13.3%).
Table 6. Total Solid waste generation by the three socioeconomic groups
Type of waste Kilograms Percentage
Organic Waste 64,494.00 58
Paper and Cardboards 11,525.00 10
Plastics 17,186.00 16
Glass 10,590.00 9
Metals 3,247.00 3
ewaste 1,867.00 2
Textiles 850.00 1
Others 1,063.00 1
Total 110,822.00 100
Generation rate (kg/cap/day) 0.99
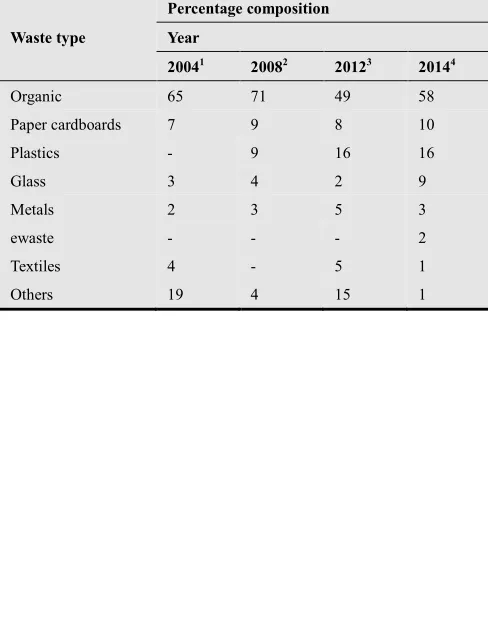
We can see that percentages for plastics, paper and cardboards and glass increasing, implying that peoples’ lifestyles are changing. On the other hand metals still account for lower percentages, not because they are not discarded but because it is a big recycling business taking away metals from waste stream. Similarly, plastics could also account for higher percentages had it not been that plastic containers are collected for recycling. For example, a single collection point in Mwenge in the Kinondoni municipality, on average, sells 541.3 kilograms of plastic containers daily. This is equivalent to nearly 200 tons a year and there are many such points that collect and sell plastic containers.
The changing characteristics of solid waste composition and increasing quantity of solid waste generated can be attributed to improving economy of the Dar-es-Salaam city. As indicated in Figure 2 the Regional Gross Domestic Product (RGDP) has been growing and thus influencing peoples’ consumption behaviour. In fact, there is positive correlation between daily solid waste generation in Dar-es-Salaam and the GDP and population growth as illustrated in Figure 3. These results are in agreement with the observation by [37] that total waste generation by the urban councils is associated with national GDP per capita.
Table 7. Solid waste composition for various years (DCC, 2004, Okumu, 2012, WB, 2012, Authors, 2014)
Waste type
Percentage composition
Year
20041 20082 20123 20144
Organic 65 71 49 58
Paper cardboards 7 9 8 10
Plastics - 9 16 16
Glass 3 4 2 9
Metals 2 3 5 3
ewaste - - - 2
Textiles 4 - 5 1
Others 19 4 15 1
Figure 2. Annual GDP of Dar-es-Salaam from 2001 – 2012 in Tanzanian Shillings (N Bs, 2013)
Table 8. Population and GDP growth and the corresponding SW generation (NBS, 2012 and Dar City profile)
Year Population GDP (million TSHS)
SW Generation (tons/day)
2001 2,356,263 1,530,654 2300
2002 2,487,288 1,958,790 2400
2003 2,564,394 2,114,612 2500
2004 2,642,708 2,397,247 2600
2005 2,721,926 2,780,274 2800
2006 2,801,675 3,266,242 3100
2007 2,881,548 3,959,818 3200
2008 2,961,150 4,848,914 3400
2009 3,040,118 5,428,503 3500
2010 3,118,132 6,265,440 3800
2011 3,194,903 7,571,790 4200
Figure 3. Daily solid waste generation versus annual GDP and population for Dar-es-Salaam (NBS, 2012; DAR CITY PROFILE)
That is solid waste generation is positively correlated to both population and GDP growth. Implicitly, knowing the population and the GDP, solid waste generation for Dar-es-Salaam can be computed at any point in time.
The GDP growth is reflected in reduced poverty as indicated in Table 9. The decreased poverty; resulting from increased GDP has a bearing on the consumption behaviour of the Dar-es-Salaam city’s population. This, in return, affects the quantity and type of solid waste generated.
Table 9. Trend of poverty indicators for Dar es Salaam (NBS, 2012)
Year Food Poverty Basic Need Poverty
1991/1992 13.6 28.1
2000/01 7.5 17.6
2011/12 1.0 4.2
Table 10. A comparison of solid waste generation in East African urban areas (KSEO, 2013; Scheinberg et al, 2011; Okot-Okumu, 2012)
Type of Waste Dar-es-Salaam Kigali Moshi Kampala Jinja Lira Nairobi
Organic 58 76.7 65 77.2 78.6 68.7 65
Paper and Cardboards 10 16 9 8.3 8 5.5 6
Plastics 16 1.5 9 9.5 7.9 6.8 12
Glass 9 1.4 3 1.3 0.7 1.9 2
Metals 3 2 2 0.3 0.5 2.2 1
eWaste 2 - - - -
Textile 1 2 - - - - -
Others 1 0.4 12 3.4 4.3 14.9 14
4. Conclusion
Solid waste characterisation study done in the three municipalities of Dar-es-Salaam has indicated that solid waste generation and composition is highly dependent on population and socioeconomic status of the population. It is clear from this study that knowing the population and the weighted average socioeconomic status of a city can enable calculation of the solid waste generation and the composition. The per capita waste generation rates obtained are 1.31kg/cap/day for high followed by the middle and low socioeconomic statuses with 0.94kg/cap/day and 0.9kg/cap/day respectively. Moreover, the solid waste composition exhibit different characteristics for different socioeconomic statuses. That means that the peoples’ socioeconomic status (usually measured by a combination of education, income and occupation) is a determining factor for solid waste generation rates and composition. It was further found, using a multiple regression technique, that there is positive correlation between solid waste generation rates and GDP and population growth. Implicitly, it means once someone knows the population and GDP, the amount of solid waste can easily be computed.
Furthermore, a comparison with data previous researches and other urban centres in East Africa revealed that solid waste composition for Dar-es-Salaam is changing very fast. This trend calls for regular short-term [15] characterisation studies to determine the solid waste composition data to aid in the planning of solid waste management strategies. That notwithstanding, organic waste and other recyclables such as plastics, metals and glass account for larger percentages of the solid waste composition. Thus, encouraging and formalising recycling and composting would greatly reduce the amount of solid waste that has to be disposed hence reducing the cost that has to be incurred. Furthermore such formalisation will attach an economic value to recyclable materials and hence encourage source separation as required by the Environmental Management Act [38] and the Public Health Act [39]. The current trend where the recyclables like plastic containers, glass bottles and metals including cans are either recovered by scavengers or by solid waste collectors along the way to dumpsites ends up littering other waste on the road which eventually find their way in trenches. Similarly, initiatives like KILIMO KWANZA could benefit from composting organic waste
which makes up 58% of the total waste generated as shown in Table 6.
References
[1] Worrel WA and Vesilind PA (2012) Solid Waste Engineering, second ed. Cengage Learning, Stanford, CT.
[2] Melosi MV (1981) Garbage in the Cities: Refuse, Reform, and Environment, 1880-1980, first ed. Texas A&M University Press, College Station, Tex.
[3] Henry RK, Yongsheng Z and Jun D (2006) Municipal solid waste management challenges in developing countries – Kenyan case study. Waste Management 26(1), 92-100. [4] Nemerow NL (2009) Environmental Engineering:
Environmental Health and Safety for Municipal Infrastructure, Land use, Planning, and Industry, sixth ed. Wiley Hoboken, NJ.
[5] Wilson D C (2007) Development drivers for solid waste management. Waste Management and Research 25(3), 155-164.
[6] Gawaikar V and Deshpande VP (2006) Source Specific Quantification and Characterisation of Municipal Solid Waste –a Review. Indian Journal of Environment Vol. 86 [7] Abu Qdais HA., Hamoda MF and Newman J (1997)
Analysis of residential solid waste at generation sites. Waste Management and Research 15 395-406
[8] Al-Khatib I A, Maria M, Zahra A S F A, Shaheen H Q and Kassinos D (2010) Solid Waste characterisation, quantification and management practices: A case study: Nablus district – Palestine. Journal of Environmental Management 91 1131-1138
[9] Bernache-Perez G, Senchez-Colon S, Garmendia A, Davilla-Villarreal A and Sanchez-Salazar M E (200) Solid waste characterisation study in the Guadalajara Metropolitan zone, Mexico. Waste Management and Research 19; 413-424 [10] Buenrostro O (2001) Municipal solid waste. Perspectives
from multidisciplinary research. Morelia Mexico: University of Michoacan Publications.
[11] Escarimosa L, Franco G, Castaneda G and Quintal C A (2001) Household waste management in the City of Tuxtla Gutierrez Chiapas. Plaza y Valdez Editores Mexico. [12] Forouhar A and Hristovski KD (2012) Characterisation of
[13] Gomez G, Meneses M, Ballinas L and Castells F (2008) Characterisation of urban solid waste in Chihuahua, Mexico. Waste Management 28 2465-2471
[14] Gomez G, Meneses M, Ballinas L and Castells F (2009) Seasonal characterisation of municipal solid waste in the city of Chihuahua, Mexico. Waste Management 29 2018-2024
[15] Hristovski K, Olson L, Hild N, Petersn D and Burge S (2007) The municipal solid waste system and solid waste characterisation at the municipal of Veles, Macedonia. Waste Management; 27: 1680-1689.
[16] Ojeda-Benitez S, Armijo-de Vega C and Marquez-Monenegro M Y (2008) Household Characterisation by family socioeconomic profile as unit of analysis. Resources, Conservation and Recycling; 52:992-999
[17] Ojeda Benitez S, Armijo-de Vega C and Ramirez-Barreto M E (2003) Characterisation and quantification of household waste in a Mexican city. Resources, Conservation and Recycling 39 211-222
[18] Parizeau K, Maclaren V and Chanthy L (2006) Waste characterization as an element of waste management planning: lessons learned from a study in Siem Reap, Cambodia. Resources, Conservation and Recycling, vol. 49, no. 2, 110-128
[19] Kaare S (2002) The Role of Privatisation in Providin g the Urban Poor Access to Social Services: The Case of Solid Waste Collection in Dar-es-Salaam, Tanzania In Research on Poverty Alleviation (2002), Dar-es-Salaam Tanzania. Mkuki na Nyota Publishers Ltd
[20] Kaseva ME and Mbuligwe SE (2005). Appraisal of solid waste collection following private sector involvement in Dar es Salaam city, Tanzania. Habitat International 29 353-366 [21] Yhdego M (1995). Urban solid waste management in
Tanzania: issues, concepts and challenges. Resource, Conservation and Recycling, 14 (1), 1-10.
[22] JICA (1996). The study on solid waste management for Dar es Salaam city. Unpublished report
[23] Acurio G, Rossin A, Teixeira P F and Zepeda F. (1997) Situation of the municipal solid waste management in Latin America and the Caribbean. BID No. ENV.97-107. Pan American Organisation, Washington, DC, USA
[24] Achankeng E (2003) Globalisation, Urbanisation and Municipality Solid Waste management in Africa. Proceedings of the African studies Association of Australasia and the Pacific, 2003, Africa on a Global Stage
[25] African Development Bank (2002) Study on the Waste Management Options for Africa. Unpublished Report [26] Guerrero LA, Maas G and Hogland W (2013) Solid waste
management challenges for cities in developing countries. Waste Management 33,220-232
[27] Joseph K (2002) Perspectives of Solid Waste Management in India. Proceedings of the International Symposium on the Technology and Management of the Treatment & Reuse of the Municipal Solid Waste, Shanghai, China
[28] Marshall RE, Farahbaksh K (2013) Systems approaches to integrated solid waste management in developing countries. Waste Management 33 (2013), 988-1003.
[29] Tacoli C (2012) Urbanisation, Gender and Urban Poverty: Paid Work and Unpaid Carework in the City. International Institute for Environment and Development: United Nations Population Fund, London, UK.
[30] Yousif DF and Scott S (2007) Governing solid waste in Mazatengo, Guetemala. International Development Planning eview 29 (4), 433-450.
[31] Okot-Okumu J and Nyenje R (2011) Municipal solid waste management under decentralisation in Uganda. Habital International 35, 537-543.
[32] Kyessi A and Mwakalinga V (2009) GIS Application in Coordinating Solid Waste Collection: The Case of Sinza Neighbourhood in Kinondoni Municipality, Dar-es-Salaam City, Tanzania. FIG Working Week 2009: Surveyors Key Role in Accelerated Development. Eilat, Israel, 3-8 May 2009
[33] Oosterveer P and Van Vliet B (2010) Environmental systems and local actors: decentralising environmental management in Uganda. Environmental Management 45, 284-295. [34] World Bank 2012. Municipal Solid Waste Management in
Dar-es-Salaam. Unpublished Report
[35] Tchobanoglous G and Kreith F (2002) Handbook of Solid Waste Management, second edition, McGraw Hill.
[36] Sharma M and McBean E (2007) A methodology for solid waste characterisation based on diminishing marginal returns. Waste Management 27, 337-344.
[37] Scheinberg A et al ( 2011) Assessing Recycling in Low- and middle-income Countries: building on modernised mixtures. Habitat International 35 (2) pp. 100-108.
[38] United Republic of Tanzania (2004) Environmental Management Act