http://www.sciencepublishinggroup.com/j/ijem doi: 10.11648/j.ijem.20180203.11
ISSN: 2640-1525 (Print); ISSN: 2640-1568 (Online)
Heterogeneity in Event-Based Soil Hydrologic Response to
Different Land Use Types in Upper River Njoro Catchment,
Kenya
Leah Amisi
*, Peter Musula Kundu, Raphael Muli Wambua
Department of Agricultural Engineering, Egerton University, Nakuru, Kenya
Email address:
*
Corresponding author
To cite this article:
Leah Amisi, Peter Musula Kundu, Raphael Muli Wambua. Heterogeneity in Event-Based Soil Hydrologic Response to Different Land Use Types in Upper River Njoro Catchment, Kenya. International Journal of Engineering Management. Vol. 2, No. 3, 2018, pp. 47-57. doi: 10.11648/j.ijem.20180203.11
Received: August 16, 2018; Accepted: September 19, 2018; Published: October 19, 2018
Abstract:
Soil hydrologic response depends on the soil characteristics such as infiltration capacity, porosity, organic matter content and bulk density. Knowledge on the dynamics of these soil parameters and soil hydrologic response as a result of different land use types is crucial for formulation and adoption of proper soil and water conservation techniques for increased agricultural production. In this research, soil hydrologic response to different land use types is evaluated. Four land use types were purposely selected. These included natural forest, deforested land, fallow agricultural land and grassland. Soil samples were collected and soil hydraulic and hydrological properties that included soil texture, bulk density, saturated hydraulic conductivity, porosity and organic matter content were determined in the soil laboratory. The evaluated soil hydrological response parameters included runoff coefficients, infiltration rate, water repellency and ponding time. The findings showed that the highest and lowest mean bulk density of 1.36 and 0.96 g/cm3 was recorded for deforested and natural forest land respectively. The highest mean saturated hydraulic conductivity (170.21cm/day), porosity (0.62) and organic matter content (4.63%) were observed in the natural forest while the lowest values (24.78cm/day, 0.47 and 0.75%) respectively were found in the deforested land. High water repellency (100.34 cm/hr) and runoff coefficient (0.0077) was recorded in the deforested areas. The findings of this indicate how different land use types affect on-site hydrologic response and generation of stream flow in the catchment hence providing baseline data for future soil and water relations research.Keywords:
Hydrologic Response, Land Use, Event-Based Analysis1. Introduction
Deforestation in the tropical forests has been the focus of scientific and political discussion in the recent past. This is because deforestation has led to surface energy fluxes and dynamics in hydrological and carbon cycles [14]. Upper River Njoro catchment (URiNC) falls within the Eastern Mau forest situated along the western escarpment of the Rift Valley. Over the past years, URiNC has undergone significant land use changes due to increased human population demanding land for settlement and subsistence agriculture [12]. The impact of the human activities has gradually increased forcing the government to resettle people living in the forest. Guzha et al. [18] carried out a study on
the impact of different land use types on surface runoff, discharge and low flows and revealed that forest cover loss in the catchment is accompanied by increased stream discharges and surface runoff. A change in land use in the catchment influences hydrologic response. The term hydrologic response may refer to how fast a stream flow increases at the beginning of rainfall or snowmelt [28].
The key hydrological processes that influence the generation of stream flow are precipitation, interception, infiltration, soil moisture storage, overland flow and ground water storage. Hydrological response depends on the form of
precipitation, antecedent conditions, watershed
flow paths can change as a result of soil compaction during deforestation. As indicated by Havel et al. [19], wild fires also cause changes in hydrologic response. Tillage and overgrazing affects soil properties and damages soil hydrological properties [16]. Benavides et al. [4] noted that the capacity to regulate water flow into the soils depends on specific soil characteristics such as infiltration rate, porosity, organic matter content and bulk density. They also observed that different land use types that involved agricultural activities and grazing posed a threat on the soil properties hence reducing their efficiency in storing and regulating water flow.
According to Winkler et al. [28], clearing of forests has a corresponding effect on sub-surface hydrologic response as it leads to decreased interception and evaporation of water. Another way of changing the hydrological response is by alteration of the soil physical properties that control infiltration and transmission of water and construction of roads that re-route water to different directions. The changes in infiltration capacity in turn changes the pathways that water takes towards the stream and therefore stream flow response to rainfall and water quality changes [9]. The groundwater resources are decreasing over time as less amount of rainfall is contributing to natural recharge on one hand there is rapid infrastructure development [11]. Similar changes in hydrology were noted in (URiNC) where River Njoro was becoming seasonal and major boreholes drying up in the catchment [22]. Previous researchers such as Kundu et al [21], Mwetu et al. [22] and Baker and Miller [3] have worked in the catchment using annual data available in the weather and hydro metrological stations to analyze the effect of land use change on hydrology using hydrological models. Their findings show that URiNC had undergone dynamic land use change leading to changes in hydrologic regimes. The latter two used Soil and Water Assessment Tool (SWAT) to assess land use impact of land cover and on water resources on water resources in Njoro catchment and reported land use changes had resulted in corresponding increases in surface runoff and decreases in groundwater recharge.
Experimental approach at plot scale is another way of practically examining the effect of deforestation to soil hydrologic response. Assessment of the impacts due to land use types on soil hydrologic response at regional scale is difficult due to detailed information on soil properties and land use types that is rarely available [1]. Studying the changes in soil properties caused by different land uses allows measures to be adopted that will reduce the risk of future negative effects [15]. Changes in infiltration capacity and soil water repellency are good parameters and indicators for soil hydrological functioning. Patil et al. [24] observed that soil infiltration capacity was a key parameter influencing the occurrence of soil hydrologic response hence its spatial variability at different agricultural plots is important to for water resource planning and designing of hydraulic structures. Infiltration capacity is controlled by soil hydraulic properties and field and laboratory measurement are the only
effective ways of its determination [27]. Information on how the land use types affects on-site hydrologic response and generation of stream flow is scanty in the URiNC. The objective of this study was to characterize and quantify soil hydrologic response in different land use types at plot scale.
2. Materials and Methods
2.1. Description of Study Area
The Upper River Njoro catchment lies between Latitudes 0° 15’ S and 0° 25’ S and Longitudes 35° 50’ E and 36° 05’ E
and measures about 30 km2. It lies between the Rongai-Njoro
plains and the upper slopes of the Mau escarpment (Figure 1). The topography is predominantly rolling land characterized by slopes ranging from 2% in the plains to 54% in the hills and elevation ranging from 2000- 3079 m above mean sea level. The URiNC exhibits a unique climate. The average annual rainfall in the catchment ranges from 840 mm to over 1200 mm. The mean monthly rainfall ranges from about 30 mm to over 120 mm with a trimodal pattern having peaks in April, August and November. Minimum and maximum average monthly temperatures vary from 5°C to 28°C. Meteorological data from Egerton weather station (ID. 9035092) from 1987 to 2016 revealed that mean annual rainfall was 1073 mm and the air temperature was 21°C. The wettest months were April, May and August. The driest months were January and February. The mean Pan Evaporation was 3.9 mm/day. The catchment is drained by river Njoro which drains into Lake Nakuru. There are three earthen dams in the catchment which receives its water from runoff. During the study period there were cold spells that were being experienced in the catchment. This could be due to high air pressure which dictates the wind direction hence blocking the wind direction that may bring warm air to the land thus causing coldness.
2.2. Characterization of Soils in the Plot Areas
Three samples of soil at two depths (0-15cm and 15-30cm) were collected from the four land uses that included natural forest, grassland, deforested and fallow agricultural land for analysis of soil properties. The mean values were taken as a representative of each land use. The soil properties determined included soil texture, bulk density, and porosity and organic matter content.
2.2.1. Determination of Soil Texture
hydrometer and temperature readings were taken after 40 seconds and 2 hours. The percentage sand, silt and clay were computed as shown.
50 100
%
50
hr
C
Sand= − × (1)
Where,
Chr = Corrected hydrometer reading after 40 seconds
100 %
50
hr
C
Clay= × (2)
Where,
Chr = Corrected hydrometer reading after 2 hours
(
)
%Silt=100− %Sand+%Clay (3)
The USDA soil textural triangle was used to determine the soil classes.
Figure 1. Upper River Njoro catchment.
2.2.2. Determination of Porosity and Bulk Density
The core samples of soil taken were dried in the oven for 24 hours at a temperature of 105oC to enable determination of bulk density.
Bulk density was obtained by the equation,
t oven dry t Can b
c
W W
V
ρ = − (4)
Where,
ρb = Bulk density (g/cm3)
Wt. oven dry = Weight of the oven dried soil (g)
Vc = Volume of the moisture can (cm3)
Porosity was determined by the equation,
1 b
s
ρ
ϕ
ρ
= − (5)
Where,
ρs = Particle density = 2.65 grams per cc.
2.2.3. Determination of Organic Matter Content (OM)
Soil organic matter was determined based on the Walkley –Black chromic acid wet oxidation method [20]. A sample of soil from each land use was sieved through a 0.5mm sieve. The sample was then weighed and placed in a 250ml conical where 5 ml of potassium dichromate (K2Cr2O7) and 7.5 ml of
conc. H2SO4 was added. The flask was then left in the fume
chamber for 30 minutes after which it was quantitatively transferred to a 100 ml conical flask. An indicator solution of 0.3ml ferrous ammonium sulphate was added until the colour changed to greenish brown. A blank titration was also carried out. Percent organic carbon was calculated using the equation below.
0.003 100
% t t
wt
B S n f
OC
S
− × × ×
= (6)
Where,
OC = Organic Carbon Bt = Blank titre St = Sample titre
n =amount of indicator solution f =the correction factor =2
100% converts the ration to percent.
0.003 is derived from the fact that 1 ml of 1.0 N K2Cr2O7 = 3.0mg of carbon
2.3. Runoff Collection
Each runoff plot measured 10m long and 3m wide as in Figure 2 and a total of 12 plots were laid in the four land uses types that included natural forest, deforested land, and fallow agricultural land grassland. The slope was kept uniform for all the plot areas. The plots were reinforced with dump proof course paper (DPC) to prevent external runoff from entering the plots. The location of the experimental plots was selected based on land use and slope. The experiments were carried out from September to December 2017. Plot runoff was directed into a collection bucket of capacity 17 liters. The collection containers were checked after every event and the amount of runoff was measured and recorded. Runoff was expressed as water depth in (mm). Runoff coefficients were calculated by expressing the runoff as a proportion of rainfall.
Figure 2. Runoff plot.
2.4. Determination of Water Repellency
In this research, water repellency was used as an indicator of the ability of soil to resist penetration of water. The water repellency of soil has a corresponding implication on hydrologic balance in soils. It was measured using water drop penetration time (WDPT) [8]. Litter was removed from the surface and then the surface was smoothed to make it
Table 1. Water drop penetration time classification.
Penetration time Class
Less than 1 second Not significant
1-10 seconds Very low
10-50 seconds Low
50-260 seconds Moderate
Greater than 260 seconds Moderate to severe.
Source. [13]
2.5. Determination of Ponding Time
Ponding time for different land use types under uniform rainfall intensity was determined using the direct method [2]. The following steps were used to evaluate ponding time. Before ponding is achieved the expression that applies is as below.
( ) ( )
pF t =R t for t t≤ (7)
Where,
F (t) = Cumulative infiltration (cm) at time t (min) R (t) =Rainfall depth (cm) at time t (min)
tp= ponding time (min)
Based on Brutsnet [7] the post ponding infiltration rate is given by the equation,
( )
cap( )
cap pf F = f F for t t≻ (8)
Where,
f (F) = Post ponding infiltration rate (cm/min) f (cap )F (cap)= infiltration capacity (cm/min)
Therefore the at the moment when ponding occurs,
( ) ( )
cap( )
cap pr R = f F = f F at t t= (9)
Therefore ponding is the time when;
( )
( ) cap cap
r R = f F was fulfilled (10)
Plots of rainfall intensity versus cumulative infiltration and infiltration capacity were plotted on the same axes. The point
where the two plots were intersecting denoted the time of ponding. Inverse functions of cumulative rainfall versus time were plotted below the above curve and then were translated to determine ponding time in different land use types.
2.6. Determination of Infiltration Rate
Infiltration rate and the hydraulic conductivity of the soil were determined by a double ring infiltrometer and a constant head permeameter respectively. Infiltration test was carried in each plot from the four land use types using a double ring infiltrometer. The inner ring had a diameter of 28.5 cm while the outer ring had a diameter of 53 cm. The rings were driven into the soil to a depth of about 5cm below the soil surface using a metal plate and a sledge hammer as shown in appendix E. Water was filled to 20 cm above the soil surface in both rings and the level was maintained by refilling. The inner ring was maintained at the 20cm head level and the amount of water used to top up was recorded at 0, 2, 5, 10, 15 25, 45 and 60 minutes. Cumulative depth of infiltration was then computed for each land use.
2.7. Data Analysis
Measures of descriptive statistics were used to describe and compare mean values. Statistical significance were tested for infiltration, saturated hydraulic conductivity, bulk density and moisture content using one way Analysis of Variance (ANOVA). Regression analysis was also carried out to
evaluate relationship between saturated hydraulic
conductivity and other soil properties.
3. Results and Discussion
3.1. Characterization of the Plot Areas
The soil hydrological and hydraulic properties parameters were analyzed to characterize the plot areas. These included soil bulk density, porosity, saturated hydraulic conductivity and organic matter content. Figure 3 present the soil properties for the land use types that were studied.
3.1.1. Bulk Density and Porosity
From the results in Figure 3, it was observed that the highest value of bulk density was in the deforested land while the lowest value in the natural forest. The mean values of
bulk density ranged from 0.97 to 1.36 g/cm3 . The high bulk
density in deforested land could be attributed to soil compaction during deforestation. The lower bulk density in the natural forest could be due to to high percentage of macropores generated by root channels and presence of duff and O horizon materials. The results are consistent with the findings of Yimer et al. [29] where bulk density in different land use types was analyzed. They found that bulk density in indigenous forest was lowest as compared to other land use types. Porosity was found to be highest in the natural forest as compared to the other land use types. The high porosity could be due to the coarseness of the soil structure hence more pore spaces in the natural forest. This is in line with Santos et al. [15] who observed lower bulk densities and higher porosity in the natural forest as compared to the other land use types.
3.1.2. Saturated Hydraulic Conductivity
Saturated hydraulic conductivity was determined in the laboratory using the constant head method and was found to be 170.21, 169.93, 83.80 and 24.78 cm/day in the natural forest, grassland, fallow agricultural land and deforested land respectively as shown in Figure 3. Saturated hydraulic conductivity (Ksat) was the highest in the natural forest land
and decreased in the order of grassland, fallow agricultural land and deforested land respectively. The findings concurs
with Zwartendijk et al. [30] who carried out examined
saturated hydraulic conductivity in natural forest and deforested land and found out that Ksat in forest to be higher
than deforested land. Correlation tests were carried out between saturated hydraulic conductivity and the other soil properties to determine how each property related with Ksat.
There was significant negative correlation between hydraulic conductivity and the bulk density (-0.98). The correlation coefficient between Ksat and porosity, soil organic matter content, and moisture content at field capacity were 0.998, 0.96, and 0.997 respectively. Through ANOVA there were significant differences between plots in the different land use types.
3.1.3. Organic Matter Content
The organic matter content was found to be 4.63% in the natural forest, 2.7% in the agricultural land that had been left to fallow , 3.6% in the grassland and 0.75% in the deforested area. The indigeneous forest had the highest organic matter content while the deforested area had the lowest organic matter content. This could be attributed to the dense canopy that drop high amount of litter in the indigenious forest which decomposes to add on the organic matter. The findings are in line with Tilahun and Asefa [25] who carried out a study on soil organic matter contents in four land use systems: forestland, grassland, fallow land and cultivated land and found out the carbon content to be highest in forest land
3.1.4. Soil Texture
Soil texture analysis was carried out in the soil laboratory for the 27 soil sample from the 12 sites using hydrometer method. Figure 4 presents the findings of the present study.
Figure 4. Soil particle proportions in different land use types.
The clay content of the samples ranged from 22 to 38%, silt ranged from 24 to 44% and the sand content between 34 to 46%. The sand content was highest in the deforested land and fallow agricultural land. Analysis of variance revealed that sand, silt and clay content were not very significantly different for the four land use classes (p=0.04). The slight differences experienced could have been due to samples being few. From the USDA textural classes were sandy clay
loam, clay loam and loam in the fallow agricultural land, grassland and natural forest respectively. The study by Okelo
3.2. Event-based Soil Hydrologic Response for Different Land Use Types
The key parameters of soil hydrologic response that were analyzed in this study included the infiltration capacity, runoff, water repellency and ponding time.
3.2.1. Infiltration Capacity
The infiltration capacity of soils under different land use types was determined using double ring infiltrometer. The cumulative infiltration volume for the land use types was determined within 60 minutes of infiltration. Basing on the cross-section area of the inner ring, cumulative depth of infiltration was computed for each land use and was plotted as shown in Figure 5.
Figure 5. Cumulative infiltration in different land use types.
From the Figure 5 , there were significant differences in infiltration rates and cumulative infiltration between the land use types (p=0.004). The infiltration capacity was highest in the natural forest and lowest in the deforested land. The reduction in the infiltration rate in deforestated land may be due to the compaction and soil structural degradation during logging and human activities in the forest. The soil structural degradation consequently leads to losses in macropores and inconsitency in pore space on the sub surface soil hence reduction in infiltration and increase in surface runoff. The changes in infiltration capacity in turn changes the pathways that water takes towards the stream and therefore stream flow response to rainfall and water quality changes [6]. A study conducted by Yimer et al. [29] on effects of different land use types on infiltration capacity in a catchment in the highlands of Ethiopia found out that changes in infiltration capacity were attribute to land use change rather than location and slope which is consistent with the present finding. Infiltration rates were also highest during dry months as compared to wet months. This was due to low antecedent moisture content during dry months hence more water infiltrated as compared to wet months when the moisture content of soil is high hence less infiltration.
3.2.2. Soil hydrologic Response
Runoff volume was collected in different land use types and was converted to depth by dividing with the area of the plots. The cumulative runoff (soil hydrologic response) was plotted against cumulative rainfall as in Figure 6.
Figure 6. Soil hydrologic response in different land use types.
From the plot in Figure 6, there are three distinct stages in the rainfall-infiltration and runoff processes. The first is the period from the start of rainfall to the initiation of runoff where all the rainfall infiltrates. The second stage is the period in which infiltration and runoff occur at the same time. At this point there is an almost linear relationship which indicates that there is constant infiltration rate. Stage three
use types since land cover is a major factor in this case. At the beginning of the rainy season the soil was drier thus higher storage capacity and thus infiltration rate was high.
The infiltration rate of these soils decreased as the soil moisture deficit decreased as it was being filled by the incoming precipitation. The soil moisture content was closer to or above the field capacity in the main rainy season indicating the void spaces in the surface soil profile were almost filled with water. This implies that as pore are increasingly filled with water, infiltration of incoming rain becomes limited and thus rainfall runs over the land as saturation excess runoff. The findings are key in understanding the rainfall-infiltration –runoff processes within the catchment for water resource management decision making. Coefficients were calculated by expressing the runoff as a proportion of rainfall and the average coefficient ranged from 0.0077 to 0.00064 with natural forest having the lowest. As indicted by Tilahun et al. [29], an increase in runoff coefficient shows low infiltration and high runoff. High runoff rates in deforested areas are due to degraded soil structure disturbance during deforestation thus changing the flow paths of water [28].
3.2.3. Water Repellency
Water repellency (WR) was determined in the four land use types using water drop penetration time (WDPT) method and results are as shown in Table 2.
Table 2. Water repellency class for the tested points on the catchment. Land use Eastings Northings Pt Class
Natural forest 35.93 -0.36 5 Very low
Fallow agric land 35.95 -0.37 8 Very low
Grassland 35.92 -0.35 15 Low
Deforested 35.92 -0.37 18 low
Pt = Penetration time (seconds)
The results from Table 2 reveal that water repellency was not significant in fallow agricultural land and natural forest which resulted into very low water repellency as compared to deforested land which recorded higher values. The soils in the deforested land were found to be the most water repellent hence resulting into faster ponding and runoff generation. This also is the evidence of the high runoff and low infiltration rates experienced. The low vegetation cover deterioration of the soil structure due to compaction is responsible for the high soil water repellency. Slight repellency in soils has a substantial effect on infiltration rates hence increase in runoff generation especially for dry soils [10].
3.2.4. Ponding Time
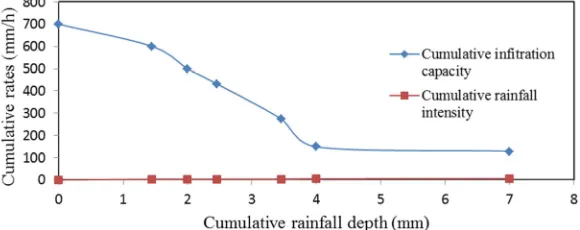
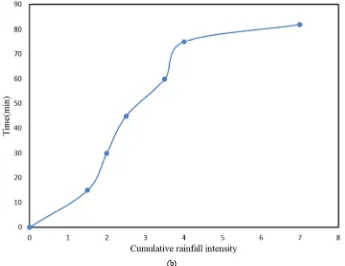
The response of ponding time in different land use types was tested under varying rainfall intensity. The relationship between cumulative rainfall intensity, cumulative infiltration capacity and cumulative infiltration depth was as shown in the Figure 7 for fallow the agricultural land.
Figure 7. Determination of ponding time in fallow agricultural land.
The Figure 7 shows that ponding could not be realized for the 82 minutes storm. This explains the low runoff rates and high infiltration that were experienced. Results shows that under the same varying intensity the infiltration rate was
Figure 8. Ponding time in natural forest.
From Figure 8, for the natural forests in higher rainfall intensities are required for ponding to be realized. The infiltration rate in natural forest was high such that no ponding occurred for the 82 minutes rainfall storm. The soil structural stability consequently led to increase in macro
pores and consistency in pore space on the sub surface soil hence reduction in surface runoff.
Figure 9 represents the behavior of the 82 minutes storm in the grassland.
Figure 9. Ponding in grassland.
The response of soil in the grassland was not significantly different from the fallow agricultural land and natural forest as shown in the Figure 9. During the 82 minutes rainfall with varying intensities ponding could not be achieved. This was
due to high infiltration rates that were experienced in the grassland.
Figure 10 above and below shows the storm in the deforested land and ponding time determination.
(b)
Figure 10. Determination of ponding time in deforested land.
The soil hydrologic response in the deforested land was different as compared to the other land use types as shown in Figure10 (a). The time of ponding is at the point where the intersection of the graphs coincide as indicated in Figure 10 (b). Ponding time was achieved at 70 minute for a storm of duration 82minutes. The quick response in ponding could be due to low vegetation cover and deterioration of the soil structure due to compaction hence reducing infiltration rate of soil in the area. This concurs with Zwartendijk et al. [30] who found out that infiltration rates in mature forests was characterized by macro pores flow delayed ponding while deforested land is characterized by matrix flow hence faster ponding.
4. Conclusions
In this study, experimental approach on-site was used to evaluate soil hydrologic response to different land use types in URiNC. The land use types investigated included natural forest, grassland, fallow agricultural land and deforested land. The results of this study indicate that there were significant differences in soil hydrological response among different land use types land uses types in URiNC. It was also observed that deforestation has led to changes in soil properties that influence hydrologic response and generation of stream flow. The findings also reveal that soil hydrological behavior is influenced by land use to a large extent. In addition, there is evidence from this study that, deforestation and logging leads to soil compaction hence reducing continuity in the macro pore flow therefore negatively impacting soil hydrological functioning. Correlation tests carried out between saturated hydraulic conductivity and
other soil hydrologic response parameters indicated that infiltration capacity and porosity had a positive relationship with saturated hydraulic conductivity in the different land use types with coefficients of 0.42 and 0.998 respectively. On the other hand, runoff coefficient and bulk density had a negative correlation with saturated hydraulic conductivity (0.92 and -0.998) respectively. The trends in soil hydrologic processes from this study have provided baseline data for future soil and water relations research. Future work can focus on the soil hydrological functions restoration within URiNC.
References
[1] Abu-Hashim, M. S. D. (2011). Impact of use and land-management on the water infiltration capacity of soils on a catchment scale. JKI.
[2] Assouline, S., Selker, J. and Parlange, J. Y. (2007). A simple accurate method to predict time of ponding under variable intensity rainfall. Water Resources Research, 43(3).
[3] Baker, T. J. and Miller, S. N. (2013). Using the soil and water assessment tool (swat) to assess land use impact on water resources in an east african watershed. Journal of Hydrology,
486, 100-111.
[4] Benavides, I. F., Solarte, M. E., Pabón, V., Ordoñez, A., Beltrán, E., Rosero, S. and Torres, C. (2018). The variation of infiltration rates and physical-chemical soil properties across a land cover and land use gradient in a Paramo of southwestern Colombia.
Journal of Soil and Water Conservation, 73(4), 400-410.
[5] Bouyoucos, G. J. (1962). Hydrometer method improved for making particle size analyses of soils 1. Agronomy journal,
[6] Bruijnzeel, L. A. (2004). Hydrological functions of tropical forests: Not seeing the soil for the trees? Agriculture, ecosystems & environment, 104(1), 185-228.
[7] Brutsaert, W. (2005). Hydrology: an introduction. Cambridge University Press
[8] Buczko, U., Bens, O., Fischer, H. and Hüttl, R. (2002). Water repellency in sandy luvisols under different forest transformation stages in northeast germany. Geoderma,
109(1-2), 1-18.
[9] Buttle, J. M., Beall, F. D., Webster, K. L., Hazlett, P. W., Creed, I. F., Semkin, R. G. and Jeffries, D. S. (2018). Hydrologic response to and recovery from differing silvicultural systems in a deciduous forest landscape with seasonal snow cover. Journal of Hydrology, 557, 805-825. [10] Cerdà, A., & Doerr, S. H. (2007). Soil wettability, runoff and
erodibility of major dry‐Mediterranean land use types on calcareous soils. Hydrological Processes: An International Journal, 21(17), 2325-2336.
[11] Chandramouli, S. and Natarajan, N. (2016). A Comparative Study on the Infiltration Characteristics of Soils in Srikakulam District, Andhra Pradesh, India. Asian Journal of Water, Environment and Pollution, 13(1), 73-79.
[12] Chrisphine, O. M., Maryanne, O. A. and Mark, B. K. (2016). Assessment of hydrological impacts of Mau Forest, Kenya.
Hydrology: Current Research, 7(1).
[13] Doerr, S., Shakesby, R., Blake, W., Chafer, C., Humphreys, G. and Wallbrink, P. (2006). Effects of differing wildfire severities on soil wettability and implications for hydrological response. Journal of Hydrology, 319(1-4), 295-311.
[14] Dos Santos, V., Laurent, F., Abe, C. and Messner, F. (2018). Hydrologic Response to Land Use Change in a Large Basin in Eastern Amazon. Water, 10(4), 429.
[15] Dos Santos, K. F., Barbosa, F. T., Bertol, I., de Souza Werner, R., Wolschick, N. H. and Mota, J. M. (2018). Study of soil physical properties and water infiltration rates in different types of land use. Semina: Ciências Agrárias, 39(1), 87-98.
[16] Göl, C., & Yilmaz, H. (2017). The effect of land use type/land cover and aspect on soil properties at the gökdere catchment in northwestern turkey. Šumarski list, 141(9-10), 459-467. [17] Guo, H., Hu, Q. and Jiang, T. (2008). Annual and seasonal
streamflow responses to climate and land-cover changes in the poyang lake basin, china. Journal of Hydrology, 355(1-4), 106-122.
[18] Guzha, A. C., Rufino, M. C., Okoth, S., Jacobs, S. and Nóbrega, R. L. B. (2018). Impacts of land use and land cover change on surface runoff, discharge and low flows: Evidence from East Africa. Journal of Hydrology: Regional Studies, 15, 49-67.
[19] Havel, A., Tasdighi, A. and Arabi, M. (2018). Assessing the hydrologic response to wildfires in mountainous regions.
Hydrology and Earth System Sciences, 22(4), 2527.
[20] Konen, M. E., Jacobs, P. M., Burras, C. L., Talaga, B. J. and Mason, J. A. (2002). Equations for predicting soil organic carbon using loss-on-ignition for north central us soils. Soil Science Society of America Journal, 66(6), 1878-1881. [21] Kundu, P., China, S., Chemelil, M. and Onyando, J. (2004).
Detecting and quantifying land cover and land use change in eastern mau by remote sensing. Paper presented at the 20th ISPRS Congress. Istanbul, Turkey.
[22] Mwetu, K., Mutua, B., Kundu, P., Fürst, J. and Loiskandl, W. (2009). Effects of deforestation and climate variability on river discharge in the njoro river catchment, kenya. Paper presented at the Proceedings of the Sumawa Mau forest complex conference, Egerton University.
[23] Okelo, M., Onyando, J., Shivoga, W. and Miller, S. (2008).
Assessment of infiltration using a mini rainfall simulator in the river njoro watershed. Paper presented at the Proceedings of Taal 2007: The 12th World Lake Conference.
[24] Patil, V. S., Chavan, S. M. and Pawar, D. P. (2018). Spatial distribution of soil under the influence of infiltration rate.
Journal of Pharmacognosy and Phytochemistry, 7(2), 2024-2029.
[25] Tilahun, C. and Asefa, T. (2009). Assessment of soil organic matter under four land use systems in bale highlands, southeast ethiopia: A. Soil organic matter contents in four land use systems: Forestland, grassland, fallow land and cultivated land. World Applied Sciences Journal, 6(9), 1231-1246. [26] Tilahun, S. A., Guzman, C. D., Zegeye, A. D., Engda, T. A.,
Collick, A. S., Rimmer, A., & Steenhuis, T. S. (2013). An efficient semi-distributed hillslope erosion model for the subhumid Ethiopian Highlands. Hydrology and Earth System Sciences, 17(3), 1051-1063.
[27] Tuffour, H. O., Asare, J. and Nutakor, G. M. (2018). Prediction of infiltration from soil hydraulic properties.
Eurasian Journal of Soil Science, 7(1), 64-72.
[28] Winkler, R. D., Moore, R. D., Redding, T. E., Spittlehouse, D. L., Smerdon, B. D. and Carlyle-Moses, D. E. (2010). The effects of forest disturbance on hydrologic processes and watershed. Compendium of forest hydrology and geomorphology in British Columbia. BC Min. For. Range, 66, 179.
[29] Yimer, F., Messing, I., Ledin, S., & Abdelkadir, A. (2008). Effects of different land use types on infiltration capacity in a catchment in the highlands of Ethiopia. Soil use and management, 24(4), 344-349.