Effect of Average air Temperature and Relative
Humidity on Global Radiation
M.Kesavan 1 & M.Senthilkumar2
1&2 Assistant professor, Department of mechanical engineering Annamalai university Annamalai naar .608002.INDIA.
Abstract
This statistical data analysed was aimed of the found to relationships between global solar radiation, relative humidity and mean air temperatures of the Chennai City ,India.For the month of July-in this studied. The IMD data of minimum and maximum temperatures as well the relative humidity and MAT-LAB curve fitting tool was used. In this work observed that ‘SGR‘is affected by both air temperature and relative humidity .The solar global radiation directly proportional to the mean air temperature and relative humidity. Therefore the accurate knowledge used of solar global radiation at a developed area, rural and urban area is very useful for commissioning of power plant and other requirement for the peak load energy demand.
I. INTRODCTION
The earth and its atmosphere depend ultimately on the sun for its energy supply. The radiant energy from the sun covers the entire electromagnetic spectrum. The atmospheric interference restricts this spectrum to 290nm to 300nm which is called “Solar radiation” energy. From solar radiation can be derived by thermal conversion where in the heat generated due to irradiation is used to operate a system and by direct conversion into electrical energy. The accurate information of the solar radiation intensity at a given location is essential to the development of solar energy based projects and in the long term evaluation of the solar energy conversion systems performance [1]. This information is used in the design of a project. Furthermore monthly mean daily data are needed for the estimation of long term solar systems performances. Furthermore daily global solar radiation models required for engineering design and planning projects [2, 3]. Solar radiation which arrives to earth surface for every year is 160 times the world’s proven fossil fuel and reserves [4]. A global study has been made on the global solar radiation models are available the study carried out an estimation of the monthly average daily global solar radiation on horizontal surface [5] among several empirical models which have been used to calculate global solar radiation the most commonly used parameters in sunshine hours [6].The empirical
models has been used to calculate global solar radiation are usually based on some factors as shown in table (1)[7]. Since the solar radiation reading the earth’s surface depends upon climate condition of the place. A study of solar radiation under local climatic conditions of the place is necessary. This knowledge of local solar radiation is essential for the proper design of buildings energy systems, solar energy systems and a good evaluation of thermal environment within the buildings [8-11]. It is measured in terms of sunshine duration. One way of solving this is using appropriate correlations which are empirically established that can be used to estimate global solar radiation from more readily available metrological parameters such as sunshine hours. Several empirical models have been developed to calculate solar radiation from meteorological, geographical, climateological parameters such as relative humidity, ambient temperature, soil temperature, number of rainy days and evaporation [12-18]. In addition, other empirical models have been developed to calculate solar radiation from sunshine hours [19-22]. The most commonly used parameters for estimating global solar radiation are sunshine duration among various correlations. The modified variations of [23] model who proposed a linear relationship between the ratio of average daily global radiation to the corresponding value on a clear sky day and the ratio of average daily sunshine duration to the maximum possible sunshine duration and its derivatives have been widely used. Empirical models which have been used to calculate global radiation are usually on some factors as shown in table [1], [23]. The Solar radiation data computed based on measured metrological data computed data. The average daily global radiation on horizontal surface it, for a location is now possible of sunshine hours five different models have been selected from different previous studies for estimating daily global solar radiation. All models have been proposed for estimating for monthly mean daily global solar radiation, H-based on the Angstrom-Prescott model [24].
II. NEEDED FOR SOLAR RADIATION DATA
utilization, biomass conversion, passive solar lighting, heating of buildings, detoxication etc is becoming apparently viable and enhances the societies energy management planning and hence its efficient applications. The economics of these technologies depend on the efficiency of the utilizing processes. So that the operating costs are comparable if not cheaper. With the present day processes based on conventional fossilized energy utilization. Thus to design operating systems which will have the highest achievable efficiency under comparable costs. The reliable database on different aspects of solar radiation energy is essential. The more accurately the solar resources are known. The better becomes the system design the radiation energy available at a location changes throughout the day and year due to varying weather patterns by knowing the variability storage systems can be designed and used optimally. Solar radiation data also help determine the best geographic location for utilization as it will have a direct influence on the design of the systems. Photovoltaic and photochemical conversions need spectral distribution over space and time, location, climate and atmospheric conditions have strong influence on the spectral distribution of solar irradiance.Table 1: Classification of parameters used to calculate solar radiation (GSR)
III. CALCULATION PROCEDURE
Many different models have been found in the literature such as linear, quadratic, cubic, logarithmic, exponential regressing model to estimate on a horizontal surface from observed sunshine duration and calculate extraterrestrial radiation and maximum possible sunshine duration. In this study model have been investigated and validity of this model has been made. The Angstrom Prescott model [24] that examines the linear correlation between clearness index (H/H0)
and sunshine duration ratio (S/S0) is most commonly
used model. The equation used in this model is,
H/H0 = a + b (S/S0)…..(1)
Where H is monthly average daily global radiation on a horizontal surface,
H0 is a extraterrestrial radiation on a horizontal
surface
S is a monthly average daily sunshine duration S0 is a monthly average maximum possible daily
sunshine duration and
a, b are Angstrom coefficient (also called regression coefficient)
The quadratic model is proposed by Akinolgu and Ecevit .et.al [25] and the related equation is
H/H0 = a + b (S/S0) + C (S/S0)2 (2)
The cubic model is proposed by Bahel et .al [26]. And the related equation is
H/H0 = a + b (S/S0) + C (S/S0)2 + d (S/S0)…… (3)
The logarithmic model is proposed by D.B Ampratoumandet.al [27] and the related equations is H/H0 = a + b log (S/S0)…… (4)
The exponential model is proposed by J. Almorex et.al [28] and related equation is
H/H0 = a + b exp (S/S0)……….(5)
The monthly average daily extraterrestrial radiation on a horizontal surface can be calculated by following equation [29]:
H0 = 24 * 3600/π * I sc * 1 + 0.003 cos
360∗n
365 (6) (cos Ø cos 𝛿 sin 𝜔s +
πωs
180 sin π sin𝛿)
Classification Parameter
Meteorological factors
Extraterrestrial solar radiation, sunshine duration, temperature, precipitation, relative humidity, effects of cloudiness, soil
temperature, evaporation, reflection of the environs, etc.
Geometrical factors
Azimuth angle of the surface, tilt angle of the surface, sun elevation angle, sun azimuth angle.
Physical factors
Scattering of dust and other atmospheric constituents such as O2,
N2, Co2 and O
Geographical factors Latitude, Longitude and elevation of the site
Astronomical factors
Solar constant, earth – sun distance, declination and hour angle
Model no Regression
Equation
Model Type
1 H/Ho=a+b(s/So) Linear
2 H/Ho=
a+b(s/So)+c(s/So)2
Quadratic
3 H/Ho=
a+b(s/So)+c(s/So)2
Cubic
4 H/Ho= a+blog(s/So) Logarithmic
5 H/Ho=
a+bexp(s/So)
Where Ic is the solar constant (1367 W/m2), Ø is the
latitude of the location , 𝛿 is the sun declination and
𝜔s is the sunset hour angel for a given month and D
or N is the no of days of the year starting from 1st of January.
Declination sunset hour angel and day length can be computed by the following equation [30, 31]
𝛿 = 23.45 sin 360 +284+d
365 ..(7)
𝜔s = cos -1 (- tan Ø tan 𝛿 ) …..(8)
S0 = 2/ 15 𝜔s … (9)
Further five different models have been selected from different previous studies for estimating daily global solar radiation. All models having proposed for estimating the monthly mean daily global radiation. H based on the Angstrom Prescott model, extraterrestrial radiation on a horizontal surface sin daily period where calculated numerically for each month using declination angel, latitude and sunset hour angel from the calculation procedure using the equation [32-34]. Then we develop equation to estimate H/H0 for each month by applying regression
analyze to the parameter S/S0 based on the model
equation, five model equation for each month where formed. The values of monthly average of daily solar radiation estimated for each month. The corresponding measure value where compared with the estimated values using the above five models for each month.(linear, quadratic, cubic, log and power).
IV. RESULT AND DISCUSSION
The relationship between global solar radiations, relative humidity and mean air temperature of the study area was determined using the data of minimum and maximum temperature obtained from archive of weather online and a Microsoft excel tool, and the results is presented in Table 2. Hargreaves –Samanni model of global solar radiation was used for the prediction of the global solar radiation using the maximum and minimum temperature data for the month of June, 2016. Mean temperature was gotten from the maximum and minimum data already acquired and the relative humidity for the month of June, 2016 was obtained from the same achieve of weather online limited. From Table 2, it was observed that, the mean air temperature (Tav) has effect on the global solar radiation(Rs) to some extent. The comparison between the two quantities shows the positive correlation coefficient of 0.460648 (46.06%), implying that the two quantities would increase and decrease in the same way, but not in all the values due to the correlation coefficient value that is below average, i.e. 50%. Okonkwo&Nwokoye (2014), reported that, global solar
radiation was highest in the month of November, while the lowest value was recorded in August. This is attributed to the highest and lowest values of clearness index obtained for these months respectively. Also, from Table 2, it was observed that relative humidity has effects on global solar radiation to some extent. The comparison between the two quantities shows a negative correlation of -0.47686 (-47.69%), implying that when one quantity is increasing, the other will be decreasing and vice versa, though not in all the
1.Table Calculated global solar radiation for July month
DATE TMIN
C
TMAX
C
TAV RH
(%)
SGR(Kwh) Measured
SGR(Kwh) calculated
182 26.8 37.5 32.1 31 22.42 20.5
183 23.7 35.2 29.4 40 23.42 21.4
184 27.7 30.6 29.1 55 23.47 22.3
185 28.9 36.6 32.7 39 21.71 20.2
186 28.1 33.8 30.9 56 23.95 21.3
187 28.9 39.7 34.3 46 22.14 20.5
188 26.7 33.2 29.9 66 23.84 21.8
189 27.6 32.1 29.8 65 24.14 22.3
190 27.6 32.5 30.0 61 18.10 16.5
191 28.9 35.3 32.1 47 21.39 19.5
192 28.3 36.8 32.5 40 24.17 22.4
193 25.1 35.6 30.3 44 23.84 21.9
194 26.8 33.8 30.3 49 24.01 21.1
195 26.6 30.8 28.7 47 24.01 21.2
196 28.7 32.3 30.5 67 23.42 20.1
197 28.7 33.3 31.0 52 16.74 14.2
198 28.0 34.0 31.0 42 06.50 04.5
199 28.8 35.8 32.3 52 11.91 09.2
200 29.8 36.8 33.3 40 18.67 16.5
201 28.9 35.0 31.9 36 16.94 14.5
202 28.5 33.2 30.8 41 22.48 20.3
203 27.4 34.4 30.9 46 22.20 20.2
204 28.5 36.8 32.6 43 15.79 13.2
205 30.0 33.6 31.8 36 10.95 08.5
206 29.8 34.0 31.9 37 14.49 12.3
207 29.0 34.3 31.6 48 18.95 16.3
208 29.8 34.9 32.3 45 17.70 15.4
209 29.0 36.0 32.5 41 18.64 16.5
210 29.2 36,0 32.6 36 15.48 13.4
211 29.1 36.8 32.9 37 14.17 12.2
values due to the correlation value that is below average, i.e. 50%. According to Fatayi (2013), cloud cover and relative humidity are higher in wet than in dry season, meaning more rainfall between the months of May and October, with low surface temperature, high relative humidity and low cloud cover.The effects of mean air temperature and relative humidity on global solar radiation is shown Figures 2 and 3 respectively. But relative humidity has more impacts on global solar radiation than mean air temperature. This is also displayed in figure 4, in which the trend of change of global solar radiation and relative humidity are very close when compared to the graph of mean temperature.
V. RECOMMENDATION
It has been concluded that global solar radiation is affected by both mean air temperature and relative humidity using Hargreave-Samanni model with the minimum and maximum temperature data for rainy season (June), as obtained from achieve of weather online limited from their website, similar method should be employed using the data (relative humidity, maximum and minimum temperature) for dry season.
VI. MATERIALS AND METHOD
A. Materials
The materials used for this work are the data of minimum and maximum temperature as well as the relative humidity of Ikeja, Nigeria, for June
2016obtained from the achieve of weather online limited, and the Microsoft excel software. The Table 2: Calculated global solar radiation for July month
studyarea is Ikeja, the capital of Lagos state, Nigeria. Lagos state is located in the South-Western Nigeria. The study location is within latitude and longitude 6.4N and 3.35E respectively. Because water is the most topographical feature of Lagos state, water and wetlands cover 40% of the total land area in the state (Albert et al.(2006)). Lagos state is bounded from the North and East by Ogun state, West by the Republic of Benin, and South by the Atlantic Ocean. It has two seasons; rainy and dry seasons due to its tropical savanna climate. The rainy season is from April to September, but the intense rain is from April to July, and the dry season is from October to March. It has an average temperature of 270c.
B. Methods
From the studies [6,7], the predominant factors that have
185 190 195 200 205 210 10 20 30 40 50 60 70 So lar Glo b al Radiatio n & Tave
Days of the month in july
Tave Humidity SGR 20 30 40 50 60 70 80 Hu m id ity in p erc en tag e
Fig. 3: Graph of mean air temperature, relative humidity and global solar radiation
185 190 195 200 205 210 5 10 15 20 25 30 35 So lar Glo b al Radiatio n
Days of the month in july
Tave SGR 10 12 14 16 18 20 22 24 26 28 30
Mean Average Tem
p era tu re in C
Fig 1: Graph of relative humidity and global solar radiation
185 190 195 200 205 210 10 20 30 40 50 60 70 80 Hu m id ity in Perc en tag e
Days of the month in july
Humidity SGR 5 10 15 20 25 30 35 40 So lar Glo b al Radiatio n
Fig 2: Graph of mean air temperature and relative humidity
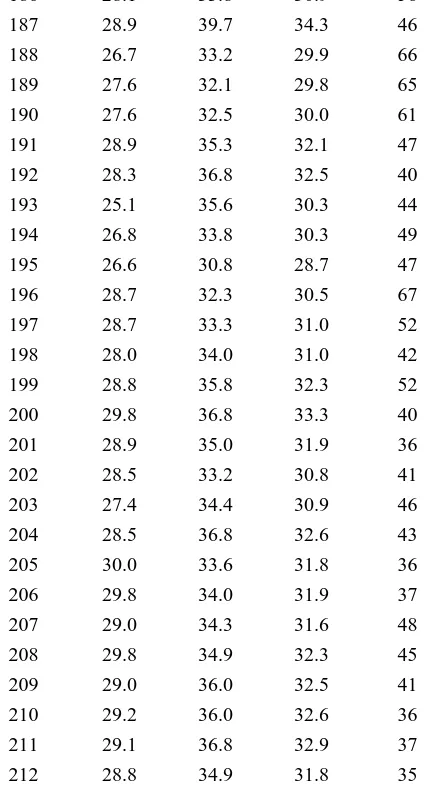
DATE TMIN TMAX TAV RH (%)
182 26.8 37.5 32.1 31
183 23.7 35.2 29.4 40
184 27.7 30.6 29.1 55
186 28.1 33.8 30.9 56
187 28.9 39.7 34.3 46
188 26.7 33.2 29.9 66
189 27.6 32.1 29.8 65
190 27.6 32.5 30.0 61
191 28.9 35.3 32.1 47
192 28.3 36.8 32.5 40
193 25.1 35.6 30.3 44
194 26.8 33.8 30.3 49
195 26.6 30.8 28.7 47
196 28.7 32.3 30.5 67
197 28.7 33.3 31.0 52
198 28.0 34.0 31.0 42
199 28.8 35.8 32.3 52
200 29.8 36.8 33.3 40
201 28.9 35.0 31.9 36
202 28.5 33.2 30.8 41
203 27.4 34.4 30.9 46
204 28.5 36.8 32.6 43
205 30.0 33.6 31.8 36
206 29.8 34.0 31.9 37
207 29.0 34.3 31.6 48
208 29.8 34.9 32.3 45
209 29.0 36.0 32.5 41
210 29.2 36.0 32.6 36
211 29.1 36.8 32.9 37
212 28.8 34.9 31.8 35
Table 2: Relative humidity, minimum and maximum air temperatures for July month
.
Fig. 4: Map of chennai showing the study area
VII. CONCLUSION
In this statistical analyzed, the relationship between the global solar radiation ,mean air temperature and relative humidity of Chennai city , India were analyzed for the month of July .it can be strongly recommended that global solar radiation is affected by the both relative humidity and mean air temperature as given by the correlation results. However, the mean air shows that solar global radiation increases with increase in mean temperature at same global solar radiation. Increase with decreases in relative humidity and the results shows high relative humidity is associated with low global solar radiation and low relative humidity is associated with high global solar radiations. Also high average temperature is associated with high global solar radiation and low average temperature is also associated with low global solar radiation.it have been concluded relative humidity and mean air temperature have effects on solar global radiation of a study area. The above study revealed that of relative humidity more conquer than that of mean air temperature.
Nomenclature
a-d empirical constants
Isc solar constant
H daily global solar radiation on horizontal surface (MJ/m2)
H0 daily extraterrestrial radiation on
horizontal surface (MJ/m2)
n number of day of year starting from first of January
S sunshine duration (h)
R coefficient of determination
S0 day length
Greek letters
s sunset hour angle
𝜕 Solar declination
Latitude of site
REFERENCES
[1] A.M. Muzathik, W.B.W. Nik, Daily global solar radiation
estimate based on sunshine hours, Energy Conversion Management, 2011:75:80-6.
[2] Genwa KR, Sagar CP, Energy effficiency Solar energy
conversion and storage inphoto galvanic cell. Energy Conversion Management 2013;66: 121–6.
[3] Tarhan S, Sarı A, Model selection for global and diffuse radiation over theCentral BlackSea CBS) region of Turkey. Energy Conversion Management, 2005;46:605–13.
[4] Ultanır MO. Yuzyilin Esiginde, Gunes Enerjisi. Bilim ve
Teknik1996;340: 50–5.
[5] Bakirci K.Models of solar radiation with hours of bright sunshine: A review.Renewable Sustainable Energy Revisied 2009; 13: 2580–8.
[6] Zhao N, Zen X, Han S. Solar radiation estimation using sunshine hour and air pollution index in China. Energy Conversion Management 2013; 76: 846–51.
[7] Besharat F, Dehghan AA, Faghih AR. Empirical models for estimating globalsolar radiation: a review and case study. Renewable Sustainable Energy, 2013;21: 798–821.
[8] Lu Z, Piedrahita RH, Neto CDS. Generation of daily and hourly
solar radiation values for modeling water quality in aquaculture ponds. Transactions of the ASAE 1998; 41(6):1853–9. (8)
[9] Machler MA, Iqbal M. A modifications of the ASHRAE
clear-sky irradiation model. ASARE Transactions 1985; 9(1a):106– 15(9).
[10] Cartwright TJ. Here comes the sun: solar energy from a flat-plate collector. In: Modeling the world in a spreadsheet-environmental simulation on a micro- computer. London: The Johns Hopkins University Press; 1993, 121-44.9(10)
[11] Trujillo JHS. Solar performance and shadow behavior in
buildings-case study with computer modeling of a building in Loranca, Spain. Building and Environment 1998; 33(2–3):117– 30.(11)
[12] M.Yorukoglu and A.N. Celik,―A critical review on the estimation of daily global solar radiation from sunshine duration, Energy Conversion and Management,vol.47, no.15, pp. 2441-2450, 2006.
[13] T.T. Chow, A.L.S. Chan, K.F. Fong and Z. Lin, ,Some
perceptions on typical weather year-from the observations of Hong Kong and Macau, Solar Energy, vol. 80, pp. 459-467, 2006.
[14] M.El-Metwally,‖Sunshine and global solar radiation estimation at different sites in Egypt, Journal of Atmospheric and Solar-Terrestrial Physics,vol. 67, no. 14, pp. 1331-1342, 2005. [15] S. Rehman and T.O. Halawani, ―Global solar radiation
estimation, Renewable Energy, vol. 12, no. 4, pp. 369- 385, 1997.
[16] I.T. Togrul and E. Onat, ―A study for estimating solar radiation in Elazığ using geographical and meteorological data, Energy Conversion and Management, vol. 40, pp. 1577-1584, 1999.
[17] N.A.Elagib and M.G. Mansell, ― New approaches for estimating global solar radiation across Sudan, Energy Conversion and Management, vol. 41, no.5, pp. 419- 434, 2000. [18] C.Ertekin and O. Yaldiz, ― Comparison of some existing
models for estimating global solar radiation for
Antalya(Turkey), Energy Conversion and Management, vol. 41, no. 4, pp. :311-330, 2000.
[19] K.Bakirci, ―Correlations for estimation of daily global solar radiation with hours of bright sunshine in Turkey, Energy, vol. 34, pp. 485-501, 2009.
[20] M.Koussa, A.Malek and M. Haddadi,―Statistical
comparison of monthly mean hourly and daily diffuse and global solar irradiation models and a Simulink program development for various Algerian climates, Energy Conversion and Management, vol. 50, pp. 1227-1235, 2009.
[21] H.Bulut and O.Buyukalaca, ― Simple model for the generation
of daily global solar-radiation data in Turkey, Applied Energy, vol. 84, pp. 477–491, 2007.
[22] B.G.Akinoglu and A. Ecevit, ― Construction of a quadratic model using modified Angstrom coefficients to estimate global solar radiation, Solar Energy, vol. 45, pp. 85–92, 1990. [23] Besharat F, Dehghan AA, Faghih AR. Empirical models for
estimating globalsolar radiation: a review and case study. Renewable Sustain Energy Rev2013;21:798–821.
[24] A.Angstrom, Solar and atmospheric radiation, Q J R Meteor Soc, vol. 50, pp. 121, 1924.
[25] Ulgen K, Hepbasli A Solar radiation models. Part 2: Comparison anddeveloping new models. Energy Sources 2004;26: 52130.
[26] Almorox J, Hontoria C. Global solar radiation estimation using sunshineduration in Spain. Energy Conversion Manage 2004; 45: 1529–35.
[27] D.B Ampratwumand A.S.S. Dorvlo, ―Estimation of solar radiation from the number of sunshine hours, Applied Energy, vol. 63,pp. 161–167, 1999.
[28] J.Almorox, M. Benito and C. Hontoria, ― Estimation of
monthly Angstrom–Prescott equation coefficients from
measured daily data in Toledo, Spain, Renewable Energy, vol. 30, pp. 931–936, 2005.
[29] Ahmad F, Ulfat I. Empirical models for the correlation of monthly average dailyglobal solar radiation with hours of sunshine on a horizontal surface atKarachi, Pakistan. Turkish J Phys 2004; 28: 301–7.
[30] Tiris M, Tiris Ç, Türe I_E. Correlations of monthly - average daily global, diffuseand beam radiations with hours of bright sunshine in Gebze, Turkey. EnergyConvers Manage 1996;37: 1417–21.
[31] Rehman S. Solar radiation over Saudi Arabia and comparisons with empiricalmodels. Energy 1998;23: 1077–82. [32]. N.A. Elagib and M.G. Mansell ― New approaches for estimating global solar radiation across Sudan, Energy Conversion and Management, vol. 41, no. 5, pp. 419- 434, 2000.