Planning and Programming of the Production
of a Micro-Company of Bags and Bags
Maiza Garonce Ferreira1, Tiago Bittencourt Nazaré2, Paulo Henrique Silva Lopes3
¹Student of Industrial Engineering, Faculdades Integradas de Cataguases-FIC/UNIS ²Master in Engineering Systems Management, Universidade Católica de Petrópolis-UCP ³Specialist in Engineering and Maintenance Management, Universidade Cândido Mendes-UCAM
Cataguases/MG, Brazil
Abstract
Efficient programming is of paramount importance to the competitiveness of companies, in addition to reducing idleness in the resources it provides reliability in the delivery dates. The aim of the present study was to use AS Preactor Express 2016® software to simulate the current production process of a bag and bag company and to test different sequencing alternatives in order to find a method that minimizes the number of back orders existing in the company, and thus contribute to the company's competitiveness. The methodology used was a case study, in which the necessary data were obtained locally through direct observation and documentary analysis. The data were entered into the software and different sequencing alternatives were tested. Comparing the obtained results, it was observed that the backward sequencing by priority presented the best result, since, considering the existence of higher orders, it serves a higher number of orders that have greater representativeness for the company.
Keywords — Sequencing, simulation, AS Preactor Express 2016®.
I. INTRODUCTION
Reference [1] affirms that good planning and efficient programming are essential characteristics for the competitiveness of companies. For him, efficient programming also provides reduced idleness in resources, reliability on delivery dates.
According to [1], the main purpose of scheduling production is to meet deadlines and meet demand, observing planned costs. For the author, programming efficiently defines the best sequencing of production orders in order to optimize the use of resources.
Reference [2] argue that for organizations to be competitive they lack accurate data regarding production programming and delivery times.
The purpose of the present study was to use AS Preactor Express 2016® software to simulate the current production process of a bag and bag company and to test different sequencing alternatives in order to find a method that minimizes the number of existing back orders in the company,
and finally, present the software and tools used in this work, for the management of the company, with the intention of knowing that there is a programming tool to assist in the production of the company and thus contribute to the competitiveness of the same.
II. METHODOLOGY
For the present work, bibliographical research was carried out on articles, books and academic sites from July to October 2018. Research can be classified, as to its nature, as applied with a quantitative approach, in which the researcher aims to generate knowledge for practical application and for this, it is used the quantification both in the collection and in the treatment of the information. As for the objective is an exploratory work in order to provide greater familiarity with the problem and make it more explicit. In relation to the procedures, it is classified as a case study, which according to [3] seeks to know in depth the how and why of a certain event that is supposed to be unique in several aspects, seeking to find what is in it most essential and peculiar. The researcher does not want to interfere with the analyzed item, only to show it the way he perceives it.
A. The company
The company where the case study was carried out is the only one in this branch of bag and bag manufacturing located in the municipality of Santana de Cataguases - MG, in the Zona da Mata Mineira. It is a microenterprise that has been active in the plastics recycling business for the past 16 years, with the production of low and high density polyethylene grains, but since October 2017 the company has a new sector, the target of this research, whose purpose is to manufacture and trade plastic bags and bags. The choice of the sector is justified by the fact that the company does not have a PPCP department, which implies that there is no one responsible for calculating the planning, scheduling and production control stages.
The target sector of the present study has a production system in batches, where each batch produced follows the specifications of the customers. The sector has three production resources: Winding machine, which operates according to Brasília time, from 07:00 a.m. on Mondays to 06:00 a.m. on Saturdays, with a daily pause from 5:00 p.m. to 10:00 p.m. from 06:00 a.m. on Saturday to 07:00 a.m. on Mondays, making a total of 94 hours worked weekly; Sacoleira, operating from 07:00 on Mondays at 06:00 on Saturdays, with a break of 1h for lunch, but for 90h a week and a bag machine, operating from Mondays to Fridays from 07:00 to 17: 00h with a stop of 1h for lunch, totaling 50h a week.
The process of manufacturing the bags begins with the mixing of the polyethylene in order to obtain the desired pigmentation by the customers. In this way, the material is directed to the winding where the extrusion process occurs, the material from this process is rolled forming coils, which serve as raw material for Sacoleira and the bag machine, where they are transformed into finished product. With this, the bags and bags are packed in batches according to the customers' specifications and are then sent to the shipment and sent to the customers.
B. Collection of data
The information needed to carry out the present work was obtained locally through direct observation and documentary analysis, made during technical visits in October 2018, through which data were collected regarding the production system adopted, the sequencing method employed , work shifts, resources used in production, manufactured products, hourly rate of production of each resource and production orders issued.
The data collected were inserted in the Preactor AS Express 2016 software where simulations were made to identify the most appropriate programming method for the company. The results from the use of the tool were analyzed and compared with the current method used by the company, aiming to visualize the gain with the work developed.
C. Time available for production X Time required to meet demand
Using the data related to the work shifts of each resource was calculated the total time available for production in each of them. To that end, the number of days available for production in October 2018 was multiplied by the number of hours worked per day in each resource. Thus, a value of 413 hours was obtained for the Winding Machine, 374 hours for Sacoleira and 198 hours for the bag machine.
To calculate the time needed to meet the demand, the required quantities of each product were multiplied in the month by their respective production rates in each resource, thus obtaining the time required to process each demand. Summing up
resource was met so that demand was met, being 453 hours and 23 minutes for Winding Machine, 267 hours and 11 minutes for Sacoleira and 149 hours and 51 hours minutes for the bag machine.
Comparing the total time needed in each resource to meet the demand with the hours available for production in the month, it is observed that only in the Winding resource the time needed to meet the demand is higher than the time available for production, which suggests a deficiency of capacity to meet the demand, since to fulfill all the orders within the stipulated period, one month, would need a greater number of hours than available.
D. ABC curve
According to [4], the ABC Curve is used to identify items that need a particular attention, classifying them according to their importance to their economic value.
For [5] the ABC Curve can be used for different purposes, such as to obtain inventory sizing, sales, priority setting for production scheduling and final product inventory study.
According to [4] the ABC analysis can be done based on the weekly, monthly or annual consumption value.
Reference [6] informs that in order to perform the ABC classification, it is first necessary to determine the investment corresponding to each item, then the values corresponding to the investments in descending order are placed and the percentage that each item is represented of the total investment, soon after, the accumulated percentage of each item is calculated and based on this value the products are classified in A, B and C.
Reference [7] classifies the items belonging to class A, as those that have the highest monetary values and accumulate up to 80% of it. Class B items are intermediate and accumulate between 80% and 95% of the monetary value and Class C items, which accumulate from 95% to 100% of the monetary value.
According to [6] the items belonging to class A are the most important and require more attention from management, therefore the first decisions should be concentrated to meet these items. Class B items are intermediaries and should receive attention immediately after Class A items. Items belonging to Class C are considered of minor importance and should receive attention only when items A and B have already been dealt with.
In this article, the ABC Curve was used to set priorities for orders for production scheduling and was based on the consumption value for the month of October 2018. The items were classified in A, B and C followed by the percentages 80% 95% and 100%.
E. AS Preactor Express 2016®
Preactor APS. According to [8], the Preactor AS provides a clearer vision and a greater understanding of the production processes, allowing a greater control of the processes, a better utilization of the resources, fulfillment of deadlines, study of impact of hypothetical scenarios and detection of bottlenecks.
According to [9], small businesses face a number of specific difficulties and opportunities and Preactor Express presents itself as the best option for these companies to gain visibility, agility and competitiveness.
III.RESULTSANDDISCUSSIONS
A. Time available and time required for operations
For the analyzed month, October 2018, the time available for production in the Winding feature is 413 hours, while the time required for operation of the resource is 453 hours and 23 minutes, that is, a value greater than the available time, which suggests a lack of capacity in the resource to meet the demand, allowing the occurrence of delays of some orders, since all have maturities for the month analyzed.
Preactor AS Express 2016® software was used to simulate the current production method of the company, through which it was possible to identify the delays and to suggest an optimization of the same through other forms of sequencing available by the software.
B. Current production sequencing model
The data was entered into the AS Express 2016® Preactor Sequencer through import tables provided by the software itself. With the data inserted, the current sequencing method used by the company was simulated, represented in the software as sequencing forward by file order. Fig. 1 shows the view of the Gantt chart obtained with the current schedule.
By means of Fig. 1 it is possible to observe a great number of orders in arrears, represented with a red line in its upper part. Highlighting these
backward orders and their course, we obtain the results shown by Fig. 2.
Fig. 2: Highlight of delayed orders and their route
Analyzing Fig. 2, it can be seen that all orders in arrears originate from the Winding feature, where they are also delayed. It can be observed that the resource can not attend to all orders, without any delays, through the current sequencing method, thus also causing the delays of the other two Sacoleira and Sacos resources that depend on the raw material from the first resource. Fig. 3 shows the scheduling statistics for this sequencing method.
Fig. 3: Schedule statistics
The statistic of the programming generated by the software numerically confirms the already presented by the chart of Gantt, a great number of orders delayed. Of the 110 orders entered into the system, 85 are delivered late.
C. ABC classification of priorities
The same information used to sequence the current model adopted by the company was employed to simulate the new sequencing possibilities, with sequencing forward by priority, forward by reverse priority, backward by priority and backward by reverse priority. For these four methods it was necessary to add new information, priorities to the orders.
To determine the priority of each order, the ABC classification criterion was used for the products analyzed, the results are presented in graph 1.
Fig. 1: Gantt chart of the current method of enterprise programming
Graph 1: ABC curve of the products
Graph 1 shows that the items classified as A accumulate up to 80% of the total sales of the month analyzed, therefore they require more attention, they are classified as of greater importance and for this fact they have been assigned priority 1. Items classified as B accumulate up to 15% of the billing and require medium attention, therefore, they were assigned priority 2 and items classified as C, which demand little attention, priority 3.
D. Production Sequencing Alternatives
In order to reduce the number of backlog requests, different forms of sequencing available through Preactor AS Express 2016 ® software were simulated.
1. Sequencing forward by priority
The forward sequencing by priority schedules to the earliest possible date the most important activities, that is, those in which it was assigned by the ABC priority 1 classification, then those of priority 2 and priority 3. The statistics of the programming obtained by this the method is presented in Fig. 4.
Fig.4: Programming statistics for forward sequencing by priority
The statistic generated by this method shows a relative improvement when compared to the current model, but there are still a large number of back orders, since 48.18% of the orders are delivered late.
2. Forward Sequencing by Reverse Priority
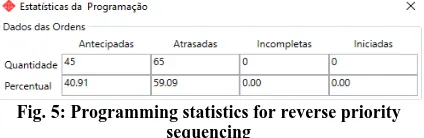
This method schedules as early as possible the orders that have the highest priority value, and then the lower value orders, that is, the lower orders take precedence over the most important orders. The programming statistic for this rule is shown in Fig. 5.
Fig. 5: Programming statistics for reverse priority sequencing
The results presented in Fig. 5 show that forward
the current model, but worse than the previously presented method.
3. Forward sequencing by delivery date
Forward sequencing by delivery date prioritizes orders with shorter delivery times by respecting the earliest start date and the processing times of the previous order. Thus, for productions with diversified lot sizes, a large number of delays can occur, since this method postpones the production of orders that have a little longer term. Fig. 6 presents the results obtained with the simulation of this method.
Fig. 6: Programming statistics for sequencing forward by date of delivery.
The programming statistic presented in Fig. 6 indicates a delay of 67, 27% of the orders, a result even worse than those previously proposed.
4. Back Sequencing by File Order
Each order is sequenced back from its delivery date and respecting the sequence in which they were entered into the system. Fig. 7 shows the results obtained by means of the simulation of this rule.
Fig. 7: Programming statistics for backward sequencing by file order.
The method presents no delays, but presents incomplete orders since they had operations scheduled before the present moment. Although the model did not program some orders, when compared to the other methods presented, it obtained the best performance when attending the highest number of orders 83.64%.
5. Backward Sequencing by Priority
The orders are sequenced backwards from their delivery date, and the most important ones have their delayed schedule in the resource in relation to those of higher priority, less importance. The results obtained with the simulation of this method are shown in Fig. 8.
Priority backward sequencing showed a performance of 84.55% of orders, and although it was 15.45% incomplete, the fact that the rule gives preference to resources for minor orders and postpones the most important orders tends to to schedule for before the present moment those of lesser importance, causing them to be discharged and more important orders to be sequenced.
6. Reverse Priority Sequencing
It differentiates itself from sequencing backwards by priority only in meeting the priorities, which in this case are the most important orders that have preference in the resource and the ones that have less importance are sequenced later, respecting the delivery date. Fig. 9 shows the results obtained by this method.
Fig. 9: Programming statistics for backward sequencing by reverse priority
This method, in addition to presenting a schedule statistic lower than the one presented previously, causes a larger number of important orders to be scheduled before the present date, thus becoming incomplete.
7. Backward sequencing by delivery date
Schedule the execution of orders as late as possible, respecting the delivery dates, the processing times of the previous order and giving preference to the resource for orders with longer lead times. The programming statistic for this rule is shown in Fig. 10.
Fig. 10: Programming statistics for sequencing backwards by delivery date.
The backward sequencing by date of delivery presented a performance of 88.18% of orders, the best observed until then, but this method does not take into account the existence of priority orders, that is, orders that are of greater importance to the company, and therefore should receive more attention.
E. Analysis of results
Comparing the performances obtained through the simulations, the sequencing that presented the best results was: backward sequencing by date of delivery, with 97 orders answered and 13 incomplete and sequencing backwards by priority, with 93 orders answered and 17 incomplete.
The sequencing backwards by date of delivery despite attending to a greater number of orders, does not take into account the existence of higher orders, thus, of the 13 orders that the method leaves as incomplete, 11 have priority 1. Already the sequencing backward by priority, despite having served a smaller number of orders and presenting a larger number of incomplete orders, it takes into account the existence of higher orders, thus the 17 orders that the method leaves as incomplete only 9 have priority 1. The relation of incomplete orders and their respective priorities are presented in Fig. 11, for both methods.
Analyzing Fig. 11 it is possible to notice that backward priority sequencing leaves a smaller number of important orders (priority 1) as incomplete, that is, it serves a larger number of important orders for the company and therefore, it is the method recommended by this work.
In order to optimize the number of incomplete orders obtained with the recommended sequencing, a new simulation of this method was performed, however adding another 20 hours of work per week to the Winding resource, which does not have capacity to meet demand through shifts existing workplaces.
The resource works according to Brasília time, from 7:00 am on Mondays to 06:00 on Saturdays, with a break from Monday to Friday from 5:00 p.m. to 10:00 p.m. and 6:00 p.m. Saturday at 07:00 a.m. on Monday. The new model proposes an increase of 5 hours per day from Monday to Friday, from 5:00 p.m. to 10:00 p.m., ie the resource would work from 7:00 a.m. on Mondays at 06:00 a.m. on Saturday, pausing only from 06:00 p.m. on Saturday to 07:00 p.m. on Monday. The scheduling statistic for backward priority sequencing with the addition of hours is shown in Fig. 12.
Fig. 12: Programming statistics for overtime method
As noted by the figure, even adding hours to the appeal, 4.55% of orders still remain incomplete. Fig. 13 highlights these orders in the Winding feature and its characteristics.
Fig. 13: Incomplete orders
Analyzing the Fig. 13 it is observed that the orders that were not programmed have execution period between the days 01/10/2018 to 09/10/2018. Observing the level of use of the resource for this period is presented by Fig. 14.
Fig. 14 shows that for the analyzed period, 01/10/2018 to 09/10/2018, the Winding resource is mostly working, and it is not possible to execute the orders presented in figure 14, which suggests an overload of orders for the period.
IV.CONCLUSION
Efficient scheduling is of paramount importance to the competitiveness of companies, in addition to reducing idleness in the resources it provides reliability in the delivery dates. Therefore, in order to minimize the number of backlog requests, the AS Preactor Express 2016® software was used to simulate different sequencing alternatives and to identify a method that meets the purpose of the work.
The recommended option for sequencing in the
sequencing, since in addition to meeting 84.55% of production orders it takes into account the existence of priorities, making a larger number of important orders are scheduled.
Although the method does not leave orders late, it leaves 15.45% of orders incomplete, since, the sequencing back schedules the orders respecting the delivery date. Therefore, to meet them it would be necessary to program them before the present moment.
In order to optimize the number of incomplete orders generated by backward sequencing by priority, a new simulation of the production process was adopted adopting the proposed sequencing, however, adding another 5 hours of work daily to the resource that did not have the capacity to meet the demand using only the existing working hours. The new simulation identified that 4.55% of the orders are still incomplete, analyzing the characteristics of these orders and the level of use of the resource, it was verified that for the period in which these orders are promised, therefore, it is not possible to comply with the orders within the delivery period, as there is an overload of orders for the same period, which suggests that the company does not have a criterion for establishing deadlines of the orders.
Therefore, this work proposes that the analyzed company adopts the sequencing backwards by priority and suggests that it take the tools presented in this work as a way of assisting it in the planning and scheduling of its production and in the elaboration of delivery times, of this their competitiveness.
REFERENCES
[1] D. M. Nunes; P. A. C. Melo and I. S. C. Nigro.
Planejamento, Programação e Controle da Produção: o uso da simulação do PREACTOR em uma indústria de
alimentos. Salvador:ENEGEP, 2009.
[2] G. C. Meneghello and D. S. Martins. APS (Advanced
Planning & Scheduling) – A utilização do sistema de capacidade finita como diferencial competitivos. Revista Eletrônica de Graduação- Regrad - UNIVEM, Marília, São Paulo, v. 8, n. 1, p. 51-74, 2015.
[3] J. J. S. Fonseca, “Metodologia da pesquisa científica”. Fortaleza: UEC, 2002.
[4] L. A. Silva, G. M. B. Araújo, T. D. C. Carneiro and P. P. P. Araújo. “Compreendendo os itens de maior rotatividade de uma MPE do setor gastronômico através da Curva ABC: estudo de caso no restaurante ponto certo em Caicó/RN”. Revista Livre de Sustentabilidade e Empreendedorismo, vol. 3, n. 2, p. 97-135, 2018.
[5] H. Pozo, Administração de Recursos Materiais e
Patrimoniais. 6th ed., Ed. Atlas, 2010.
[6] B. T. Santos and Cleidice Lubiana. O uso da curva ABC para a tomada de decisão na composição de estoque. Ouro Preto: UNEOURO, 2017.
[7] C. K Oliveira, H. G. Menck, , P. Y. Takito, E. R. Cirilo, P. L. Natti and E. R. T. Natti. Stock Management (Gestão de Estoques).Coronell University Library.2018
[8] (2016) The Siemens website. [Online]. Available:
http://www.siemens.com/preactorCopyright© Siemens AG 2016. Revision 43727
[9] (2011) The Preactor website. [Online]. Available: