Pairwise document similarity measure
based on present term set
Marzieh Oghbaie
*and Morteza Mohammadi Zanjireh
Introduction
In text mining, a similarity (or distance) measure is the quintessential way to calcu-late the similarity between two text documents, and is widely used in various Machine Learning (ML) methods, including clustering and classification. ML methods help learn from enormous collections, known as big data [1, 2]. In big data, which includes masses of unstructured data, Information Retrieval (IR) is the dominant form of information access [3]. Among ML methods, classification and clustering help discover patterns and correlations and extract information from large-scale collections [1]. These two tech-niques also offer benefits to different IR applications. For example, document clustering can be applied to the document collection to improve search speed, precision, and recall or to the search results to provide more effective information presentation to user [3]. Document classification is also used in vertical search engines [4] and sentiment detec-tion [5].
In large-scale collections, one of the challenging issues is to identify documents with high similarity values, known as near-duplicate documents (or near-duplicates) [6–8]. Integration of heterogeneous collections, storing multiple copies of the same document, and plagiarism are the main causes for the existence of near-duplicates. These docu-ments increase processing overheads and storage. Detecting and filtering near-duplicates
Abstract
Measuring pairwise document similarity is an essential operation in various text mining tasks. Most of the similarity measures judge the similarity between two documents based on the term weights and the information content that two documents share in common. However, they are insufficient when there exist several documents with an identical degree of similarity to a particular document. This paper introduces a novel text document similarity measure based on the term weights and the number of terms appeared in at least one of the two documents. The effectiveness of our measure is evaluated on two real-world document collections for a variety of text mining tasks, such as text document classification, clustering, and near-duplicates detection. The performance of our measure is compared with that of some popular measures. The experimental results showed that our proposed similarity measure yields more accu-rate results.
Keywords: Similarity measure, Distance metric, Document clustering, Document classification, Near-duplicates detection, Information retrieval
Open Access
© The Author(s) 2018. This article is distributed under the terms of the Creative Commons Attribution 4.0 International License (http://creat iveco mmons .org/licen ses/by/4.0/), which permits unrestricted use, distribution, and reproduction in any medium, provided you give appropriate credit to the original author(s) and the source, provide a link to the Creative Commons license, and indicate if changes were made.
METHODOLOGY
*Correspondence: [email protected]. ac.ir
can address these issues and also improve the search quality [6]. Using a similarity meas-ure is a quantitative way to define two documents as near-duplicates [7].
For a collection of text documents, an appropriate document representation model is required, such as Vector Space Model (VSM) [9]. According to VSM, each document is represented as an M-dimensional vector in which each dimension corresponds to a vocabulary term or a feature. The exact ordering of terms in the document is also dis-carded (the Bag-of-Words Model [3]). The vocabulary includes all terms that appear in the document collection. A term or feature can be a single word, multiple words, a phrase1 or other indexing units [9, 10]. The weight of a term represents the importance of it in the relevant document and is assigned by a term weighting scheme [11]. Term frequency (tf) [3], inverse document frequency (idf) [12], or multiplication of tf and idf (tf-idf) [13–15] are commonly used term weighting schemes. In large-scale text docu-ment collections, using VSM results sparse vectors, i.e., most of the term weights in a document vector are zero [16, 17]. High dimensionality can be a problem for computing the similarity between two documents.
Using VSM, there are numerous measures to calculate pairwise document similarity. For instance, Euclidean distance is a geometric measure used to measure the distance between two vectors [18, 19]. Cosine similarity compares two documents with respect to the angle between their vectors [11]. Similar to two previous measures, Manhattan distance is also a geometric measure [20, 21]. For two 0–1 vectors,2 the Hamming dis-tance [17] is the number of positions at which the stored term weights are different. The Chebyshev distance [16] between two vectors is the greatest of absolute differences along any dimension. A similarity measure for text processing (SMTP) [17] is used for comparing two text documents. SMTP can also be extended to measure the similarity between two document collections. Heidarian and Dinneen [18] proposed a novel geo-metric measure to determine the similarity level between two documents. An Informa-tion-Theoretic measure for document Similarity (IT-Sim) is a similarity measure based on information theory [22]. Based on the Suffix Tree Document (STD) model, Chim and Deng [23] proposed a phrase-based measure to compute the similarity between two documents. Sohangir and Wang [16] proposed a new document similarity meas-ure, named Improved Sqrt-Cosine (ISC) similarity. Jaccard coefficient [24] calculates the ratio of the number of terms used in both documents to the number of terms used in at least one of them.
In context of document classification and clustering, there have been numerous researches on the effectiveness of different similarity measures. For instance, Subhashini et al. [25] evaluated the clustering performance of different measures on three web docu-ment collections. The results of their experidocu-ment showed that Cosine similarity performs better than Euclidean distance and Jaccard coefficient. Hammouda and Kamel [9] pro-posed a system for web document clustering. In their system, a phrase-based similarity measure was used to calculate the similarity between two documents. D’hondt et al. [11] proposed a novel dissimilarity measure for document clustering, called pairwise-adaptive. This Cosine-based measure selects the K most important terms of each document based
1 A sequence of words.
on their weights and reduces the dimensionality to the document’s most important terms. Thus, pairwise-adaptive has lower computational burden and is applicable in high dimen-sional document collections. Lin et al. [17] used SMTP for text clustering and classification. Moreover, the effect of various similarity measures on the performance of near-duplicates detection has been investigated in recent researches. For instance, Rezaeian and Novikova [8] used Hamming distance to discover plagiarism in Russian texts. Xiao et al. [7] proposed a new algorithm, which is useful in detecting near-duplicate documents. They adopted their proposed algorithm to commonly used similarity measures, such as Jaccard coeffi-cient, Cosine similarity, and Hamming distance. Hajishirzi et al. [26] proposed a new vector representation for documents. Using their method, Jaccard coefficient and Cosine similar-ity provide higher near-duplicates detection accuracy.
As explained in more detail in “Proposed similarity measure” section, most of the similar-ity measures judge the closeness of two documents to each other based on the term weights. Although, term weights provide important information about the similarity between two documents, sometimes similarity judgment based on the term weights alone is not sufficient. The motivation behind the work in this paper is that we believe that pairwise document sim-ilarity should be based not only on the term weights but on the number of terms appeared in at least one of the two documents, as well. In this paper, we propose a new measure to com-pute the similarity between two text documents. In this symmetric measure, the similarity increases as the number of terms used in both documents, present terms, and the informa-tion content associated with these terms increases. Furthermore, the terms used in only one of the two documents, presence-absence terms, contribute to the similarity measurement.
We conduct a comprehensive experiment to evaluate the effectiveness of our proposed measure on the performance of several text mining applications, including near-duplicates detection, single-label classification, and K-means like clustering. The obtained results show that our proposed similarity measure improves the efficiency of these algorithms. The rest of this paper is organized as follows: “Related work” presents the background of simi-larity measures. “Proposed similarity measure” section introduces the proposed similarity measure. “Methods” and “Results and discussion” sections discuss experiment details and experimental results, respectively. Finally, the conclusion and the discussion about future work are given in the last section.
Related work
In this paper, the VSM is selected as the document representation model; d is the vector of document d. Furthermore, M and N indicate the size of vocabulary and the number of doc-uments in the document collection, respectively. Some of the measures have been briefly reported in the previous section, but this section covers some popular measures for com-puting the similarity between two text documents.
Cosine similarity [16] computes the Cosine of the angle between −→d1 and −→d2:
where d
is the Euclidean norm of the vector d and − →
d1.−→d2 denotes the inner product of −
→
d1 and −→d2 . Using positive term weights, Cosine similarity ranges from 0 to 1.
(1) Cosine-similarity(d1,d2)=
− →
d1·−→d2
Euclidean distance [27] between two documents is defined as follows (wji is the ith term weight in document j):
Manhattan distance or “sum-norm” [28] computes the sum of absolute differences between the respective coordinates of two document vectors:
Chebyshev distance or “max-norm” [19] is the greatest of absolute differences along any coordinate of two document vectors:
Jaccard coefficient [29] measures the overlap between two documents each repre-sented by a set:
Using real-valued features, Extended Jaccard coefficient (EJ) [24] is a length-depend-ent similarity measure:
Lin [28] proposed an information-theoretic definition of similarity. According to his definition, the similarity between two objects is the ratio of information which two objects share in common to the information describing both objects. IT-Sim [22] was proposed with respect to Lin’s definition of similarity:
where pd,t is the normalized occurrence of term t in document d and π(t) is the fraction of the collection documents containing term t.
SMTP [17] calculates the similarity between two documents and considers a constant penalty, λ, for any presence-absence term:
(2) Euclidian-distance(d1,d2)=
M i=1
(w1i−w2i)2
(3) Manhattan-distance(d1,d2)=
M
i=1
|w1i−w2i|
(4) Chebyshev-distance(d1,d2)=MAX(|w1i−w2i|)
(5) J(d1,d2)=
d1∩d2
d1∪d2
.
(6) EJ(d1,d2)=
− → d1·−→d2
− →
d1·−→d1+−→d2·−→d2−−→d1·−→d2
(7) IT_Sim(d1,d2)=
2· tmin
pd1,t,pd2,t
·logπ (t)
tpd1,tlogπ (t)+
tpd2,tlogπ (t)
(8) SMTP(d1,d2)=
F(d1,d2)+
+1
(9) F(d1,d2)=
M
i=1N∗(d1i,d2i)
M
where λ is calculated according to the properties of the document collection and σi is the standard deviation of all non-zero weights for term i in the training set.
Proposed similarity measure
Problem definition
When comparing two documents, terms can be partitioned into three groups [17]: (1) the terms that occur in both documents (present terms), (2) the terms that occur in only one of the two documents (presence–absence terms), and (3) the terms that occur in none of the two documents (absent terms). According to this partitioning, there are six preferable prop-erties for a document similarity measure [17]:
1. The presence or absence of a term is more important than the difference between two non-zero weights of a present term.
2. The similarity degree between two documents should decrease when the difference between two non-zero weights of a present term increases.
3. The similarity degree should decrease when the number of presence-absence terms between two documents increases.
4. Two documents are least similar to each other, if there is no present term between them.
5. The similarity measure should be symmetric:
6. The distribution of term weights in the document collection should contribute to the similarity measurement.
According to these properties, the measures described in “Related work” section have one or more deficiencies. For example, Cosine similarity does not satisfy Properties 3 and 6, and Euclidean distance does not meet Properties 1, 3, 4, and 6 [17].
Although SMTP was proposed based on these properties, some drawbacks influence its performance and accuracy: First, SMTP cannot calculate similarity when the standard deviation of a particular term is (or tends to) zero. Nagwani [30] proposed an improve-ment to cover this imperfection and added a suppleimprove-mentary condition to (10). A new ver-sion of N∗(d1i,d2i) is given in (12) and the equations for SMTP(d1,d2) , F(d1,d2) , and also
N∪(d1i,d2i) were not changed.
(10) N∗(d1i,d2i)=
0.5 �
1+exp �
−�d1i−σid2i �2��
, if d1id2i>0
0, if d1i=0and d2i=0
−, otherwise
(11)
N∪(d1i,d2i)=
0, if d1i =0and d2i=0 1, otherwise
Second, λ is determined according to the properties of document collection, therefore all absence terms have identical importance; that is, the weight of presence-absence terms has no contribution to the similarity measurement and also the weight distribution is only taken into consideration for the present terms.
Careful examination of similar documents in different instances showed that two documents with the highest similarity degree use almost identical term sets. In other words, the more terms two documents have in common, the more similar they are. In such cases, some of the well-known measures cannot recognize the most similar docu-ments. The following example clarifies the case. Suppose three documents d1, d2, and d3 with four terms and tf as term weighting scheme. Further, the terms are not shared by all the documents of the collection. Our goal is to find the most similar document to d1.
Example 1
Using Manhattan distance, the distance between d1 and d2 and also the distance between d1 and d3 is 10. This same similarity indicates that both d2 and d3 share same amount of information with d1, however, a clear difference can be seen between the number of present terms; d1 and d2 use same term set, but d1 and d3 only share one term in common. Using Cosine similarity, the similarity between d1 and d2 is 0.763, and the similarity between d1 and d3 is 0.831. Although d1 and d2 both use same term set, Cosine similarity selects d3 as the most similar document to d1.
Example 2 In another example, suppose we have three documents as follows:
d1 = “this garden is different because it only has different types of vegetables.”
d2 = “different types of vegetables are growing in this garden. This garden only has vegetables.”
d3 = “different types of vegetables growing in your garden can have different benefits for your health.”
The vocabulary contains 7 terms: 〈types, different, garden, vegetables, growing, benefits, health 〉, and document vectors are as follows:
(12) N∗(d1i,d2i)=
1, if d1i=d2i and d1i,d2i>0
0.5 �
1+exp �
−�d1i−d2i
σi
�2��
, if d1id2i>0
0, if d1i=0and d2i=0
−, otherwise
.
d1= �2, 3, 3, 7�
d2= �2, 1, 1, 1�
It is obvious that both documents d1 and d2 talk about one types of garden, which con-tains only vegetables. But the third document talks about types of vegetables which are beneficial for your health. Although, the second document is the most similar one to the first document, EJ and Euclidean distance select d3 as the most similar document to d1:
As can be seen from previous examples, the measures described in “Related work” sec-tion, such as EJ, Euclidean, Manhattan, and Cosine, are insufficient to determine the most similar documents, because they judge the similarity between two documents based on the term weights alone. Based on these observations, we conclude that an appropriate similarity measure should take the number of present terms into account to achieve more accurate similarity value.
However, the number of present terms offers efficient benefits to the similarity calcula-tion between two documents, but it alone is not sufficient. Third example clarifies this case (we have the same assumption mentioned in Example 1).
Example 3
In this example, if we want to find the most similar document to d1, the number of pre-sent terms alone cannot help, because d2 and d3 both have 4 terms in common with d1. Using Manhattan distance, the distance between d1 and d2 is 12 and the distance between d1 and d3 is 3. If we use Cosine similarity, the similarity between d1 and d2 is 0.9569 and the similarity between d1 and d3 is 0.989. Accordingly, in this example, both Manhattan distance and Cosine similarity accurately recognize the most similar docu-ment to d1. Therefore, it is possible that two documents use same term set but have dif-ferent contents, because the associated terms have difdif-ferent weights. In such cases, most of the similarity measures can accurately judge the similarity between documents.
The third example shows that the number of present terms alone cannot capture all the similarity information between documents and the term weights are still required. But in cases like Examples 1 and 2, the number of present terms can help to find documents with the highest similarity degree.
d1= �1, 2, 1, 1, 0, 0, 0� d2= �1, 1, 2, 2, 1, 0, 0� d3= �1, 2, 1, 1, 1, 1, 1�
.
EJ(d1,d2)=0.636<EJ(d1,d3)=0.7
Euclidean(d1,d2)=2<Euclidean(d1,d3)= √
3.
d1= �1, 7, 7, 4�
d2= �1, 2, 2, 2�
d3= �1, 6, 6, 5�
Pairwise document similarity measure
In this section, we introduce the proposed similarity measure. As explained earlier, the number of present terms and their weights play an important role in accurately judging the similarity between the documents and help find the most similar ones. The idea is that the shared information content created by more number of present terms is more informa-tive than that created by fewer present terms. In other words, if two documents use similar term sets, they tend to have more similar content and theme.
Based on this idea, we add a new property to the preferable properties mentioned earlier for a similarity measure:
7. Similarity degree should increase when the number of present terms increases.
We also suggest ignoring 6th property, which is related to the weight distribution of terms in the document collection. According to 6th property, the importance of a term in the document collection (discrimination power [3]) is essential and the term with higher idf is more informative. But this property can be involved in the term weighting scheme rather than the similarity measure. This makes the process of assessment easier and we can also check the effect of different term weighting schemes on the performance of similarity measures. For example, if we use tf-idf as the term weighting scheme, the importance of rare terms, which have higher idf, is considered in similarity measurement. Table 1 shows the lack of preferable properties in the similarity measures mentioned in “Related work” section.
Based on the modified version of preferable properties for a similarity measure, we pro-pose a new similarity measure, called PDSM (pairwise document similarity measure). PDSM is defined in (13):
Where intersection and union of two documents are calculated as follows (wji > 0 is the ith term weight in document j):
(13)
PDSM(d1,d2)=
d1∩d2 d1∪d2
× PF(d1,d2)+1 M−AF(d1,d2)+1
(14)
d1∩d2= M
i=1
Min(w1i,w2i)
Table 1 Deficiencies of some popular measures according to the preferable properties for a similarity measure
Properties satisfied by all measures are not represented in this table
Measure Property 1 Property 3 Property 4 Property 7
Cosine ✗ ✗
Euclidean ✗ ✗ ✗ ✗
Manhattan ✗ ✗ ✗ ✗
Pair-wise adaptive ✗ ✗
Chebyshev ✗ ✗ ✗
EJ ✗ ✗
IT-SIM ✗ ✗
PF(d1, d2) and AF(d1, d2) are the number of present terms and the number of absent terms, respectively. To avoid Divide-by-Zero error, 1 is added to numerator and denominator. Like most of the similarity measures, such as Cosine similarity and Euclidean distance, the time complexity of PDSM is linear to the dimensionality of the document vector (i.e. O(M)). We assess PDSM based on the modified version of preferable properties for the similarity measure in the following.
Property 1 Let d1and d2be two documents and vocabulary contains one term, and wi be the ith term weight. Consider the following two cases (a, b, c > 0): (1) d1 =〈a〉, d2 = 〈b〉, and (2) d1 = 〈c〉, d2= 〈0〉. In the first case, PDSM(d1, d2) > 0 and in the second case PDSM(d1, d2) = 0. Obviously, the importance of presence and absence of terms is consid-ered in PDSM.
Property 2 Let d1, d2, and d3 be three documents and vocabulary contains one term, and wi be the ith term weight. Consider the following case (a, b, c > 0 and a > b > c): d1 = 〈a〉, d2=〈b〉, and d3 = 〈c〉. Then we have
Since b > c, the similarity between d1and d2is greater than that between d1and d3
Property 3 Let d1, d2, and d3be three documents and vocabulary contains M terms, and wibe the ith term weight. Consider the following case (a, b, c > 0 and a < b < c): d1=〈x1, x2, x3,…, xa, 0, 0,…, 0〉, d2=〈y1, y2, y3,…, yb, 0, 0, …, 0 〉, d3=〈z1, z2, z3,…, zc, 0, 0,…, 0 〉. If
Then we have
(15)
d1∪d2= M
i=1
Max(w1i,w2i).
PDSM(d1,d2)= b a ×2 2 = b a
PDSM(d1,d3)=
c a ×2 2 = c a.
(PDSM(d1,d2) >PDSM(d1,d3)).
d1∩d2=d1∩d3=X
d1∪d2=d1∪d3=Z.
PDSM(d1,d2)=
X Z
× a+1
M−(M−b)+1 =
X Z ∗
a+1
b+1
PDSM(d1,d3)=
X Z
× a+1
M−(M−c)+1 =
X Z ∗ a+1
c+1
Since the number of presence-absence terms between d1 and d3 is greater than that between d1and d2, the similarity degree between d1and d2is greater than that between d1and d3.
Property 4 If there is no present term between two documents, then
Consequently PDSM(d1, d2) has minimum value ofd1∪0d2 =0. Moreover, when d1and d2 are identical and d1has t non-zero terms (wi > 0 is the ith term weight), we have
Therefore, for any two documents d1and d2we have
Property 5 For any two documents d1 and d2, PDSM (d1, d2) is symmetric. Equa-tions (14) and (15) are independent of the order of terms. PF(d1, d2) and AF(d1, d2) are determined by the number of present and absent terms, respectively, therefore, are order-independent. Thus,
Property 6 As stated earlier, this property can be involved in the term weighting scheme.
Property 7 Let d1, d2, and d3be three documents, vocabulary contains M terms, and wi be the ith term weight. If
Then
PDSM(d1,d2) >PDSM(d1,d3).
d1∩d2=0.
T =d1∩d2=d1∪d2=
M
i=1
wi
PDSM(d1,d2)=
T T
× t+1
M−(M−t)+1 =1.
0≤PDSM(d1,d2)≤1.
PDSM(d2,d1)=PDSM(d1,d2).
d1∩d2=d1∩d3=X
d1∪d2=d1∪d3=Z
PF(d1,d2)=a>PF(d1,d3)=b
AF(d1,d2)=AF(d1,d3)=c.
PDSM(d1,d2)=
X Z
× a+1
Consequently
Since the number of present terms between d1 and d3 is less than that between d1 and d2, PDSM(d1, d2) is greater than PDSM(d1, d3). At the end of this section, we give an example to illustrate how PDSM calculates the similarity between two documents.
Example 4 Suppose we have the vectors of two documents, d1 and d2, in seven dimen-sions. We use tf as the term weighting scheme.
Then, using PDSM, the similarity between d1 and d2 is
Methods
In order to test the effectiveness of our proposed similarity measure, we apply PDSM in several text mining applications, including the shingling algorithm for near-dupli-cate documents detection [3], k Nearest Neighbors (kNN) for single-label classifica-tion [3], and K-means clustering [31, 32]. In this experiment, the VSM is selected as the document representation model. Further, the programming languages used are C and Python. The experiment is performed on the machine which its properties are represented in Table 2.
In the context of kNN and K-means, we compare the performance of PDSM with that of other four measures, Euclidean distance, Cosine similarity, EJ, and Manhattan. Moreover, to see the effect of different term weighting schemes on the performance of PDSM, we employ some popular weighting schemes, including tf and tf-idf. We also apply the Cosine normalization factor (16) [33] to tf and tf-idf (tf-normal and tf-idf-normal).
In the shingling algorithm, we use PDSM and Jaccard coefficient as the similarity measure.
PDSM(d1,d3)=
X Z
× b+1
M−c+1.
PDSM(d1,d2) >PDSM(d1,d3).
d1= �1, 2, 1, 1, 0, 0, 1�
d2= �1, 1, 2, 2, 1, 0, 0�
.
PDSM(d1,d2)=
4 9
× 4+1
7−1+1 =0.3175.
(16) Cosine-nomalization-factor=
M
Applications
This section gives a brief description for three applications used in this experiment.
K‑means clustering
K-means [31] is one of the mostly used clustering algorithms. It is generally very fast and simple. Using K-means, the document collection is clustered as follows (the num-ber of clusters, K, is specified in advance):
1. K documents are selected randomly as initial cluster centers or seed-points.
2. Each document d in the document collection is assigned to one of the K clusters whose center is closest to d. The closeness between the cluster centers and d is calcu-lated by a similarity measure or distance metric.
3. For each cluster, ci, its center is set to the mean of the documents in ci.
4. Steps 2 and 3 are repeated until a stopping criterion is met (e.g. until all cluster cent-ers converge or a fixed number of iterations has been completed).
kNN classification
When each document in the document collection belongs to only one category, kNN [3] is one of the well-known classification algorithms. Generally, in the context of clas-sification, documents of the collection are partitioned into two separate sets: a training set, which is used to learn a classifier, and a test set, which is used to evaluate the perfor-mance of the learned classifier. Using kNN classification, the category (class) of a given document d is obtained as follows (the parameter k is specified in advance):
1. Using a similarity measure or distance metric, the closeness between d and all the documents in the training set is calculated.
2. The class of d is assigned to the majority class of its k nearest neighbors.
The shingling algorithm
Shingling [6] is a well-known solution to the problem of detecting near-duplicate docu-ments. In the shingling algorithm, each document is converted to a set of all consecutive sequences of k terms, called k-shingles, where k is a parameter. Two documents are near-duplicate, if their k-shingles are nearly the same. In this algorithm, a similarity measure is used to measure the degree of overlap between k-shingles. Jaccard coefficient is the commonly used similarity measure in the shingling algorithm. If the similarity of two documents is more than a given threshold, the algorithm regards them as near-dupli-cates otherwise original ones.
Table 2 Machine specification
RAM (Random Access Memory) CPU (Central Processing Unit) Operating System
Document collections
In this experiment, we use two document collections, named Reuters-8 (R8) [34, 35] and WebKB [34, 35], respectively. WebKB and R8 are publicly available in [35]. Table 3 shows the properties of R8 and WebKB.
The ModApte split of Reuters-21,578 collection contains documents appeared in Reu-ters newswire in 1987. This collection is manually collected and labeled. R8 [34] is one of the subsets of Reuters-21,578 and contains only single-labeled documents. R8 contains 8 of the 10 most frequent classes containing at least one training and one test document. Category (class) distribution for the R8 collection is presented in Table 4.
The WebKB collection contains web pages collected by the World Wide Knowledge Base (Web→KB) project of the CMU3 text learning group in 1997. These documents belong to the computer science departments of various universities and are manually classified into 7 categories. In the version used in this experiment, three categories were ignored, because they only contained a few pages from each university or the differences among the documents of each category were high [34]. In the WebKB collection, docu-ments are randomly split into training and test sets. Category (class) distribution for the WebKB collection is presented in Table 5.
Porter stemmer [36] has been applied to both collections and stop words [37] and words with less than three characters are also removed.
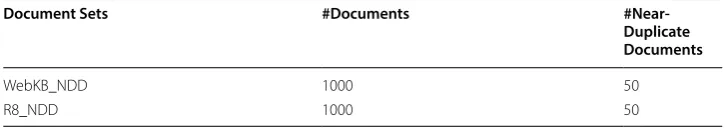
To investigate the performance of PDSM in detecting near-duplicate documents, we have prepared two various document sets (Table 6), WebKB_NDD [38] (WebKB_near duplicate detection) and R8_NDD [38] (R8_near duplicate detection), which are sub-sets of WebKB and R8,4 respectively. Each set contains 1000 documents selected ran-domly. Moreover, we manually changed the content of some documents to create near-duplicates.
Evaluation metrics
In order to investigate the quality of clusters created by K-means with different simi-larity measures, ACcuracy (AC) (17) and Entropy (En) (18) [17] are adopted. AC tells us how many documents with the identical label are assigned to the same cluster. The higher the AC, the better the cluster is. On the other hand, En gauges the homogene-ity of the cluster [9]. The higher the entropy of a cluster, the more inferior the cluster is.
(17)
AC=
K i=1maxi
N
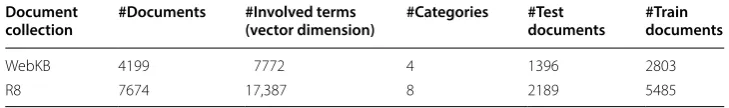
Table 3 Properties of real-world document collections
Document
collection #Documents #Involved terms (vector dimension) #Categories #Test documents #Train documents
WebKB 4199 7772 4 1396 2803
R8 7674 17,387 8 2189 5485
3 Central Michigan University.
In the ith cluster, ni is the cluster size, maxi is the majority number of documents with the identical label, and nji is the number of documents with label j.
To evaluate the kNN classifier’s quality, we use ACcuracy [17] (AC) (19). AC com-pares predicted label of each document, c’i, with its target label, ci.
where N’ is the size of the test set. For the ith document, if c’i = ci, then E
ci,c ′ i
= 1, oth-erwise 0.
The performance of the shingling algorithm is evaluated by precision (20) and recall (21) [6, 8]:
(18)
En=
K i=1ni
p
j=1− nji nilog
nji ni
Nlogp .
(19)
AC= N′
i=1E
ci,c ′ i
N′
(20)
Precision= tp
tp+fp
Table 4 Category distribution for the R8 collection
Category (class) #Documents
Acq 2292
Crude 374
Earn 3923
Grain 51
Interest 271
Money-fx 293
Ship 144
Trade 326
Table 5 Category distribution for the WebKB collection
Category (Class) #Documents
Course 930
Faculty 1124
Project 504
Student 1641
Table 6 Properties of document sets used in near-duplicates detection experiment
Document Sets #Documents
#Near-Duplicate Documents
WebKB_NDD 1000 50
tp is the number of near-duplicates detected correctly, fp is the number of completely different documents detected as near-duplicates, and fn is the number of near-duplicates that are not recognized.
As a more complete criterion, F-measure (22) [3, 6, 8] is the weighted harmonic mean of recall and precision. This measure trades off precision versus recall.
Results and discussion
In this section, we provide the results of our experiments and compare the perfor-mance of PDSM with that of other similarity measures used in kNN, K-means, and the shingling algorithm.
Classification results
In this section, kNN classification results are presented. For WebKB and R8, we trained the kNN classifier on the training set and evaluated it on the test set, using AC defined in Eq. (19).
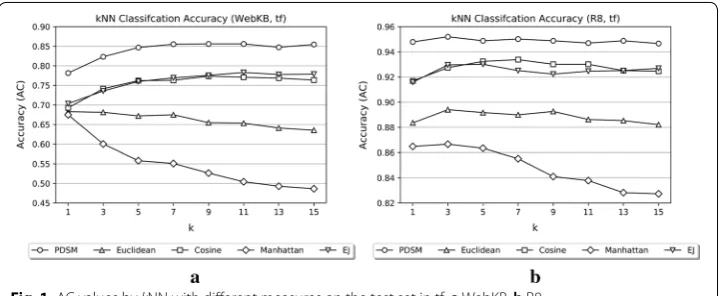
Figure 1 shows the classification accuracies obtained by kNN with different meas-ures using different values of k (k = 1 –15) on the test set of WebKB and R8, respec-tively, in tf weighting scheme. The results show that PDSM outperforms the other measures in all cases. Further, the performance of Cosine is very close to that of EJ in both WebKB and R8.
Tables 7 and 8 show the classification accuracies obtained by kNN with different measures using different values of k (k = 1–15) on the test set of WebKB and R8, respectively, in tf-idf weighting scheme. Again, PDSM performs better than the oth-ers in all cases, regardless of the values of k.
Figure 2 presents the average accuracies obtained by kNN with different measures on the test set of WebKB and R8, respectively, in tf and tf-idf weighting schemes. The results show that PDSM offers the best performance in AC for both document collections. In this experiment, Manhattan distance has the worst performance in all cases.
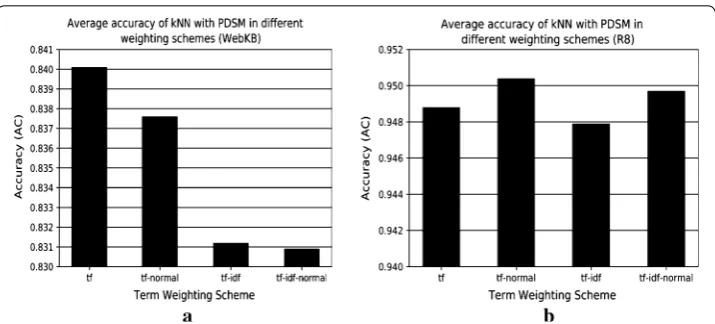
Figure 3 shows the effect of different term weighting schemes and also Cosine nor-malization factor on the average accuracy of kNN with PDSM on the test set of WebKB and R8, respectively. As shown in this figure, tf and tf-normal offer the best performance in WebKB and R8, respectively; however, they are less informative than tf-idf or tf-idf-normal and do not carry any information about the discrimination power of terms.
Clustering results
The results of K-means clustering are presented in this section. In this experiment, we performed K-means on the combination of the test set and the training set and the quality of the clustering was evaluated by AC and En (Eqs. (17) and (18), respectively). Because seed-points are selected randomly, K-means was executed 10 times. Thus, we (21)
Recall= tp
tp+fn
(22) F-measure=2×Precision×Recall
are confident that results are not obtained by chance. We also applied different values of K to K-means. Therefore, the results are not biased by any values of K.
Figure 4 shows the clustering accuracies obtained by K-means with different meas-ures using different K values on WebKB and R8, respectively, in tf weighting scheme. From this figure, Cosine results in a higher AC value and PDSM works well. Figure 5 shows the En values obtained by K-means with different measures on WebKB and R8, respectively, in tf-idf weighting scheme. Similarly, Cosine results in a higher AC value and PDSM works well. For example, for K = 5, Cosine achieves the best performance in AC for WebKB and PDSM is the runner-up.
Table 9 shows the AC values obtained by K-means with different values of K (K = 5–30) on WebKB in tf-normal weighting scheme. As shown in this table, PDSM offers the best performance in AC for WebKB when K is 5 and 10. The overall results show that Manhattan distance achieves the worst performance in AC and En.
Fig. 1 AC values by kNN with different measures on the test set in tf: a WebKB. b R8
Table 7 kNN classification AC (WebKB, tf-idf)
Maximum accuracy is italicized
k = 1 k = 3 k = 5 k = 7 k = 9 k = 11 k = 13 k = 15
PDSM 0.7572 0.8109 0.8367 0.8431 0.8496 0.8517 0.8496 0.8510
Manhattan 0.6089 0.5193 0.4692 0.4520 0.4427 0.4255 0.4191 0.4097
Euclidean 0.6211 0.5681 0.5487 0.5351 0.5165 0.5050 0.4893 0.4799
Cosine 0.6569 0.6913 0.7278 0.5201 0.7307 0.7364 0.7443 0.7500
EJ 0.6576 0.7070 0.7242 0.7414 0.7421 0.7543 0.7672 0.7665
Table 8 kNN classification AC (R8, tf-idf)
Maximum accuracy is italicized
k = 1 k = 3 k = 5 k = 7 k = 9 k = 11 k = 13 k = 15
PDSM 0.9296 0.9434 0.9502 0.9520 0.9511 0.9520 0.9516 0.9529
Manhattan 0.6862 0.6601 0.6341 0.6158 0.6053 0.5980 0.5898 0.5797
Euclidean 0.7159 0.6825 0.6715 0.6583 0.6482 0.6377 0.6277 0.6208
Cosine 0.7926 0.8246 0.8483 0.8483 0.8616 0.8675 0.8748 0.8757
Tables 10, 11, and 12 shows the category distribution in clusters generated by 5-means with PDSM, Euclidean, and Cosine, respectively, on WebKB in tf-normal weighting scheme. Based on these tables, PDSM performs better than the others and is more suc-cessful in putting together documents with the same labels in the same cluster.
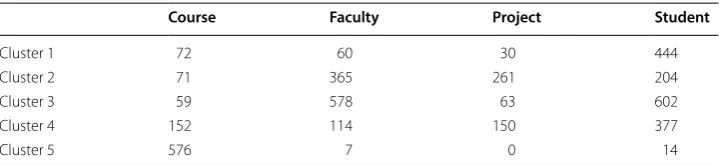
Tables 13 and 14 show the category distribution in clusters produced by 8-means with PDSM and Cosine, respectively, on R8 in tf-idf weighting scheme. From Tables 13 and 14 and Fig. 5b, the overall clustering results show that Cosine achieves the best performance in En for R8, although PDSM is more successful than Cosine in putting together documents with the same label in the same cluster. For instance,
Fig. 2 Average accuracy of kNN on the test set with PDSM: a WebKB, tf. b R8, tf. c WebKB, tf-idf. d R8, tf-idf
PDSM puts together 73.72% of documents with label Earn in the same cluster, which is 36.09% more than Cosine. As another example, PDSM puts together 75.77% of documents with label Money-fx in the same cluster, which is 24.57% more than Cosine.
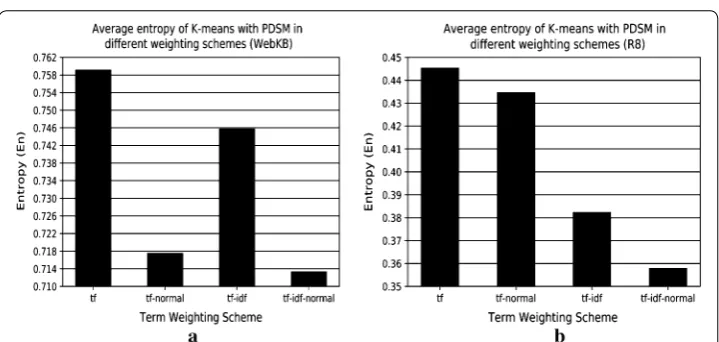
Figure 6 shows the effect of different term weighting schemes and also Cosine nor-malization technique on the En values obtained by K-means with PDSM on WebKB and R8, respectively. tf-idf-normal offers the best entropy for both WebKB and R8.
Near-duplicates detection results
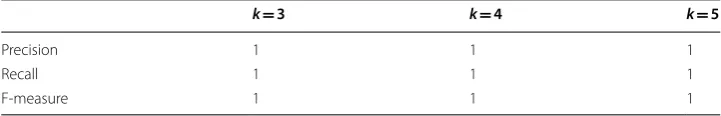
In this section, the results of PDSM performance in detecting near-duplicate docu-ments are given. To evaluate the quality of results, we used precision, recall, and F-measure (Eqs. (20), (21), and (22), respectively). We performed the shingling algo-rithm with PDSM and Jaccard coefficient on WebKB_NDD and R8_NDD. We also considered different values of shingle size to see the effect of k on the performance of similarity measures. Furthermore, the threshold of similarity was 0.5. The number of occurrences of shingle, s, in document, d, was considered as the weighting scheme.
Tables 15 and 16 show precision, recall, and F-measure obtained by the shingling algorithm with PDSM and Jaccard coefficient, respectively, on WebKB_NDD. From
Fig. 4 AC values by K-means with different measures in tf: a WebKB (the combination of test and training sets). b R8 (the combination of test and training sets)
these tables, PDSM offers the best performance in precision, recall, and F-measure. Jaccard coefficient is runner-up; however, it performs as well as PDSM for k = 4 and k = 5.
Tables 17 and 18 show precision, recall, and F-measure obtained by the shingling algo-rithm with PDSM and Jaccard coefficient, respectively, on R8_NDD. As can be seen from these tables, PDSM outperforms Jaccard coefficient, regardless of k values. Jaccard also performs as well as PDSM in terms of recall.
Table 9 K-means clustering AC (WebKB, tf-normal)
Maximum accuracy is italicized
K = 5 K = 10 K = 15 K = 20 K = 25 K = 30
PDSM 0.5941 0.5989 0.5552 0.6060 0.5745 0.5670
Manhattan 0.4172 0.4296 0.3933 0.4025 0.3947 0.3942
Euclidean 0.5704 0.5893 0.6053 0.6090 0.6251 0.6263
Cosine 0.5667 0.5937 0.6047 0.6013 0.6086 0.6103
EJ 0.5463 0.5754 0.5909 0.5915 0.6160 0.6162
Table 10 The category distribution in clusters generated by PDSM (WebKB, tf-normal)
Course Faculty Project Student
Cluster 1 40 36 33 379
Cluster 2 701 5 12 10
Cluster 3 73 20 141 385
Cluster 4 12 14 107 7
Cluster 5 104 1049 211 860
Table 11 The category distribution in clusters generated by euclidean (webkb, tf-normal)
Course Faculty Project Student
Cluster 1 607 21 9 28
Cluster 2 91 57 52 532
Cluster 3 84 238 299 195
Cluster 4 28 360 40 709
Cluster 5 120 448 104 177
Table 12 The category distribution in clusters generated by Cosine (WebKB, tf-normal)
Course Faculty Project Student
Cluster 1 72 60 30 444
Cluster 2 71 365 261 204
Cluster 3 59 578 63 602
Cluster 4 152 114 150 377
Conclusion and future research
We have presented a novel similarity measure between two text documents. For each pairwise comparison between two documents, the term weights and the number of pre-sent terms contribute to the similarity between both related vectors. Moreover, the pro-posed measure satisfies preferable properties for a similarity measure. For example, the
Table 13 The category distribution in clusters generated by PDSM (R8, tf-idf)
Acq Crude Earn Grain Interest Money-fx Ship Trade
Cluster 1 1 0 1 0 0 0 0 1
Cluster 2 1285 150 2892 35 15 69 56 153
Cluster 3 1 0 262 0 0 0 0 0
Cluster 4 28 0 1 0 0 0 0 0
Cluster 5 196 51 82 5 256 222 6 86
Cluster 6 5 8 680 0 0 0 1 0
Cluster 7 29 164 0 11 0 2 79 86
Cluster 8 747 1 5 0 0 0 2 0
Table 14 The category distribution in clusters generated by Cosine similarity (R8, tf-idf)
Acq Crude Earn Grain Interest Money-fx Ship Trade
Cluster 1 71 9 579 6 254 150 4 32
Cluster 2 4 0 812 0 0 0 1 0
Cluster 3 771 340 36 0 0 0 4 0
Cluster 4 2 0 945 0 0 0 0 0
Cluster 5 1 0 1476 0 0 0 0 0
Cluster 6 49 19 2 43 17 141 99 294
Cluster 7 1114 5 66 0 0 2 10 0
Cluster 8 280 1 7 2 0 0 26 0
larger the number of presence-absence terms, the more dissimilar the two documents are. We also added a new property to these preferable properties: the similarity degree should increase when the number of present terms increases. This property is also satis-fied by our proposed measure. To investigate the effectiveness of our proposed meas-ure, we applied it in kNN classification, K-means clustering, and the shingling algorithm for near-duplicates detection on two real-world document collections. We also used the new similarity measure in different term weighting schemes. Our proposed measure yields better results than other popular measures of similarity.
Although the proposed similarity measure is aimed at comparing two text document vectors, it could be easily adapted to any vector type, such as vector representations of terms based on the contexts in which they appear in a collection [39]. Also, the experi-mental results have shown that the performance of the proposed measure could depend on the type of application, the document collection, and the term weighting scheme. It would be a very interesting topic to investigate the performance of our measure in other ML applications that use similarity measures, such as hierarchical agglomerative
Table 15 Performance of PDSM in detecting near-duplicate documents (WebKB_NDD)
k = 3 k = 4 k = 5
Precision 1 1 1
Recall 1 1 1
F-measure 1 1 1
Table 16 Performance of Jaccard coefficient in detecting near-duplicate documents (WebKB_NDD)
k = 3 k = 4 k = 5
Precision 0.9259 1 1
Recall 1 1 1
F-measure 0.9616 1 1
Table 17 Performance of PDSM in detecting near-duplicate documents (R8_NDD)
k = 3 k = 4 k = 5
Precision 1 1 1
Recall 1 1 1
F-measure 1 1 1
Table 18 Performance of Jaccard coefficient in detecting near-duplicate documents (R8_ NDD)
k = 3 k = 4 k = 5
Precision 0.641 0.8065 0.8929
Recall 1 1 1
clustering and recommendation systems. Moreover, our intention is to investigate the usage of our proposed measure on other popular and large-scale document collections, such as the 20 Newsgroups [40], and see its effect on the performance of ML algorithms compared to traditional measures, such as IT-Sim.
Abbreviations
AC: ACcuracy; CMU: Central Michigan University; CPU: Central Processing Unit; EJ: extended Jaccard coefficient; En: entropy; idf: inverse document frequency; IR: information retrieval; IT-Sim: information-theoretic measure for document similarity; kNN: k nearest neighbors; ML: Machine Learning; NDD: near duplicate detection; PDSM: pairwise document similarity measure; R8: Reuters-8; RAM: Random Access Memory; SMTP: similarity measure for text processing; STD: Suffix Tree Document; tf: term frequency; VSM: Vector Space Model; WebKB: World Wide Knowledge Base (Web→KB). Authors’ contributions
MO was the major contributor in conception and design, and also implemented and performed the algorithms. MZ helped for the interpretation of the results of this experiment and was involved in the preparation of the manuscript and also critically revised it. The manuscript was written by MO. Both authors read and approved the final manuscript.
Acknowledgements Not applicable.
Competing interests
The authors declare that they have no competing interests.
Availability of data and materials
The document collections used in classification and clustering experiments are available in the ‘Datasets for single-label text categorization’ repository, http://ana.cacho po.org/datas ets-for-singl e-label -text-categ oriza tion. Furthermore, two document sets used in the near-duplicates detection experiment are available in ‘NDD_DocSets’ repository, https ://githu b.com/marzi ehogh baie/NDD_DocSe ts.
Funding Not applicable.
Publisher’s Note
Springer Nature remains neutral with regard to jurisdictional claims in published maps and institutional affiliations.
Received: 9 October 2018 Accepted: 7 December 2018
References
1. Reyes-Ortiz JL, Oneto L, Anguit D. Big data analytics in the cloud: spark on hadoop vs mpi/openmp on Beowulf. Procedia Comput Sci. 2015;53:121–30.
2. Chen M, Mao S, Liu Y. Big data: a survey. Mobile Netw Appl. 2014;19(2):171–209.
3. Manning CD, Raghavan P, Schütze H. Introduction to information retrieval. Cambridge: CUP; 2008.
4. Chau M, Chen H. Comparison of three vertical search spiders. Comput. 2003;36(5):56–62. https ://doi.org/10.1109/ MC.2003.11982 37.
5. Tang H, Tan S, Cheng X. A survey on sentiment detection of reviews. Expert Syst Appl. 2009;36(7):10760–73. 6. Varol C, Hari S. Detecting near-duplicate text documents with a hybrid approach. J Inf Sci. 2015;41(4):405–14. 7. Xiao C, Wang W, Lin X, Yu JX, Wang G. Efficient similarity joins for near-duplicate detection. ACM Trans Database Syst.
2011;36(3):15.
8. Rezaeian N, Novikova GM. Detecting near-duplicates in russian documents through using fingerprint algorithm Simhash. Procedia Comput Sci. 2017;103:421–5.
9. Hammouda KM, Kamel MS. Efficient phrase-based document indexing for web document clustering. IEEE Trans Knowl Data Eng. 2004;16:1279–96.
10. Chen J, Yeh CH, Chau R. Identifying multi-word terms by text-segments. In: 7th int. conf. on web-age information management workshops, China, Hong Kong, 2006. https ://doi.org/10.1109/waimw .2006.16.
11. D’hondt J, Vertommen J, Verhaegen PA, Cattrysse D, Duflou JR. Pairwise-adaptive dissimilarity measure for docu-ment clustering. Inf Sci. 2010;180(12):2341–58.
12. Robertson S. Understanding inverse document frequency: on theoretical arguments for IDF. J. Doc. 2004;60(5):503–20.
13. Reed JW, et al. TF-ICF: a new term weighting scheme for clustering dynamic data streams. Orlando: ICMLA; 2006. p. 258–63.
14. Luo Q, Chen E, Xiong H. A semantic term weighting scheme for text categorization. Expert Syst Appl. 2011;38(10):12708–16.
16. Sohangir S, Wang D. Improved sqrt-cosine similarity measurement. J Big Data. 2017. https ://doi.org/10.1186/s4053 7-017-0083-6.
17. Lin YS, Jiang JY, Lee SJ. A similarity measure for text classification and clustering. IEEE Trans Knowl Data Eng. 2014;26:1575–90.
18. Heidarian A, Dinneen MJ. A hybrid geometric approach for measuring similarity level among documents and docu-ment clustering. In: IEEE second int. conf. big data computing service and applications (BigDataService), Oxford, 2016, p. 142–151. https ://doi.org/10.1109/bigda taser vice.2016.14.
19. De Amorim RC, Mirkin B. Minkowski metric, feature weighting and anomalous cluster initializing in K-means cluster-ing. Pattern Recognit. 2012;45(3):1061–75.
20. Schoenharl TW, Madey G. Evaluation of measurement techniques for the validation of agent-based simulations against streaming data. Comput Sci. 2008; 45:6–15.
21. Francois D, Wertz V, Verleysen M. The concentration of fractional distances. IEEE Trans Knowl Data Eng. 2007;19:873–86.
22. Aslam JA, Frost M. An information-theoretic measure for document similarity. In: Proc. 26th SIGIR, Toronto. 2003. p. 449–50.
23. Chim H, Deng X. Efficient phrase-based document similarity for clustering. IEEE Trans Knowl Data Eng. 2008;20:1217–29.
24. Strehl A, Ghosh J. Value-based customer grouping from large retail data-sets. In: Proc. SPIE, Orlando, 2000. vol. 4057, p. 33–42.
25. Subhashini R, Kumar VJ. Evaluating the performance of similarity measures used in document clustering and information retrieval. In: 1st int. conf. integrated intelligent computing, Bangalore, 2010, p. 27–31. https ://doi. org/10.1109/iciic .2010.42.
26. Hajishirzi H, Yih W, Kolcz A. Adaptive near-duplicate detection via similarity learning. Geneva: ACM SIGIR’10; 2010. p. 419–26.
27. Han J, Pei J, Kamber M. Data mining: concepts and techniques. 3rd ed. USA: Elsevier; 2011. 28. Lin D. An information-theoretic definition of similarity. San Francisco: ICML; 1998.
29. Lin YS, Liao TY, Lee SJ. Detecting near-duplicate documents using sentence-level features and supervised learning. Expert Syst Appl. 2013;40(5):1467–76.
30. Nagwani NK. A comment on ‘a similarity measure for text classification and clustering. IEEE Trans Knowl Data Eng. 2015;27:2589–90.
31. Fahim AM, Salem AM, Torkey FA, Ramadan MA. An efficient enhanced k-means clustering algorithm. J Zhejiang Univ Sci. 2006;7(10):1626–33.
32. Žalik KR. An efficient k′-means clustering algorithm. Pattern Recognit Lett. 2008;29(9):1385–91.
33. Singhal A, Buckley C, Mitra M. Pivoted document length normalization. In: Proc. ACM SIGIR’96, NY, USA, 1996. p. 21–9.
34. Cachopo AM. Improving methods for single-label text categorization. M.S. thesis, Instituto Superior Técnico, Portu-gal, Lissabon, 2007.
35. Datasets for single-label text categorization. http://ana.cacho po.org/datas ets-for-singl e-label -text-categ oriza tion. Accessed 15 May 2018.
36. Willett P. The Porter stemming algorithm: then and now. Program. 2006;40(3):219–23. 37. Wilbur WJ, Sirotkin K. The automatic identification of stop words. J Inf Sci. 1992;18(1):45–55. 38. NDD_DocSets. https ://githu b.com/marzi ehogh baie/NDD_DocSe ts. Accessed 11 Nov. 2018.
39. Malandrakis N, Potamianos A, Iosif E, Narayanan S. Distributional semantic models for affective text analysis. IEEE Audio Speech Lang Process. 2013;21(11):2379–92. https ://doi.org/10.1109/TASL.2013.22779 31.