R E S E A R C H
Open Access
Association between dietary patterns and
metabolic syndrome in individuals with
normal weight: a cross-sectional study
Edyta Suliga
1*, Dorota Kozie
ł
2, El
ż
bieta Cie
ś
la
3and Stanis
ł
aw G
ł
uszek
2Abstract
Background:The results of several papers have confirmed the existence of correlations between an unhealthy diet and the presence of metabolic syndrome. However, relationships between eating habits and metabolic obesity with normal weight have not yet been sufficiently studied. The aim of the study is to determine which dietary patterns are present in individuals with a normal BMI and to find out whether those patterns were connected with the risk of metabolic syndrome and its features.
Methods:A cross-sectional study was carried out in a group of 2479 subjects with a normal weight (BMI = 18.5– 24.9 kg/m2), aged between 37–66. The study included the evaluation of eating habits, anthropometric measurements, blood pressure tests and the analysis of the collected fasting-blood samples, on the basis of which cholesterol, triglycerides and glucose levels were determined. Dietary patterns were determined by means of factor analysis. Results:In the group of individuals with a normal BMI, four dietary patterns were distinguished:“healthy”,“fat, meat and alcohol”,“prudent”and“coca cola, hard cheese and French fries”. After controlling for potential confounders, subjects in the highest tertile of prudent dietary pattern scores had a lower odds ratio for the metabolic obesity normal weight) (odds ratio: 0.69; 95 % CI: 0.53-0.89;p< 0.01) and low HDL cholesterol (odds ratio: 0.77; 95 % CI: 0.59-0.99;p< 0.05), in comparison to those from the lowest tertile, whereas the individuals in the second tertile had a higher odds ratio for the increased blood glucose concentration than those in the lowest tertile (odds ratio: 0.74; 95 % CI: 0.57-0.96;p< 0.05).
Conclusion:A dietary pattern characterized by a high consumption of fish and whole grains, and a low consumption of refined grains, sugar, sweets and cold cured meat, is connected with lower risk of metabolic obesity normal weight as well as with the lower risk of low HDL cholesterol concentration and increased glucose concentration.
Keywords:Dietary patterns, Metabolic syndrome, Body mass index
Introduction
Metabolic syndrome most often co-occurs with obesity, however, in some individuals with normal body weight, the presence of metabolic disorders can be diagnosed similar to those which are characteristic for obese people. These persons were named metabolically obese normal weight (MONW) [1]. Metabolic obesity normal weight is diagnosed in 14.7 % - 59 % adults in different populations [2–4]. Significant differences concerning the
frequency of the occurrence of this problem result from the diversified age and ethnic origin of the subjects, as well as from the varied diagnosing criteria [3, 4].
The results of several studies have confirmed the de-pendencies between an unhealthy diet and the occur-rence of the metabolic syndrome features, whereas
“healthy” dietary patterns decreased this risk [5–8]. In the etiology of metabolic syndrome with normal weight, the significance of an improperly balanced diet is under-lined [3, 9, 10]. The analyses used in the food epidemi-ology of the relationships between particular nutrients with the presence of the metabolic syndrome features, often indicated the lack of such correlations. It is difficult
* Correspondence:edyta.suliga@ujk.edu.pl
1The Department for the Prevention of Alimentary Tract Diseases, The Institute of Nursing and Midwifery, Faculty of Health Sciences, Jan Kochanowski University, ul. IX Wieków Kielc 19, 25-317 Kielce, Poland Full list of author information is available at the end of the article
to detect an effect caused by single nutrients. Thus, the analysis of the dietary patterns seems to be useful in the assessment of the dependencies between eating habits and the occurrence of chronic diseases. They reflect eating habits of individuals in populations more comprehen-sively, because what people eat is not nutrients, but prod-ucts and meals consisting of diversified food, which represent the total effect of individual nutrients and the interactions between them. They are also more useful in working on dietary recommendations.
The dietary patterns are most often determined by means of factor or cluster analysis, and in the case of these two methods, they are connected with the risk of the presence of chronic diseases. However, Newby et al. showed that a person’s dietary patterns would be best represented by using factor analysis [11]. The studies also confirmed reproducibility and validity of the dietary patterns determined by factor analysis in various popula-tions [12, 13]. The aim of the study is to determine which dietary patterns occur in individuals with a nor-mal BMI and to check if these patterns are connected with the risk of the presence of metabolic syndrome and its features.
Material and methods
The research material was collected in the framework of the PONS project (Polish-Norwegian Study) [4, 14]. The study was approved by the Ethics Committee within the Cancer Centre and Institute of Oncology in Warsaw, Poland. The study was carried out from September 2010 to October 2012. It was an open-ended study. All men and women aged between 45–64, permanently residing in the Kielecki region in Poland, were invited to take part in the study. Voluntary participation rate in this age group was 12 %. A small number of older people volun-teered to take part in the study (65–66 years), and youn-ger (37–44), in comparison with the previously intended age group. They comprised 0.66 % of all participants and were included in the analysis. Altogether 13172 people were subjected to the study (4447 men and 8725 women)
aged 37–66. In 65 subjects (0.49 %), due to the lack of in-formation concerning their height or body mass, it was not possible to calculate a BMI, 73.69 % were obese and overweight people, 0.44 % were underweight. 3342 partici-pants with a normal BMI were qualified for further ana-lysis (18.5 –24.9 kg/m2). Following this, the participants with a history of cardiovascular system disease, strokes, diabetes or cancer were excluded from the analysis–due to possible changes in their diet resulting from disease (N= 193). The participants lacking data concerning the consumption of particular products were also excluded (N= 670). The dietary patterns were established on the basis of factor analysis carried out in the remaining 2479 individuals. Participants with a normal BMI, in comparison with all subjects, were significantly more frequently women, younger people, living in cities, having higher education, more physically active and smoking (Table 1). The dif-ferences are in accordance with the results of studies stating that overweight and obesity are less common in socio-economically privileged groups, especially in women [15, 16]. The participants with a normal BMI, not having complete data, were not significantly different than those included in the analysis from the point of view of sex and place of residence, however, they were older, less physically active, they had higher education less frequently, and were smokers more often. The studies included a questionnaire interview, anthropometric measurements, blood pressure measurements and analyses of collected fasting-blood samples on the basis of which the concentration of choles-terol, triglycerides and glucose was determined.
Anthropometric measurements
The measurements of body weight were done by means of an electronic weight Tanita SC 240 MA, with an ac-curacy of 0.1 kg. Body height measurements were done by means of the weight’s stadiometer, with an accuracy of 0.1 cm. The waist circumference was measured half-way between the lower rib edge and the upper iliac crest by means of a metric measure with an accuracy of 0.1 cm.
Table 1The characteristics of the study participants (%, 95 % CI) The study participants Socio-demographic variables and life style
Women Age 52–66 years Rural environm. University education Smokers Physical activity*
Total population N = 13172 66.2 75.2 38.2 29.5 20.0 17.3 ± 11.1
65.4-67.0 74.3-79.9 37.4-39.0 28.7-30.3 19.3-20.7 17.1-17.5
Normal BMI–missing data N = 670 77.0a 74.2a 33.6a 29.7a 30.4a 17.0 ± 10.7a
74.1-79.8 71.2-77.1 27.5-33.8 26.6-32.8 27.3-33.5 10.2-11.2
The subject group N = 2479 76.2 65.8b 32.1 37.9b 28.2b 17.8 ± 11.0b
74.8-77.7 64.2-67.4 30.6-33.8 36.3-39.6 26.7-29.8 17.5-18.2
*X ± SD (MET h/week);a
statistically significant difference between the subject group and a total populationp< 0.05;b
Assessment of blood pressure and biomarkers
Blood pressure was measured with the use of the blood pressure monitor Omron, model M3 Intellisense. The test was carried out on the artery of the right upper limb, when seated. In the study, the average of the two measurements was analysed. The glucose concentration in the blood serum was determined by means of the enzyme method with hexokinase, the concentration of tri-glycerides – by means of the phosphogliceride oxidase-peroxidase method. The concentration of total cholesterol was determined by means of the enzyme method with es-terase and cholesterol oxidase, and HDL cholesterol with the use of the colorimetric non-precipitation method.
Assessment of other variables
The confounders included the variables which affect both the dietary patterns as well as the features of meta-bolic syndrome such as age, level of education, place of residence, smoking cigarettes and physical activity. Two 15-year age brackets were distinguished: 37–51 and 52– 66, four education categories: primary, vocational, sec-ondary and university as well as two categories for the place of residence: urban and rural. The physical activity was evaluated with the use of the International Physical Activity Questionnaire (IPAQ). Total physical activity was calculated expressed as metabolic equivalent hours per week (MET-h/wk). The respondents who smoked cigarettes on a daily basis during the study were classi-fied as current smokers, and those who had not smoked for longer than 6 months –as former smokers, and the rest was regarded as nonsmokers.
Food consumption analysis
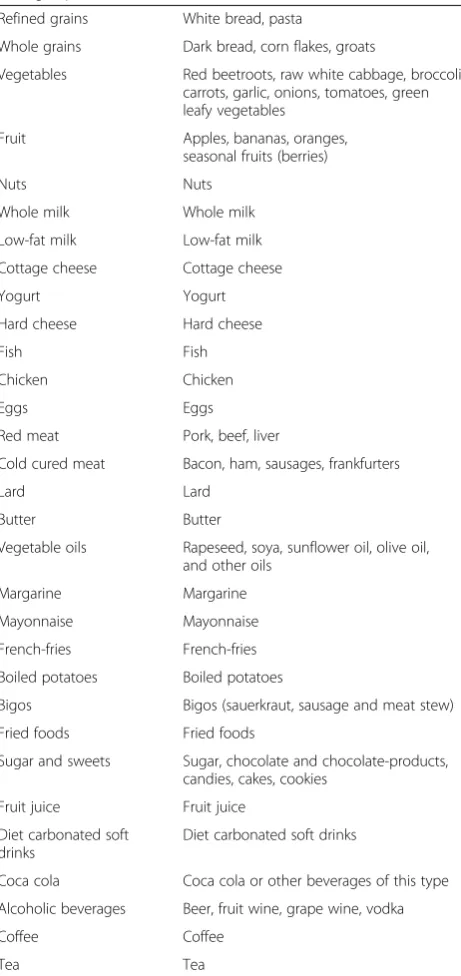
The data concerning food consumption were collected by means of the Food Frequency Questionnaire (FFQ). FFQ consisted of a list of products of standard size por-tions. The participants of the study were asked about the frequency of consumption of certain portions of each product during the last year. The frequencies of con-sumption were classified as follows: less frequently than once a month or not at all, 1–3 times a month, once a week, 2–4 times a week, 5–6 times a week, once a day, 2–3 times a day, 4–5 times a day, 6 times a day or more, I don’t know, I refuse to answer the question. In order to achieve the dietary patterns, food items and beverages from the questionnaire were combined in 31 food groups. The method of aggregating the products is shown in Table 2. The basis for placing a given product in a group was a similarity of nutritional value. Some food items were analysed separately because the profile of their ingredients was unique (e.g. eggs, margarine) or their consumption could reflect a distinct dietary pattern (e.g. bigos–a traditional Polish dish made of sauerkraut, sausages and meat). PONS FFQ was constructed based
on a previously developed and validated FFQ for the Poland branch of the PURE study and was characterized by good validity and reproducibility in relation to the referential method [17].
Definition of MONW
The occurrence of metabolic syndrome was defined based on the recommendations of the International Dia-betes Federation Task Force on Epidemiology and Pre-vention (joint interim statement in 2009) [18]. Metabolic
Table 2Food grouping used in the dietary pattern analyses Food groups Food items
Refined grains White bread, pasta
Whole grains Dark bread, corn flakes, groats
Vegetables Red beetroots, raw white cabbage, broccoli, carrots, garlic, onions, tomatoes, green leafy vegetables
Fruit Apples, bananas, oranges, seasonal fruits (berries)
Nuts Nuts
Whole milk Whole milk
Low-fat milk Low-fat milk
Cottage cheese Cottage cheese
Yogurt Yogurt
Hard cheese Hard cheese
Fish Fish
Chicken Chicken
Eggs Eggs
Red meat Pork, beef, liver
Cold cured meat Bacon, ham, sausages, frankfurters
Lard Lard
Butter Butter
Vegetable oils Rapeseed, soya, sunflower oil, olive oil, and other oils
Margarine Margarine
Mayonnaise Mayonnaise
French-fries French-fries
Boiled potatoes Boiled potatoes
Bigos Bigos (sauerkraut, sausage and meat stew)
Fried foods Fried foods
Sugar and sweets Sugar, chocolate and chocolate-products, candies, cakes, cookies
Fruit juice Fruit juice
Diet carbonated soft drinks
Diet carbonated soft drinks
Coca cola Coca cola or other beverages of this type
Alcoholic beverages Beer, fruit wine, grape wine, vodka
Coffee Coffee
obesity with normal weight (MONW) was defined as the presence of at least three of the 5 features of metabolic syndrome and a normal body weight (BMI = 18.5-24.9 kg/m2).
Statistical analysis
The dietary patterns were distinguished with the use of factor analysis by principal component analysis. The an-swers concerning the frequency of consumption of par-ticular items from the questionnaire were calculated into daily doses of consumption and then standardized by z-score. Barlett’s test of sphericity was conducted (p< 0.0000), KMO coefficient was calculated (Kaiser-Meyer-Olkin) (>0.7) and for each variable, MSA (measure sam-pling adequacy) was counted. The applied procedure allowed us to eliminate the products which did not show any connection with other products or were weakly corre-lated with them. From further analysis the following prod-ucts were excluded: whole milk, butter, chicken, nuts, dietetic sparkling drink, coffee and tea. The analysis of the principal components with varimax rotation allowed us to minimize the number of variables which had high loads on each factor. The first factor extracted is the one that accounts for the maximum possible variance in the data-set. The second component, independent of the first, will be the one that explains the largest possible share of the remaining variance and so on, without the components being correlated with each other. The number of factors was determined in accordance with the Kaiser criterium (>1). Only these factors were included which were respon-sible for variances not smaller in number than the original variables. Additionally, the number of the accepted factors was included by the scree plot test. Each factor consisted of subsets of food items subject to analysis, whose abso-lute factor loading was greater than or equal 0.3. The fac-tor analysis carried out led to distinguishing 4 facfac-tors. The contribution of specific factors to the explanation of total variance was as follows: the first factor explained: 12.74 %, the second factor: 9.69 %, the third factor 5.50 %, the fourth factor: 5.02 %. The selected factors altogether allowed for 32.95 % of the total variance. On the basis of own scores of the consumption of a given product or groups of products and standardized weights from the fac-tor analysis for every subject facfac-tor, values were calculated for each dietary pattern. In the range of each pattern the division of subjects into tertile groups was carried out and the characteristic of the subjects in tertile groups was made, in the range of dietary patterns. In reference to the socio-demographic factors (age, sex, place of residence, level of education), smoking, and also for the features of metabolic syndrome, in particular dietary patterns the structure indicator was tested with the use of non-parametric chi-square test. To evaluate physical activity one factor variance analysis ANOVA and post-hoc
Bonferroni test were used. In order to assess the risk (OR) of the MONW occurrence as well as improper values of 5 features of metabolic syndrome in the distinguished diet-ary patterns logistic regression was applied. The values of the first, lowest tertile (T1) were accepted as a reference level for each dietary pattern. In the first model crude data were considered, whereas in the second model the risk of the occurrence of improper values of MONW features was adjusted to the age (37–51, 52–66), sex (women, men), place of residence (city, country), education (higher, secondary and lower), smoking (never, past, or current) and total physical activity (MET-h/wk). All p-values pre-sented are 2-tailed;p< 0.05 was considered significant. In order to compare the selected research sample with the entire population as well as people with incomplete data, in reference to quality variables test chi-square was used, whereas for physical activity T-Student test was applied. The statistical analysis was carried out with the use of Sta-tistica program, version 10.0.
Results
The factor analysis allowed us to distinguish four dietary patterns in the group of participants with a normal BMI: pattern I – healthy, most strongly correlated with the consumption of fruit and vegetables, low-fat milk and dietary products, as well as whole grains food, pattern II -fat, meat and alcohol– correlated with the consumption of lard, red meat, cold cured meat, eggs, fried dishes, vege-table oils, mayonnaise and alcoholic drinks, pattern III – prudent–additionally correlated with the consumption of fish and whole grains products, whereas negatively corre-lated with the consumption of refined grains food, sugar and sweets, cold cured meats and boiled potatoes and pat-tern IV–coca cola, hard cheese and French fries– posi-tively correlated with the consumption of these three products. The factor-loading matrixes for these dietary patterns are shown in Table 3.
cities and of higher total physical activity. In case of the pattern of coca cola, hard cheese and French fries, the subjects in T2 and T3 were younger, more physically ac-tive and more frequently resided in the country com-pared to those in T1. Moreover, the participants in T3 of this pattern were more often smokers.
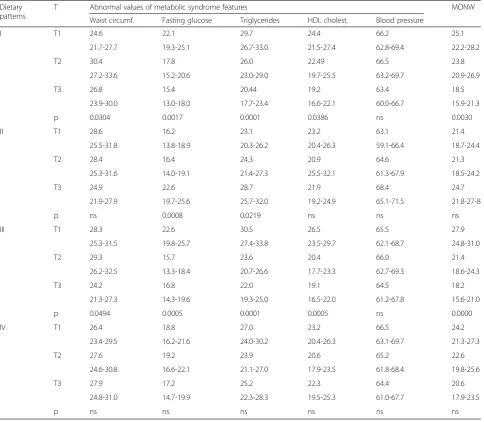
The subjects in T2 and T3 of the health and prudent patterns, compared to those in T1, had increased glu-cose and triglycerides concentrations and less frequently a low concentration of HDL cholesterol (Table 5). Only the percentage of individuals with abdominal obesity, in the case of these two patterns, was higher in T2 than in T1 and T3. The analysis of the waist circumference, con-sidered as a continuous variable, showed however, that the higher the score of the healthy and prudent patterns, the lower was the average waist circumference of the subjects (Table 6). The individuals in T3 of the pattern fat, meat, alcohol were characterized by a higher glucose and triglycerides concentration, compared with those from T2 and T1 (Table 5). They were also characterized by higher average waist circumferences (Table 6), despite
the fact that no significant differences were found con-cerning the occurrence of abdominal obesity. In the pat-tern“coca cola, hard cheese and French fries”there were no significant differences in the occurrence of the meta-bolic syndrome features through tertiles. MONW oc-curred less frequently in individuals in T3 of the healthy and prudent patterns, compared to those in T2 and T1. No significant differences were observed between the frequency of MONW in the subjects from other tertiles of the pattern “fat, meat and alcohol” as well as the pat-tern“coca cola, hard cheese and French fries”.
In the model based on the crude data analysis, the risk of MONW, as well its three features, i.e. an increased glucose and triglycerides concentration and low concen-tration of HDL cholesterol, was significantly lower in the participants in T2 and T3 of the healthy and prudent patterns, compared to those from T1 (Table 7). A greater risk of the increased glucose and triglycerides concentra-tion was present in individuals in T3, in comparison with the subjects in T1 of the fat, meat, alcohol pattern. The score of the coca cola, chard cheese and French fries pat-tern, was not significantly correlated with the risk of MONW and its features. In the model adjusted to sex, age, place of residence, education, overall physical activity and smoking, only the score of the prudent pattern was significantly correlated with the development of MONW and some of its features, i.e. a low concentration of HDL cholesterol and increased glucose concentration (Table 8). A higher MONW risk and low concentration of HDL cholesterol were found in participants from T3 in this pat-tern, compared to those from T1, whereas in the subjects from T2, the risk of an increased glucose concentration was significantly higher than in the participants in T1. It was also discovered that in participants in T2 of the healthy pattern, the risk of abdominal obesity was signifi-cantly higher than in those from T1.
Discussion
In the group of participants having a normal BMI, 4 dietary patterns were identified:“healthy”,“fat, meat and alcohol”, “prudent” and “coca cola, hard cheese and French fries”. Significant correlations were found be-tween the score of the dietary pattern and demographic and social variables, as well as a lifestyle. The subjects with a high score of the healthy and prudent pattern more often included women, nonsmokers, people with a university level of education, living in cities, and in case of the healthy pattern –also more physically active. The research results by other authors also confirm the exist-ence of similar correlations. Fonseca et al. stated that the
“healthy”dietary pattern was more frequent in the oldest women age group, in the pattern“red meat and alcohol” women with the lowest level of education were the most numerous, and in men – the biggest number of the
Table 3Factor-loading matrix for major dietary patterns* Food groups Factor I Factor II Factor III Factor IV
Alcoholic beverages - 0.302 -
-Low-fat milk 0.363 - -
-Cottage cheese 0.538 - -
-Yogurt 0.449 - -
-Hard cheese - - - 0.499
Fish - - 0.343
-Eggs - 0.593 -
-Red meat - 0.452 -
-Cold cured meat - 0.333 −0.416
-Lard - 0.441 -
-Fried foods - 0.491 -
-Vegetable oils - 0.384 -
-Mayonnaise - 0.395 -
-French-fries - - - 0.502
Coca cola - - - 0.579
Fruit juice - - -
-Fruit 0.662 - -
-Vegetables 0.626 - -
-Boiled potatoes - - −0.624
-Whole grains 0.329 - 0.583
-Refined grains - - −0.702
-Sugar and sweets - - −0.551
-Percentage of variance explained (%)
12.742 9.693 5.497 5.029
youngest groups representatives [19]. Desmukh-Taskar et al. found that women consumed more portions from the“prudent” dietary pattern than men, and the individ-uals with a higher SES and a higher level of education, consumed more of them than subjects with a lower level of education and a lower social status [20]. The correl-ation between a higher educcorrel-ation and higher SES, and the “prudent” dietary pattern results from more exten-sive knowledge, as well as health awareness, and also from the fact that being a member of a higher social group obliges to the dietary habits acknowledged and ac-cepted by this group [20, 21]. Among people of lower SES, the important factors influencing the choice of food
items include also a higher cost of healthy food or a poor access to health food [21, 22]. The results of the re-search carried out confirmed the tendency noticed by several authors of the coexistence of healthy eating habits with other health promoting elements of a life-style in individual people. Desmukh-Taskar et al. found out that current smokers consumed more portions of the “Western” dietary pattern, and non-smokers–more portions from the “prudent” pattern; the individuals of the highest physical activity consumed fewer portions from the“Western”dietary pattern than those less active [20]. Fonseca et al. discovered that the “healthy” dietary pattern both in men and women was connected with the
Table 4The characteristic of the study participants in the tertile categories of the dietary patterns in respect of demographic, social aspect and lifestyle (%, 95 % CI)
DP T Demographic and social variables and lifestyle
Women Age 52–66 years Rural environm. University education Smokers Physical activity*
I T1 64.0 61.7 35.4 34.1 34.9 15.6 ± 10.4
60.6-67.2 58.3-65.0 32.1-38.8 30.8-37.4 31.7-38.3 14.9-16.3
T2 78.0 63.2 32.9 41.6 25.3 18.1 ± 10.6
75.0-80.8 59.9-66.5 29.7-36.2 38.2-45.0 22.3-28.4 17.4-18.8
T3 85.97 63.0 26.6 45.9 22.0 20.5 ± 11.5
83.4-88.3 59.6-66.3 23.6-29.8 42.5-49.4 19.3-25.0 19.7-21.3
p 0.0000 ns 0.0004 0.0000 0.0003 0.0000
II T1 84.3 65.0 33.4 38.7 23.9 17.2 ± 10.5
81.6-86.7 61.7-68.3 30.2-36.8 35.4-42.2 21.0-26.9 16.5-17.9
T2 78.7 62.0 33.41 40.8 27.2 18.2 ± 10.6
75.7-81.4 58.6-65.3 30.2-36.8 37.4-44.2 24.2-30.4 17.4-18.9
T3 65.1 60.9 28.1 42.1 31.1 18.9 ± 11.9
61.7-68.3 57.5-64.3 25.0-31.3 38.7-45.5 27.9-34.4 18.1-19.7
p 0.0000 ns 0.0256 ns 0.0001 0.0063
III T1 67.1 61.0 44.3 25.9 38.1 18.0 ± 11.1
63.8-70.3 57.6-64.4 40.9-47.8 23.0-29.0 34.8-41.6 17.3-18.8
T2 78.1 63.6 30.7 40.4 25.5 17.9 ± 10.9
75.1-80.9 60.2-66.9 27.6-34.0 37.0-43.8 22.6-28.6 17.2-18.7
T3 82.81 63.3 19.9 55.3 18.6 18.3 ± 11.1
80.1-85.3 59.9-66.6 17.2-22.7 51.9-58.8 16.0-21.4 17.5-19.0
p 0.0000 ns 0.0000 0.0000 0.0000 ns
IV T1 78.2 68.6 28.7 39.5 27.4 17.1 ± 10.6
75.2-81.0 65.4-71.8 25.6-31.9 36.1-42.9 24.4-30.5 16.4-17.9
T2 75.9 65.8 30.5 41.5 25.2 18.2 ± 10.8
72.9-78.8 62.4-69.0 27.4-33.7 38.1-44.9 22.2-28.3 17.4-18.9
T3 73.9 53.5 35.7 40.7 29.7 18.9 ± 11.6
70.7-76.8 50.0-57.0 32.4-39.1 37.3-44.1 26.6-32.9 18.1-19.7
p ns 0.0000 0.0061 ns ns 0.0046
lowest number of current smokers and people who drink alcohol, and also with the highest proportion of those who are physically active [19]. In the pattern “red meat and alcohol” there was a lowest percentage of physically active individuals, and among men–there was the high-est number of current smokers.
The research conducted in recent years has shown that the genes expression profiles are different depend-ing on dietary patterns, which may be a factor modulat-ing the risk of chronic diseases development [23]. A vegetarian dietary pattern was connected with a more advantageous metabolic profile [24]. The risk of meta-bolic syndrome development was also lower in case of a greater consumption of dairy products [25]. However,
Table 5The characteristic of the study participants in the tertile categories of the dietary patterns in respect to the metabolic syndrome features occurrence (% and 95 % CI)
Dietary patterns
T Abnormal values of metabolic syndrome features MONW
Waist circumf. Fasting glucose Triglycerides HDL cholest. Blood pressure
I T1 24.6 22.1 29.7 24.4 66.2 25.1
21.7-27.7 19.3-25.1 26.7-33.0 21.5-27.4 62.8-69.4 22.2-28.2
T2 30.4 17.8 26.0 22.49 66.5 23.8
27.2-33.6 15.2-20.6 23.0-29.0 19.7-25.5 63.2-69.7 20.9-26.9
T3 26.8 15.4 20.44 19.2 63.4 18.5
23.9-30.0 13.0-18.0 17.7-23.4 16.6-22.1 60.0-66.7 15.9-21.3
p 0.0304 0.0017 0.0001 0.0386 ns 0.0030
II T1 28.6 16.2 23.1 23.2 63.1 21.4
25.5-31.8 13.8-18.9 20.3-26.2 20.4-26.3 59.1-66.4 18.7-24.4
T2 28.4 16.4 24.3 20.9 64.6 21.3
25.3-31.6 14.0-19.1 21.4-27.3 25.5-32.1 61.3-67.9 18.5-24.2
T3 24.9 22.6 28.7 21.9 68.4 24.7
21.9-27.9 19.7-25.6 25.7-32.0 19.2-24.9 65.1-71.5 21.8-27-8
p ns 0.0008 0.0219 ns ns ns
III T1 28.3 22.6 30.5 26.5 65.5 27.9
25.3-31.5 19.8-25.7 27.4-33.8 23.5-29.7 62.1-68.7 24.8-31.0
T2 29.3 15.7 23.6 20.4 66.0 21.4
26.2-32.5 13.3-18.4 20.7-26.6 17.7-23.3 62.7-69.3 18.6-24.3
T3 24.2 16.8 22.0 19.1 64.5 18.2
21.3-27.3 14.3-19.6 19.3-25.0 16.5-22.0 61.2-67.8 15.6-21.0
p 0.0494 0.0005 0.0001 0.0005 ns 0.0000
IV T1 26.4 18.8 27.0 23.2 66.5 24.2
23.4-29.5 16.2-21.6 24.0-30.2 20.4-26.3 63.1-69.7 21.3-27.3
T2 27.6 19.2 23.9 20.6 65.2 22.6
24.6-30.8 16.6-22.1 21.1-27.0 17.9-23.5 61.8-68.4 19.8-25.6
T3 27.9 17.2 25.2 22.3 64.4 20.6
24.8-31.0 14.7-19.9 22.3-28.3 19.5-25.3 61.0-67.7 17.9-23.5
p ns ns ns ns ns ns
Ttertile,nsnon significant
Table 6Waist circumferences in tertile categories of the dietary patterns (X ± SD; 95 % CI)
Tertile Dietary patterns
Healthy Fat, meat and alcohol
Prudent Coca cola, hard cheese and French-fries
T1 80.9 ± 7.7 78.5 ± 7.2 80.5 ± 7.6 79.0 ± 7.6
80.3-81.4 78.0-79.0 80.0-81.0 78.5-79.5
T2 79.4 ± 7.6 79.2 ± 7.4 79.4 ± 7.9 79.1 ± 7.6
78.9-79.9 78.7-79.9 78.8-79.9 78.6-79.6
T3 77.5 ± 7.0 80.0 ± 7.9 77.9 ± 6.9 79.6 ± 7.2
77.0-78.0 79.5-80.6 77.4-78.3 79.1-80.1
the meat dietary pattern was strongly correlated with the occurrence of the syndrome [26]. Philips et al. concluded that individuals with MONW, in comparison with healthy people, were characterized by a lower consump-tion of vegetables, fruit and dairy products and a worse diet quality defined by the DASH (Dietary Approaches to Stop Hypertension score) [3]. A significant role of a lower level of dietary restraint in individuals with MONW was indicated [27]. The conducted study re-vealed that a lower risk of metabolic syndrome and its features, such as an increased glucose and triglycerides concentration and a low concentration of HDL choles-terol characterized the participants with a high score in the patterns “healthy” and “prudent”, whereas a higher risk of an increased glucose and triglycerides concentra-tion was connected with the highest score in the pattern
“fat, meat, alcohol”. After introducing control over con-founding factors, a significantly lower risk of the MONW development and its features was found only in the participants with a high score in the “prudent” pat-tern, positively correlated with the fish and full grains food consumption. This pattern was also characterized by limiting the consumption of products that may be re-lated to a disadvantageous metabolic profile, such as
refined flower products, sugar, sweets and cold cured meat. The achieved results are in accordance with the results obtained by other authors who concluded that lowering the risk of metabolic syndrome and its features may be connected with the consumption of fish [28, 29]. Fish contribute to the improvement of the metabolic profile mainly due to a high content of polyunsaturated fatty acids n-3 [30]. Esmaillzadeh et al. showed that the consumption of full grain products was negatively, and the consumption of refined grain products positively correlated with the risk of the metabolic syndrome de-velopment [31]. Whole grains products contribute to the improvement of the metabolic profile due to the content of such components as: dietary fiber, inulin, beta-glucan, resistant starch, phenolics, tocotrienols, tocopherols, and carotenoids [32]. Hyun et al. having analysed eating habits of women with MONW, confirmed that they con-sumed more animal fats, and less full grain products and vegetables compared to the control group [9]. The risk of MONW was also increased by the consumption of carbohydrates, especially in the form of snacks [10]. After introducing control over the confounding vari-ables, the other dietary patterns were no longer signifi-cantly correlated with the risk of MONW. The lack of
Table 7Risk (OR) of MONW and its features development in tertile categories of the dietary patterns (Model I–crude data) (OR; 95 % CI) Abnormal values of metabolic syndrome features
Dietary patterns T Waist circumf. Fasting glucose Triglycerides HDL cholest. Blood pressure MONW
I T1 1.0 1.0 1.0 1.0 1.0 1.0
Healthy T2 1.13** 0.76* 0.83 0.90 0.99 0.93
0.93-1.39 0.60-0.98 0.66-1.03 0.72-1.13 0.81-1.21 0.74-1.16
T3 0.89 0.64** 0.61*** 0.73* 1.13 0.68**
0.71-1.11 0.50-0.82 0.48-0.76 0.58-0.94 0.93-1.39 0.53-0.86
II T1 1.0 1.0 1.0 1.0 1.0 1.0
Fat, meat and alcohol T2 1.01 1.01 1.06 0.86 0.94 0.98
0.81-1.25 0.78-1.31 0.85-1.33 0.68-1.08 0.77-1.15 0.77-1.24
T3 1,21 1.50** 1.34** 0.94 0.79 1.22
0.97-1.51 1.18-1.93 1.08-1.68 0.74-1.18 0.64-0.97 0.97-1.53
III T1 1.0 1.0 1.0 1.0 1.0 1.0
Prudent T2 0.95 0.64*** 0.70** 0.71** 0.98 0.71**
0.77-1.18 0.50-0.82 0.56-0.87 0.57-0.89 0.80-1.20 0.56-0.88
T3 1.24 0.69** 0.64*** 0.65*** 1.04 0.57***
0.99-1.54 0.54-0.88 0.52-0.80 0.52-0.83 0.85-1.28 0.45-0.73
IV T1 1.0 1.0 1.0 1.0 1.0 1.0
Coca cola, hard cheese, French-fries T2 0.94 1.03 0.85 0.85 1.06 0.91
0.76-1.17 0.81-1.32 0.68-1.06 0.68-1.08 0.86-1.30 0.73-1.15
T3 0.93 0.90 0.91 0.95 1.09 0.81
0.75-1.15 0.70-1.16 0.73-1.13 0.71-1.19 0.89-1.34 0.64-1.02
Ttertile
such correlations was also noted down in the papers of other authors [19, 33]. It may result from the fact that the other groups of subjects were not concentrated in the way that their lifestyle, eating habits and socio-demographic features were significantly connected with the risk of the metabolic syndrome development.
Study limitations
The main limitation of this paper is that the study was conducted “a posteriori”, therefore any changes of the dietary pattern which could take place in case of the subjects, can confound the possibility of a precise ex-planation of the causal link between the nutrition and the occurrence of MONW. Moreover, a lower number of men who volunteered to participate in the study, may cause that their dietary patterns were not fully represen-tative for the whole population.
Conclusions
The dietary pattern characterized by a high consumption of fish as well as food with whole grains and a low con-sumption of refined products, sugar and sweets as well as cold cured meat, is connected with a lower risk of the
metabolic obesity normal weight syndrome and with a decreased risk of lower HDL cholesterol concentration and increased glucose concentration. The results achieved by us are in conformity with the recommendations related to the diet-dependent diseases prophylactics, advising to increase the fish consumption, replace refined grains with whole grains and limit the consumption of sugar and sweets.
Abbreviations
BMI:Body mass index; MONW: Metabolic obesity and normal weight; PONS: POlish- Norwegian study; IPAQ: International physical activity questionnaire; MET: Metabolic equivalent of task; FFQ: Food frequency questionnaire; KMO: Kaiser-Meyer-Olkin; MSA: Measure of sampling adequacy; OR: Odds ratio; T: Tertile; DASH: Dietary approaches to stop hypertension.
Competing interests
The authors declare that they have no competing interests.
Authors’contributions
ES designed the study, participated in the statistical analysis and reviewed the manuscript. DK participated in the study design and helped to draft the manuscript. EC participated in the statistical analysis and reviewed the manuscript. SG have been involved in drafting the manuscript and revising it critically for important intellectual content. All authors read and approved the final manuscript.
Table 8Risk (OR) of MONW and its features development in tertile categories of the dietary patterns (Model II–adjusted for potential confounders) (OR; 95 % CI)
Abnormal values of metabolic syndrome features
Dietary patterns T Waist circumf. Fasting glucose Triglycerides HDL cholest. Blood pressure MONW
I T1 1.0 1.0 1.0 1.0 1.0 1.0
Healthy T2 0.81* 0.91 0.99 1.03 0.86 1.11
0.67-0.99 0.71-1.18 0.80-1.23 0.81-1.31 0.70-1.07 0.88-1.40
T3 1.00 0.84 0.79 0.90 0.92 0.87
0.90-1.10 0.64-1.10 0.62-1.01 0.70-1.15 0.74-1.15 0.68-1.13
II T1 1.0 1.0 1.0 1.0 1.0 1.0
Fat, meat and alcohol T2 0.92 0.95 1.02 0.82 0.98 0.94
0.74-1.15 0.73-1.24 0.80-1.29 0.65-1.04 0.79-1.20 0.74-1.20
T3 0.93 1.25 1.13 0.79 0.93 1.04
0.74-1.17 0.96-1.62 0.90-1.44 0.62-1.01 0.75-1.15 0.82-1.33
III T1 1.0 1.0 1.0 1.0 1.0 1.0
Prudent T2 0.98 0.74* 0.81 0.79 0.89 0.79
0.78-1.22 0.57-0.96 0.64-1.02 0.62-1,00 0.71-1.10 0.62-1.00
T3 1.22 0.88 0.80 0.77* 0.92 0.69**
0.96-1.55 0.67-1.16 0.63-1.02 0.59-0.99 0.73-1.15 0.53-0.89
IV T1 1.0 1.0 1.0 1.0 1.0 1.0
Coca cola, hard cheese, French-fries T2 0.90 1.03 0.84 0.85 1.07 0.91
0.72-1.13 0.80-1.33 0.67-1.06 0.67-1.07 0.86-1.32 0.72-1.16
T3 0.88 0.91 0.90 0.94 1.04 0.82
0.70-1.10 0.70-1.19 0.72-1.14 0.74-1.19 0.84-1.29 0.64-1.04 Ttertile
Acknowledgments
The research data were collected within the scope of PONS research:
‘Establishing infrastructure for studies concerning health state of the population of Poland’(PNRF-228-AI-1/07). The study was conducted with the support of the Maria Skłodowska-Curie Institute of Oncology in Warsaw and the Polish-Norwegian Foundation Research Fund.
Author details
1The Department for the Prevention of Alimentary Tract Diseases, The Institute of Nursing and Midwifery, Faculty of Health Sciences, Jan Kochanowski University, ul. IX Wieków Kielc 19, 25-317 Kielce, Poland. 2
The Department of Surgery and Surgical Nursing with the Scientific Research Laboratory, The Institute of Nursing and Midwifery, Faculty of Health Sciences, Jan Kochanowski University, ul. IX Wieków Kielc 19, 25-317 Kielce, Poland.3Department of Developmental Age Research, Institute of Public Health, Faculty of Health Sciences, Jan Kochanowski University, ul. IX Wieków Kielc 19, 25-317 Kielce, Poland.
Received: 1 October 2014 Accepted: 27 May 2015
References
1. Ruderman N, Chisholm D, Pi-Sunyer X, Schneider S. The metabolically obese, normal-weight individual revisited. Diabetes. 1998;47:699–713.
2. Bednarek-Tupikowska G, Stachowska B, Miazgowski T, Krzyż
anowska-Świniarska B, Katra B, Jaworski M, et al. Evaluation of the prevalence of metabolic obesity and normal weight among the Polish population. Endokrynol Pol. 2012;63:447–55.
3. Philips CM, Dillon C, Harrington JM, McCarthy VJC, Kearney PM, Fitzgerald AP, et al. Defining metabolically healthy obesity: role of dietary and lifestyle factors. PLoS One. 2013;8, e76188.
4. Suliga E, KoziełD, Głuszek S. Prevalence of metabolic syndrome in normal weight individuals. Ann Agr Environ Med. in press.
5. Sahay RD, Couch SC, Missoni S, SujoldžićA, Novokmet N, DurakovićZ, et al. Dietary patterns in adults from an Adriatic Island of Croatia and their associations with metabolic syndrome and its components. Coll Antropol. 2013;37:335–42.
6. Naja F, Nasreddine L, Itani L, Adra N, Sibai AM, Hwalla N. Association between dietary patterns and the risk of metabolic syndrome among Lebanese adults. Eur J Nutr. 2013;52:97–105.
7. Baik I, Lee M, Jun N-R, Lee J-Y, Shin C. A healthy dietary pattern consisting of a variety of food choices is inversely associated with the development of metabolic syndrome. Nutr Res Pract. 2013;7:233–41.
8. Pimenta AM, Toledo E, Rodriguez-Diez MC, Gea A, Lopez-Iracheta R, Shivappa N, et al. Dietary indexes, food patterns and incidence of metabolic syndrome in a Mediterranean cohort: the SUN project. Clin Nutr. 2014. doi:10.1016/j.clnu.2014.06.002.
9. Hyun YJ, Koh SJ, Chae JS, Kim JY, Kim OY, Lim HH, et al. Atherogenecity of LDL and unfavorable adipokine profile in metabolically obese, normal-weight woman. Obesity. 2008;16:784–9.
10. Choi J, Se-Young O, Lee D, Tak S, Hong M, Park SM, et al. Characteristics of diet patterns in metabolically obese, normal weight adults (Korean National Health and Nutrition Examination Survey III, 2005). Nutr Metab Cardiovasc Dis. 2012;22:567–74.
11. Newby PK, Muller D, Hallfrisch J, Andres R, Tucker KL. Food patterns measured by factor analysis and anthropometric changes in adults. Am J Clin Nutr. 2004;80:504–13.
12. Khani BR, Ye W, Terry P, Wolk A. Reproducibility and validity of major dietary patterns among Swedish women assessed with a food-frequency questionnaire. J Nutr. 2004;134:1541–5.
13. Nanri A, Shimazu T, Ishihara J, Takachi R, Mizoue T, Inoue M, et al. Reproducibility and validity of dietary patterns assessed by a food frequency questionnaire used in the 5-year follow-up survey of the Japan Public Health Center-Based Prospective Study. J Epidemiol. 2012;22:205–15. 14. Zatoński WA, Mańczuk M, Kielce PONS team. POlish-Norwegian Study
(PONS): research on chronic non-communicable diseases in European high risk countries–study design. Ann Agric Environ Med. 2011;18:203–6. 15. Roskam AJ, Kunst AE. The predictive value of different socioeconomic
indicators for overweight in nine European countries. Public Health Nutr. 2008;29:1–11.
16. Giskes K, Avendano M, Brug J, Kunst AE. A systematic review of studies on socioeconomic inequalities in dietary intakes associated with weight gain and overweight/obesity conducted among European adults. Obes Rev. 2010;11:413–29.
17. Dehghan M, Ilow R, Zatońska K, Szuba A, Zhang X, Mente A, et al. Development, reproducibility and validity of the food frequency questionnaire to assess dietary intake in Poland arm of PURE study. J Hum Nutr Diet. 2012;25:225–32.
18. Alberti KGMM, Eckel RH, Grundy SM, Zimmet PZ, Cleeman JI, Donato KA, et al. Harmonizing the Metabolic Syndrome. A Joint Interim Statement of the International Diabetes Federation Task Force on Epidemiology and Prevention; National Heart, Lung, and Blood Institute; American Heart Association; World Heart Federation; International Atherosclerosis Society; and International Association for the Study of Obesity. Circulation. 2009;120:1640–5.
19. Fonseca MJ, Gaio R, Lopes C, Santos AC. Association between dietary patterns and metabolic syndrome in a sample of Portuguese adults. Nutr J. 2012;11:64.
20. Desmukh-Taskar PR, O’Neil CE, Nicklas TA, Yang SJ, Liu Y, Gustat J, et al. Dietary patterns associated with metabolic syndrome, sociodemographic and lifestyle factors in young adults: the Bogalusa Heart Study. Public Health Nutr. 2009;12:2493–503.
21. Monsivais P, Aggarwal A, Drewnowski A. Are socio-economic disparities in diet quality explained by diet cost? J Epidemiol Community Health. 2012;66:530–5.
22. Suliga E. Economic and social factors and the quality of nutrition of pregnant women. Med Stud. 2013;29:160–6.
23. Bouchard-Mercier A, Paradis A-M, Rudkowska I, Lemieux S, Couture P, Vohl M-C. Associations between dietary patterns and gene expression profiles of healthy men and women: a cross-sectional study. Nutr J. 2013;12:24. 24. Rizzo NS, Sabaté J, Jaceldo-Siegl K, Fraser GE. Vegetarian dietary patterns are
associated with a lower risk of metabolic syndrome: the adventist health study 2. Diabetes Care. 2011;34:1225–7.
25. Dugan CE, Fernandez ML. Effects of dairy on metabolic syndrome parameters: a review. Yale J Biol Med. 2014;87:135–47.
26. Woo HD, Shin A, Kim J. Dietary patterns of Korean adults and the prevalence of metabolic syndrome: a cross-sectional study. PLoS One. 2014;9, e111593.
27. Conus F, Allison DB, Rabasa-Lhoret R, St-Onge M, St-Pierre DH, Tremblay-Lebeau A, et al. Metabolic and behavioral characteristics of metabolically obese but normal-weight woman. J Clin Endocrinol Metab. 2004;89:5013–20. 28. Tørris C, Molin M, Cvancarova Småstuen M. Fish consumption and its
possible preventive role on the development and prevalence of metabolic syndrome - a systematic review. Diabetol Metab Syndr. 2014;6:112. 29. Zaribaf F, Falahi E, Barak F, Heidari M, Keshteli AH, Yazdannik A, et al. Fish
consumption is inversely associated with the metabolic syndrome. Eur J Clin Nutr. 2014;68:474–80.
30. Lankinen M, Kolehmainen M, Jääskeläinen T, Paananen J, Joukamo L, Kangas AJ, et al. Effects of whole grain, fish and bilberries on serum metabolic profile and lipid transfer protein activities: a randomized trial (Sysdimet). PLoS One. 2014;9, e90352.
31. Esmaillzadeh A, Mirmiran P, Azizi F. Whole-grain consumption and the metabolic syndrome: a favorable association in Tehranian adults. Eur J Clin Nutr. 2005;59:353–62.
32. Borneo R, León AF. Whole grain cereals: functional components and health benefits. Food Funct. 2012;3:110–9.