R E S E A R C H
Open Access
Impact of network density on cascade
size and community growth
Kazumasa Oida
†Correspondence:oida@fit.ac.jp
†Kazumasa Oida contributed equally to this work.
Department of Computer Science and Engineering, Fukuoka Institute of Technology, 3-30-1
Wajiro-Higashi, Higashi-ku, Fukuoka, Japan
Abstract
This paper addresses two critical questions related to (1) the co-evolutionary dynamics between information diffusion and network topology and (2) the relationship between viral content and social reinforcement. A recurrence relation model is developed to formulate the growth dynamics of a community centered on a dominant user using the tweet-retweet-follow (TRF) and exogenous link-creation events. This model illustrates several fundamental relations among parameters and quantities that are critical to answering the questions. The model reproduces social reinforcement and structural trapping effects, including empirical evidence that viral content does not require strong social reinforcement. In addition, the model demonstrates that the community growth rate is influenced not only by the rate of retweets but also by the network density of the community.
Keywords: Network density, Community, Twitter, TRF events, Recurrence relation, Co-evolutionary dynamics, Information cascade
Introduction
Online social networks (OSNs) have become indispensable vehicles of communication, information access, and advertisement. Content on OSNs may have economically, polit-ically, or socially strong influences when shared among a large number of OSN users. Numerous papers in the literature have documented the manner in which such phenom-ena emerge; however, the mechanism that causes the phenomphenom-ena may not be completely understood. This paper presents new insights into this field of study, shedding light on certain mechanisms that work in OSNs.
Every once in a while, large-scale information cascades emerge. Because of their rare occurrence, statistical or machine learning approaches present risks associated with overdependence on small samples. Therefore, analytical approaches must verify pieces of empirical evidence and derive unknown causal relationships based on the evidence. This paper contributes to the literature in the field of information diffusion by answering two important questions.
Question 1(co-evolution)Does the information diffusion co-evolve with the network topology?
It has been established that the underlying network topology affects information dif-fusion. Conversely, can information diffusion significantly alter the topology? To answer
this question, this paper evaluates the community growth rate while a diffusion process is underway and demonstrates that the growth rate is greatly influenced by the network density of the community.
Question 2(viral content)Why does viral content not require strong social reinforce-ment?
The seminal paper by Weng et al. (2013) presented a discussion on several community-related features that exhibit significant influences on information diffusion, including social reinforcement, which indicates that each additional exposure significantly increases the chance of adoption. One of the key findings of the paper was that non-viral content requires strong social reinforcement, whereas viral content does not. From an analytical perspective, this paper illustrates that large-scale cascades emergeonly if the network density of the community is low.
These questions are directly related to improvements in future cascade-size prediction. Therefore, answering these questions can help, for example, develop more effective viral marketing strategies and realize more efficient content delivery network (CDN) resource deployment for viral content.
The model in this paper presents a community structure for revealing the mecha-nisms that yield large-scale information cascades because the community-related fea-tures are considered to exhibit a strong influence on future content popularity (Weng et al. 2014). An important factor that must be considered while designing an ana-lytical model is that deviations from the empirical evidence must be small. Based on the evidence that a large number of adoptions occurred within only one degree of a few dominant individuals (Goel et al. 2012), this paper presents a scenario in which one dominant user, who has a significant influence on some online applica-tion or some social issues, is followed by a large number of Twitter users. This paper incorporates link-creation events, called tweet-retweet-follow (TRF), into the model because TRF link-creation events are orders of magnitude more likely than link-creation events caused by exogenous reasons (Antoniades and Dovrolis 2015). In addition, the paper also presents a discussion on the effects of exogenous link-creation events.
This paper focuses on the two Twitter features (a dominant user and TRF events) mentioned previously and emphasizes their importance by reproducing the community-related effects (social reinforcement and structural trapping) and the evidence describ-ing that non-viral (viral) content (does not) requires strong social reinforcement (Question 2). After that, the paper presents a discussion on the manner in which the parameters in the model, particularly the network density, relate to the two questions.
Related work
Information diffusion on OSNs has been a subject of intensive study. It has been widely recognized that information diffusion is a more complex contagion than the spread of infectious diseases. Several empirical studies indicate that connectivity distributions among online users are highly inhomogeneous (Goel et al.2012; Goel et al.2015; Bose and Shin2008). Prior studies have examined the influence of underlying network properties, such as scale-free, small-world, and community structures, on the process of information diffusion under the assumption that the networks are static (Weng et al.2013; Moore and Newman2000; Watts2002; Moreno et al.2004). The influence maximization problem in social networks, under a variety of influence mechanisms and network properties, is an ongoing focus of research (Kempe et al.2003; 2005; Aral and Dhillon2018).
Current OSNs include a variety of communities such as language communities (Jin 2017); therefore, many studies have examined or applied the characteristics of informa-tion diffusion processes as informainforma-tion is transmitted within/across OSN communities. For example, the authors in (Li et al.2015) categorized nodes into six community-aware types and evaluated their diffusion capabilities. This paper investigates the dynamics of a single Twitter community, assuming all community members are homogeneous and uniformly connected with each other.
Recent work (Tur et al.2018) evaluated the effect of social reinforcement using a thresh-old model that assumes that additional contacts are not redundant but reinforce the probability of contagion. The model in this paper also assumes that additional retweet arrivals are not redundant; the retweet rate is constant independent of the number of arrivals. A fundamental difference is that the model in Tur et al. (2018) considers static networks. Another similar study (Banisch and Olbrich2019) introduced positive and negative social feedback, and discussed the role of network density in the emergence of opinion polarization. The model in Banisch and Olbrich (2019) also assumes static underlying networks.
There are numerous studies that focus on predicting large-scale information diffusion (Weng et al.2013; Szabo and Huberman2010; Cheng et al.2014; Zhao et al.2015; Cheung et al.2017; Krishnan et al.2016). Incorporating the community structure into diffusion models is expected to improve model accuracy (Bao et al.2017). Several studies utilize community properties for prediction, such as predicting the future popularity of a meme (Weng et al.2014) and the virality timing of content (Junus et al.2015). Contrary to these results, this paper discusses the intrinsic difficulty associated with the prediction.
TRF events can create dense user communities. There have been several studies that focused on link-creation events such as triadic closure (Leskovec et al.2008), shortcuts (Weng et al.2013), homophily (Hours et al.2016; Aragón et al.2017), and social influ-ence (Aragón et al. 2017). This paper formulates a retweet diffusion model based on TRF events because the events express general content sharing and link creation dynam-ics on Twitter. Instead of introducing stochastic processes or differential equations, this paper uses recurrence relations to express TRF dynamics because the recurrence relations derived are simple and ensure extensibility.
The model
The model includes an initiator, a large number of Twitter followers of the initia-tor (referred to as supporters), and Twitter users who are not supporters (referred to as non-supporters). The model assumes that supporters are closely related to each other on the basis of the follower-followee relationship and form a commu-nity. Therefore, the model is a community centered on the initiator. This section introduces recurrence relations to express the retweet propagation phenomena that originate from the initiator to supporters and non-supporters according to the TRF events.
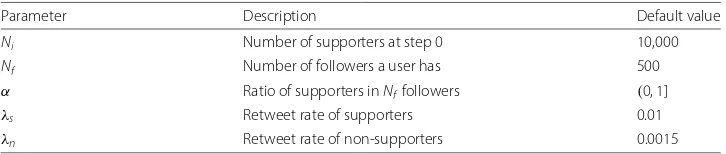
Table1presents the parameter values in the model.Nidenotes the number of support-ers at the time initiator tweets,Nf is the number of followers a user (except the initiator) has, andα∈(0, 1] is the ratio of supporters inNf followers of a supporter; e.g.,α =0 (1) indicates that allNf followers are non-supporters (supporters). Parameterαis an indica-tor of the network density of the community because a higherαimplies a higher network density. Therefore,αis also referred to as the network density indicator of the commu-nity. This paper fixes the value ofNf at 500 because most of the Twitter analysis reports on the Internet present three-digit numbers for the average number of followers.
The model is designed under the following assumptions:
Asm 1Supporters and non-supporters are homogeneous in that they do not possess any unique attributes.
• Supporters (non-supporters) retweet with rateλs(λn).λs≥λn.
• Supporters and non-supporters have the sameNf followers.
• Supporters haveαNf followers who are supporters (0< α≤1), while the followers of non-supporters are all non-supporters.
Asm 2Users synchronously post retweets after receiving (re)tweets. The synchronization points are called steps.
Table 1Parameter values in the model
Parameter Description Default value
Ni Number of supporters at step 0 10,000
Nf Number of followers a user has 500
α Ratio of supporters inNffollowers (0, 1]
λs Retweet rate of supporters 0.01
Asm 3The community does not have any specific network topology. At each step,αNf
followers of each supporter are uniformly selected from all supporters.
Asm 4All non-supporters who post retweets become supporters (i.e., follow the initiator).
Asm4is relaxed in “The extended model” section; however, the assumption provides most of the essential results in this paper. The model is simplified to focus on two Twit-ter properties: TRF events and locally scale-free structure (one dominant user and other users with a relatively small number of followers). The importance of the properties is confirmed by reproducing the community-related effects (social reinforcement and structural trapping) and (non-)viral content behavior.
Figure 1 illustrates a retweet cascade originated from the initiator at step 0. The recurrence relation model can be described as follows. Letr(i) (q¯(i)) be the number of supporters (non-supporters) who retweet at stepi. At step 0, the initiator tweets. At step 1,r(1)supporters retweet the tweet. At step 2,r(2)+q(1, 1)followers of ther(1) support-ers post retweets, whereq(i,j)denotes the number of non-supporters who post retweets at stepi+jafter receiving retweets fromq(i,j−1)non-supporters ifj>1 or fromr(i) supporters ifj=1 (see Fig.1).
From Asm4,q(1, 1)followers become supporters and the newq(1, 1)supporters influ-encer(3). Therefore,q(i,j)also denotes the number of new supporters at stepk >i+j. At step 3,r(3)+q(1, 2)+q(2, 1)users retweet. At stepi,r(i)+ ¯q(i)users retweet, where
¯
q(1)=0 and fori>1,
¯
q(i)=
i−1
k=1
q(k,i−k). (1)
Using the parameters in Table1,r(1)=λsNi,q(1, 1)=λn(Nf−αNf)r(1), andq(1, 2)= λn(Nf −αNf)q(1, 1). In general, fori≥1 andj≥0,
q(i,j+1) = λn(Nf −αNf)q(i,j)
= λj+1
n (Nf −αNf)j+1r(i). (2)
Algorithm 1Calculater(i)
1: r←0
2: forj=1 tor(i−1)+ ¯q(i−1)do 3: fork=1 toαNf do
4: Punret← Ni−r
−
1≤≤i−1r()
Ni−1−(k−1)+1≤≤i−1q¯()
5: r←r+λsPunret 6: end for
7: end for
8: r(i)←r
On the other hand, r(i) is computed according to Algorithm 1. The algorithm can be explained as follows. At stepi−1,r(i−1)+ ¯q(i−1)supporters retweet and each supporter sendsαNfretweets to supporters. Because each retweet message arrives at uni-formly selected followers (Asm3), the probability (Punret) that thek-th retweet arrives at a supporter who has not posted any retweets is given by
Punret=
Ni−r−1≤≤i−1r()
Ni−1−(k−1)+1≤≤i−1q¯()
, (3)
where the numerator denotes the number of supporters who have not posted any retweets, and the denominator denotes the number of supporters who have the possibil-ity to receive thek-th retweet. In (3),ris the number of supporters who have retweeted at stepi. In the denominator, “−1” indicates that retweeters do not receive their own retweets, and “−(k−1)” indicates that a user does not receive multiple retweets from the same user. BecausePunretis also the mean of the binomial distributionB(1,Punret), the mean value of the number of supporters who retweet after receiving thek-th retweet is given byλsPunret. For all(r(i−1)+ ¯q(i−1))×αNf retweets,λsPunretvalues are computed and added torin line 5.r(i)is then derived in line 8.
The computation ofr(i)andq¯(i)stops ati=T+1 if
r(T+1)+ ¯q(T+1) <1, (4) which indicates that the number of users who post retweets at stepT+1 is less than one. This paper definesT(steps) as the duration of retweet propagation.
Results
Sparse community effect
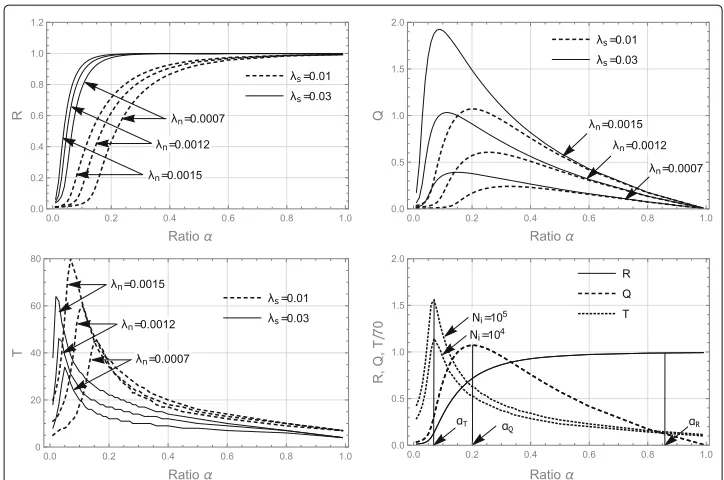
Fig. 2Upper left: the social reinforcement and sparse community effects (αR↓asλs↑orλn↑) appear. Upper right: the structural trapping and sparse community effects (αQ↓asλs↑orλn↑) and “Q(αQ)↑as
λs↑orλn↑” hold. Lower left: the sparse community effect (αT↓asλs↑orλn↑) and “T(αT)↓asλs↑or
λn↓” hold. Lower right: relations “αT< αQ< αR” and “T(αT)↑asNi↑” hold. Upper left, upper right, and lower left:Ni=104. Lower right:Ni=104, 105,λs=0.01, andλn=0.0015.RandQcurves atNi=104in the lower right graph completely overlap with those atNi=105
Through intensive calculations, the following four fundamental relations are derived. The first two findings are related to the behavior ofαR,αQ, andαT. From Fig. 2(lower right),
αT < αQ< αR. (5)
The second finding is thatαT,αQ, andαRdecrease asλsorλnincreases (see Fig.2(upper left), (upper right), and (lower left)); i.e.,
αT ↓,αQ↓,αR↓ as λs↑orλn↑. (6) This paper terms this phenomenon thesparse community effect. The effect implies that sparse communities, in which supporters have many (few) links to non-supporters (sup-porters), yield the largest cascades (R+Q) and the most long-lived cascades (T) when the rates of retweet are high. The sparse community effect presents a case in which the network structure affects content virality.
The third finding is thatQ(αQ)rises asλsorλngrows; whereasT(αT)falls (rises) asλs (λn) grows; i.e.,
T(αT)↓,Q(αQ)↑ asλs↑, (7)
T(αT)↑,Q(αQ)↑ asλn↑. (8) The fourth finding is illustrated in Fig.2(lower right).T(αT)increases withNi; i.e.,
Note that in Fig. 2(lower right), RandQdo not change with Ni (these are quantities relative toNi).
Structural trapping and social reinforcement
Figure 2 presents other findings that agree with the empirical phenomena. It can be observed from Fig.2(upper right) thatQapproaches zero asαapproaches one; i.e.,
Q↓0 as α↑1, (10)
which represents thestructural trapping effect (Weng et al.2013) because a larger α, indicating denser communities with fewer outgoing links, lowersQ, indicating a smaller amount of propagation outside of the community. While, Fig.2(upper left) illustrates the social reinforcementeffect, which indicates that in the presence of high clustering, any additional adoption is likely to produce more multiple exposures than in the case of low clustering (Weng et al.2013), becauseRis a strictly increasing function ofα; i.e.,
R↑ as α↑. (11)
Answering two questions
Let us first discuss Question1(co-evolution) in “Introduction” section using the commu-nity growth rate measured byQ/T. A largeQ/Timplies dynamic community growth. The following demonstrate under what conditions it is dynamic (or static). BecauseαT =αQ, the growth rateQ/Tmust greatly vary in the range of [αT,αQ]. It can be anticipated that
Q(αT)
T(αT) <
Q(αQ)
T(αQ)
. (12)
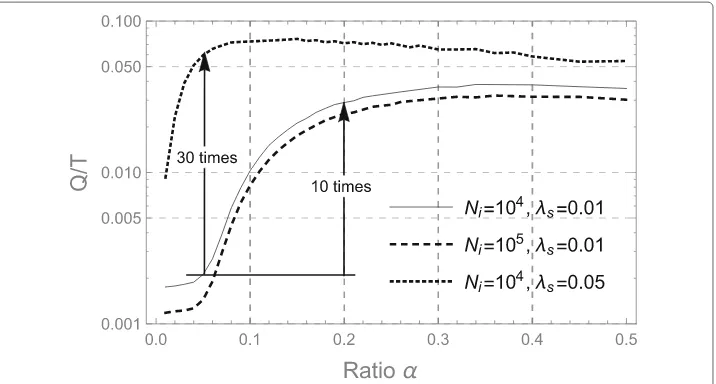
Figure 3 compares the growth rates at α = 0.05, which is close to αT, and at α = 0.2(≈ αQ). From the figure, Q(0.2)/T(0.2) is approximately 10 times greater than
Q(0.05)/T(0.05).
Fig. 3Growth rateQ/Tdepends onα,λs, andNi.
Meanwhile, (7) suggests thatQ/T monotonically increases withλs; i.e.,
Q/T ↑ asλs↑. (13)
Figure 3 illustrates the case where λs increases from 0.01 to 0.05. From the figure,
Q(0.05)/T(0.05)atλs = 0.05 is approximately 30 times greater than that atλs = 0.01. This implies that an attractive tweet from the initiator has the potential to greatly enlarge the growth rate. Note from Fig. 3 that Q(0.05)/T(0.05) at Ni = 104 andλs = 0.05 is approximately 0.06, and this implies that after 10 steps, the average community size increases by 60%.
BecauseQis independent ofNi(see Fig.2(lower right)), it follows from (9) that
Q/T ↓ asNi↑. (14)
In other words, communities with a large number of supporters grow slowly. Figure 3 illustrates thatQ/T at Ni = 105is slightly smaller that atNi = 104. Accordingly, the growth rate is particularly sensitive toαandλs.
Let us next discuss Question 2 (viral content) using the cascade size W, which is measured byW =R+Q. From (6)–(8),
Q(αQ)↑,αQ↓,αR↓asλs↑or λn↑, (15) which implies that cascade size W exhibits a higher peak at a smaller α asλs or λn increases; i.e.,
W(αW)↑,αW↓asλs↑orλn↑, (16) whereαWis the ratioαthat maximizesW. Namely, a large number of users post retweets (i.e., viral content emerges) at small α values where the social reinforcement effect is considered to be small.
Let us intuitively explain why (16) occurs. Community members (i.e., supporters) exhibit a greater tendency to post retweets than non-members (i.e., non-supporters) because of the social reinforcement effect andλs > λn. When the value ofλsis high, for example, members easily retweet; therefore, by reducingα, more retweets must be sent outside of the community, providing non-members more chances to retweet; otherwise, the structural trapping effect becomes more pronounced. In other words, to maximize W, the ratioαWcontrols the numbers of retweet messages flowing inside and outside the community such that fewer (more) messages flow inside (outside) the community (i.e., αWis reduced) when the value ofλsorλnincreases (the sparse community effect).
The extended model
Detailed user behavior
Asm4in “Results” section assumes that all non-supporters who post retweets become supporters. This section relaxes the assumption and introduces exogenous link-creation, which states that non-supporters become supporters without receiving retweets, by replacing Asm4with the following assumptions:
Asm 5The ratio of non-supporters who become supporters after retweetingβr(referred
to as the retweeter’s follow rate), which is given by
βr=
#{x∈Sn|x posts a retweet and become a supporter} #{x∈Sn|x posts a retweet}
satisfies0< βr≤1, where Snis the set of non-supporters.
Asm 6The ratio of non-supporters who become supporters without retweeting βn
(referred to as the exogenous link-creation indicator), which is given by
βn=
#{x∈Sn|x becomes a supporter and does not retweet} #{x∈Sn|x becomes a supporter}
, (18)
satisfies0≤βn<1.
Asm 7 The ratio of non-supporters who become supporters without retweeting after receiving retweets c, which is given by
c= #{x∈Sn|x receives a retweet, becomes a supporter, and does not retweet} #{x∈Sn|x becomes a supporter}
, (19)
is fixed and0≤c≤βn.
Asm4corresponds toβr=1 andβn=0. Constantcin Asm7does not affect the output of the extended model; while, Asms5and6require making the following modifications to Algorithm 1:
• In line 2 in Algorithm 1,r(i−1)+ ¯q(i−1)(the number of supporters who retweet at stepi−1) is replaced withr(i−1)+βrq¯(i−1).
• In line 4,Punretis revised as
Punret =
Ni−r−1≤≤i−1r()+βr1−βnβn1≤≤i−1q¯()
Ni−1−(k−1)+βr
1+ βn
1−βn 1≤≤i−1q¯()
. (20)
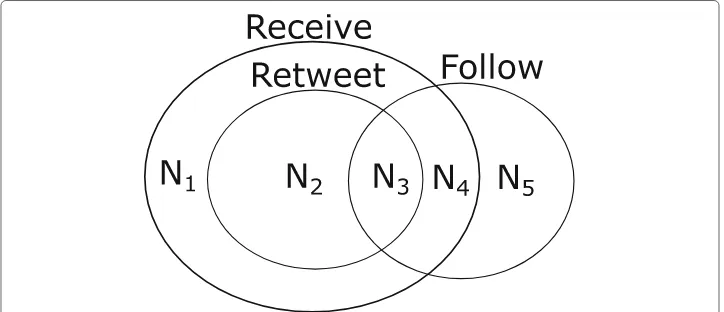
The following explains (20). Figure4illustrates five non-supporter groups classified on the basis of three actions: receive, retweet, and follow. In the figure,Nk denotes the size of thek-th group at each step. Note that the previous model corresponds to the case of N2=N4=N5=0. From (17)–(19),
Fig. 4Non-supporters are classified into five groups on the basis of three actions (receive, retweet, and follow) at each step.N1,N2,. . .,N5denote the sizes of these groups (e.g.,N2non-supporters post retweets
βr =
N3
N2+N3
, (21)
βn =
N4+N5
N3+N4+N5
, (22)
c = N4 N3+N4+N5
. (23)
Because the number of non-supporters who retweet at stepisq¯(),
N2+N3= ¯q(). (24)
As a modification, the numerator in (3) must include N4+ N5 (the number of new
supporters who have not retweeted) of all previous steps and the denominator requires replacement ofN3, which corresponds toq¯(), withN3+N4+N5(the number of new
supporters) for all previous steps. From (21), (22), and (24),
N4+N5 = βn
1−βnβr¯
q(), (25)
N3+N4+N5 = βrq¯()+ βn 1−βnβr¯
q(). (26)
Therefore, compared with (3), the numerator in (20) includes a new term βr1−βnβn
1≤≤i−1q¯(), and in the denominator,
1≤≤i−1q¯() is replaced by
βr
1+ βn
1−βn 1≤≤i−1q¯().
Let us next considerexogenous link-creation events(Antoniades and Dovrolis2015), which indicate that non-supporters become supporters without receiving retweets. Therefore, the ratio of exogenous link-creation events in the link-creation eventsβeis given by
βe =
N5
N3+N4+N5
. (27)
Using (22), (23), and (27),
βn=βe+c, (28)
which indicates that βe linearly increases with βn. Therefore, βn is referred to as the exogenous link-creation indicator.
The new assumptions redefineR(the relative number of supporters who retweet until stepT),Q(the relative number of non-supporters who become supporters untilT), and cascade sizeW (the relative number of users who retweet untilT). LetQ¯ = Tk=1q¯(k) andR¯ =Tk=1r(k). They are written as
R= ¯R
Ni+βr βn 1−βn
¯
Q
−1
, (29)
Q= βr
1+ βn 1−βn
¯
Q/Ni, (30)
W = Q¯ + ¯R /Ni, (31)
Relaxing sparse community effect
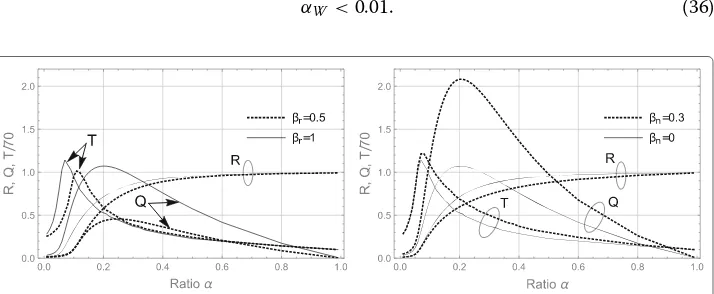
Figure5 exhibits the effects of the retweeter’s follow rate βr and the exogenous link-creation indicatorβn. In Fig.5(left) and (right), the solid lines correspond to the previous model (i.e.,βr =1 andβn = 0). Because these parameters directly affectQ, it is natural thatQmust increase withβrorβn. The effects ofβrandβncan be summarized as follows:
αT ↓,αQ↓,αR↓ asβr↑orβn↓, (32)
T(αT)↑,Q(αQ)↑ asβr↑orβn↑. (33) From (32), an increase inβrstrengthens the sparse community effect, whereasβn weak-ens the effect. The following partly explains (32). An increase inβr or a decrease inβn indicates that a percentage of retweeters in the community increases; therefore, to enlarge RandQ, more retweets must flow outside the community, which implies thatαQandαR decrease.
The extended model also satisfies the fundamental relations (5)-(9) in “Results” section and exhibits the sparse community, social reinforcement, and structural trapping effects. Therefore, the extended model provides the same discussion on Questions 1and2 as in “Answering two questions” subsection.
Figure6illustrates the growth rate (Q/T) and the cascade size (W) for differentβrand βnvalues. It can be observed from the figure that
Q/T ↑ asβr↑orβn↑, (34)
W ↑ asβr↑orβn↑. (35)
It is worth noting that in Fig.6(upper left),Q(0.1)/T(0.1)atβr = 1 is approximately 50 times greater than that atβr=0.1; i.e., a low retweeter’s follow rate makes networks static. In addition, from Fig.6(lower right), the high peak ofW at βn = 0.4 suggests another mechanism that creates large-scale cascades.
Large cascade creation mechanisms
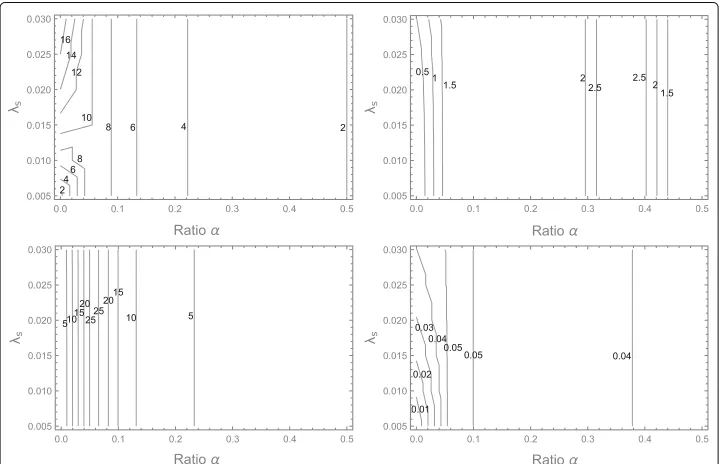
Figure7illustrates contour lines of cascade sizeW and growth rateQ/T on theα−λs plane. Figure7(upper left) exhibits the case wherein large-scale cascades emerge because W =16 impliesW×Ni =160, 000 retweets. This large cascade creation mechanism at βn=0 is referred to as theendogenous mechanism. The figure exhibits that
αW <0.01. (36)
Fig. 6Upper left: “Q/T↑asβr↑” andQ(0.1)/T(0.1)|βr=1≈50×Q(0.1)/T(0.1)|βr=0.1holds. Upper right:
“Q/T↑asβn↑” holds. Lower left: “W↑asβr↑” holds. Lower right:βnhas a large impact onW. “W↑asβn↑” holds. For all figures, solid lines correspond to the previous model (βr=1,βn=0),λs=0.01,λn=0.0015, andNi=104
Inequality (36) coincides with (16). The figure also indicates that W significantly decreases at low ratiosαasλsdecreases to 0.005. This result also agrees with the sparse community effect because (6) is equivalent to
αQ↑,αR↑ asλs↓. (37)
It must be noted that the cascade size is determined not byλs(content infectivity) but by α(network structure) whenα >0.1.
Figure7(upper right) is obtained using the same parameter values as Fig.7(upper left) except thatλnis reduced from 0.002 to 0.001. Large-scale cascades do not appear in this case. The maximumWfalls to 2.5 andαWincreases and satisfies
0.3< αW <0.4, (38)
which also coincides with (16). This result implies that large α values in (38) enlarge small- and middle-scale cascades; i.e., non-viral content requires social reinforcement. The result also demonstrates that large-scale cascades require not only a largeλsbut also a largeλn.
Figure7(lower left) is calculated using the same parameter values as Fig.7(upper right) except thatβnis increased from 0 to 0.7. In this case, large-scale cascades again emerge because the maximum ofW is 25. This large cascade creation mechanism is referred to as theexogenous mechanism. From the figure,
0.05< αW <0.07, (39)
which indicates that compared with (36), this mechanism requires somewhat weak social reinforcement. This result agrees with (32).
Figure7(lower right) illustrates contour lines of growth rateQ/T obtained using the same parameter values as Fig.7(upper left). It can be observed that theα−λs plane is separated into dynamic (highQ/T) and static (lowQ/T) areas. The static area is located in a small area whereλsandαare both small. This result agrees with (13), Figs.3,6(upper left), and6(upper right). From Fig.7(upper left) and (lower right),W andQ/T are not correlated and they have the maximum values at different(α,λs)points.
Discussion
Implications of the findings
communities (Antoniades and Dovrolis2015), the prediction of viral content becomes even more difficult.
This paper incorporated exogenous link-creation events into the model and demon-strated that these events have the potential to create large-scale cascades. According to (Antoniades and Dovrolis2015), their occurrence probability is significantly low (two or three orders of magnitude lower than the occurrence probability of TRF events). However, big data analytical services, such as personalized recommendation in social networking sites, may boost exogenous link creation in the future.
This paper presents a simplified model, focusing on two Twitter properties: the TRF events and the existence of a dominant user with a large number of followers; never-theless, the model reproduces social reinforcement and structural trapping effects and presents many interesting causal relations related to Questions1and2. This outcome suggests that these properties are important factors for understanding real network dynamics.
Limitations of this approach
The results in the paper are only hypotheses and must be validated by detailed event-driven simulations or empirical evidence. Because of the uniformly-connected homoge-neous agent and synchronous retweet assumptions (Asms1–3), the model presents the average behavior of the retweet diffusion phenomena. To measure the effects of variations in agent behavior or network structure, one approach is to introduce a heterogeneous agent model with some network topological features. Another approach is to extend the model such that communities or sub-communities inside a community have differ-ent attribute values. The latter approach minimizes the complexity of the model and is therefore suited to simulate large-scale diffusion processes. Using the recurrence rela-tions and Algorithm 1 in the paper, the heterogeneous (sub)community model can be easily derived.
Conclusions
This paper addressed the following questions: (1) Can the underlying network be con-sidered static while a diffusion process is underway? (2) Why does viral content not require strong social reinforcement? The paper introduced a recurrence relation model that describes the retweet diffusion and community growth dynamics, in which one dom-inant user (initiator) with a large number of followers posts a tweet, then retweets by followers propagate the tweet, and TRF and exogenous link-creation events generate new followers. Consequently, the community comprising the followers of the initia-tor grows. The paper focused on the ratio of community members in the followers of each community member (α), which is also a network density indicator of the com-munity. The model not only illustrates the structural trapping and social reinforcement effects but also presents several important relations among three ratios αT,αQ, and αR, three quantitiesR, Q, andT, and four parametersλs,λn,βr, andβn. Above all, the magnitude relation (αT < αQ < αR), the sparse community effect, and the result thatQ(αQ)grows andT(αT)falls asλsincreases were directly associated with the two questions.
(1) The criterion for network variability was the community growth rate. Except for the cases in which the retweeter’s follow rateβris significantly small or the commu-nity size is extremely large, the growth rate is small when retweet rateλsand ratio αare both small. If the condition does not hold, the growth rate may rise by more than 10 times; i.e., the networks are potentially dynamic. Therefore, depending on the evaluation conditions of diffusion models, the effect of topological changes must be considered.
(2) There are two mechanisms that create large-scale cascades: the endoge-nous and exogeendoge-nous mechanisms. Currently, only the endogeendoge-nous mechanism is functional in the Twitter network. Both mechanisms demonstrated that the cascade size is maximized at a low ratio α (i.e., at a low network density), at which the social reinforcement effect is considered to be low. Thus, the model reproduced the evidence that viral content does not require strong social rein-forcement. This result is closely related to the sparse community effect, which indicates that as the retweet rates increase, the α value that maximizes the cascade size decreases. Therefore, large-scale cascades emerge only if the ratio is low.
Funding
Not applicable.
Availability of data and materials
Not applicable.
Author’s contributions
The author conducted this study alone. The author read and approved the final manuscript.
Competing interests
The author declare that no competing interests exist.
Publisher’s Note
Springer Nature remains neutral with regard to jurisdictional claims in published maps and institutional affiliations.
Received: 13 November 2018 Accepted: 22 April 2019
References
Antoniades D, Dovrolis C (2015) Co-evolutionary dynamics in social networks: A case study of twitter. Comput Soc Netw 2(1):14
Aragón P, Gómez V, García D, Kaltenbrunner A (2017) Generative models of online discussion threads: state of the art and research challenges. J Internet Serv Appl 8(1):15
Aral S, Dhillon PS (2018) Social influence maximization under empirical influence models. Nat Hum Behav 2(6):375 Banisch S, Olbrich E (2019) Opinion polarization by learning from social feedback. J Math Sociol 43(2):76–103 Bao Q, Cheung WK, Zhang Y, Liu J (2017) A component-based diffusion model with structural diversity for social
networks. IEEE Trans Cybernet 47(4):1078–1089
Bose A, Shin KG (2008) On capturing malware dynamics in mobile power-law networks. In: Proceedings of the 4th International Conference on Security and Privacy in Communication Netowrks. ACM. p 12
Cheng J, Adamic L, Dow PA, Kleinberg JM, Leskovec J (2014) Can cascades be predicted?. In: Proceedings of the 23rd International Conference on World Wide Web. ACM. pp 925–936
Cheung M, She J, Junus A, Cao L (2017) Prediction of virality timing using cascades in social media. ACM Trans Multimed Comput Commun Appl (TOMM) 13(1):2
Farajtabar M, Wang Y, Gomez-Rodriguez M, Li S, Zha H (2017) Coevolve: A joint point process model for information diffusion and network evolution. J Mach Learn Res 18:1–49
Goel S, Anderson A, Hofman J, Watts DJ (2015) The structural virality of online diffusion. Manag Sci 62(1):180–196 Goel S, Watts DJ, Goldstein DG (2012) The structure of online diffusion networks. In: Proceedings of the 13th ACM
Conference on Electronic Commerce. ACM. pp 623–638
Hours H, Fleury E, Karsai M (2016) Link prediction in the twitter mention network: impacts of local structure and similarity of interest. In: Data Mining Workshops (ICDMW), 2016 IEEE 16th International Conference On. IEEE. pp 454–461 Jin H (2017) Detection and characterization of influential cross-lingual information diffusion on social networks. In:
Junus A, Ming C, She J, Jie Z (2015) Community-aware prediction of virality timing using big data of social cascades. In: Big Data Computing Service and Applications (BigDataService), 2015 IEEE First International Conference On. IEEE. pp 487–492
Kempe D, Kleinberg J, Tardos É (2003) Maximizing the spread of influence through a social network. In: Proceedings of the Ninth ACM SIGKDD International Conference on Knowledge Discovery and Data Mining. ACM. pp 137–146 Kempe D, Kleinberg J, Tardos É (2005) Influential nodes in a diffusion model for social networks. In: International
Colloquium on Automata, Languages, and Programming. Springer. pp 1127–1138
Krishnan S, Butler P, Tandon R, Leskovec J, Ramakrishnan N (2016) Seeing the forest for the trees: new approaches to forecasting cascades. In: Proceedings of the 8th ACM Conference on Web Science. ACM. pp 249–258
Leskovec J, Backstrom L, Kumar R, Tomkins A (2008) Microscopic evolution of social networks. In: Proceedings of the 14th ACM SIGKDD International Conference on Knowledge Discovery and Data Mining. ACM. pp 462–470
Li C-T, Lin Y-J, Yeh M-Y (2015) The roles of network communities in social information diffusion. In: Big Data (Big Data), 2015 IEEE International Conference On. IEEE. pp 391–400
Myers SA, Leskovec J (2014) The bursty dynamics of the twitter information network. In: Proceedings of the 23rd International Conference on World Wide Web. ACM. pp 913–924
Moore C, Newman ME (2000) Epidemics and percolation in small-world networks. Phys Rev E 61(5):5678
Moreno Y, Nekovee M, Pacheco AF (2004) Dynamics of rumor spreading in complex networks. Phys Rev E 69(6):066130 Oida K, Okubo K (2019) Adopter community formation accelerated by repeaters of product advertisement campaigns.
IEEE Trans Comput Soc Syst 6(1):56–72
Szabo G, Huberman BA (2010) Predicting the popularity of online content. Commun ACM 53(8):80–88
Tur EM, Zeppini P, Frenken K (2018) Diffusion with social reinforcement: The role of individual preferences. Phys Rev E 97(2):022302
Watts DJ (2002) A simple model of global cascades on random networks. Proc Natl Acad Sci 99(9):5766–5771 Weng L, Menczer F, Ahn Y-Y (2013) Virality prediction and community structure in social networks. Sci Rep 3:2522 Weng L, Menczer F, Ahn Y-Y (2014) Predicting successful memes using network and community structure. In: ICWSM Weng L, Ratkiewicz J, Perra N, Gonçalves B, Castillo C, Bonchi F, Schifanella R, Menczer F, Flammini A (2013) The role of
information diffusion in the evolution of social networks. In: Proceedings of the 19th ACM SIGKDD International Conference on Knowledge Discovery and Data Mining. ACM. pp 356–364