R E S E A R C H
Open Access
SURREAL: Subgraph Robust
Representation Learning
Saba A. Al-Sayouri
1*, Danai Koutra
2†, Evangelos E. Papalexakis
3†and Sarah S. Lam
1†*Correspondence: [email protected] †Danai Koutra, Evangelos E.
Papalexakis and Sarah S. Lam contributed equally to this work. 1Systems Science and Industrial Engineering Department, Binghamton University, 4400 Vestal Pkwy E, 13902 Binghamton, NY, United States
Full list of author information is available at the end of the article
Abstract
The success of graph embeddings or nodrepresentation learning in a variety of downstream tasks, such as node classification, link prediction, and recommendation systems, has led to their popularity in recent years. Representation learning algorithms aim to preserve local and global network structure by identifying node neighborhoods. However, many existing network representation learning methods generate
embeddings that are still not effective enough, or lead to unstable representations due to random processes (e.g., random walks to generate context) and thus, cannot generalize to multi-graph problems. In this paper, we propose SURREAL, a novel, stable graph embedding algorithmic framework that leverages “spatio-electric” (SE)
subgraphs: it learns graph representations using the analogy of graphs with electrical circuits. It preserves both local and global connectivity patterns, and addresses the issue of high-degree nodes that may incidentally connect a pair of nodes in a graph. Further, it exploits the strength of weak ties and meta-data that have been neglected by baselines. The experiments show that SURREAL outperforms state-of-the-art techniques by up to 37% (6% on average) on different multi-label classification problems. Further, in contrast to baseline methods, SURREAL, being deterministic, is stable and thus can generalize to single and multi-graph tasks.
Keywords: Large-scale information networks, Representation learning, Graph embeddings, Graph embeddings
Introduction
Conventional graph mining algorithms (Goyal and Ferrara 2017) have been designed to learn a set of hand-crafted features that best perform to conduct a specific down-stream task; i.e., link prediction (Liben-Nowell and Kleinberg2007), node classification (Bhagat et al. 2011), and recommendation (Yu et al.2014). However, present research has steered the direction towards a more effective way to mine graphs: feature learn-ing (Bengio et al.2013). That is, a unified set of features that can effectively generalize over distinct graph mining-related tasks is exploited. To this end, recent research efforts have focused on designing either unsupervised or semi-supervised algorithms to learn node representations (Perozzi et al.2014; Perozzi et al.2016; Grover and Leskovec2016; Tang et al.2015). Such efforts have been initiated in the domain of natural language pro-cessing (NLP) (Mikolov et al. 2013; Le and Mikolov 2014; Mikolov et al.2013), where two word2vec (Mikolov et al. 2013) models have been proposed, namely continuous bag of words (CBOW) and SkipGram. Inspired by the recent advancements in the NLP
domain, and the analogy in the context, various algorithms have been developed to learn graph representations (Perozzi et al.2014; Tang et al.2015; Grover and Leskovec2016). However, since real-world networks convey more complex relationships compared to those emerging in corpora, some recent representation learning algorithms (Perozzi et al. 2014; Perozzi et al.2016; Grover and Leskovec2016) generate representations that are still not effective enough in preserving network structure, and have room for improvement. This in turn impacts the quality of node representations, which compromises the perfor-mance of downstream processes. In addition, state-of-the-art algorithms, such as random walk-based methods, share a major stability issue that renders them less robust and appli-cable to multi-graph problems (Heimann and Koutra2017; Heimann et al.2018), such as graph similarity (Koutra et al.2013) and network alignment (Bayati et al.2009). This can be attributed to the fact that nodes on random walks are sampled by ID, where the basic assumption is that graphs are permuted and nodes that should align do not neces-sarily have the same ID. As a result, while baseline representation learning methods strive to preserve similarities among nodes in a single graph, they fail to maintain similarities across different runs of the methods, even with using the same dataset (Heimann et al. 2018) (graph similarity (Koutra et al.2013) and network alignment (Bayati et al.2009)).
In addition to the representations’ robustness, the quality of the learned representations is heavily influenced by the preserved local and global structure, matters. Therefore, we develop a robust graph embedding method that preserves connectivity patterns unique to undirected and (un)weighted graphs. It employs the concept of network flow represented by spatio-electric (SE) subgraphs. The SE subgraphs leverage the analogy with electri-cal circuits: a node is assumed to serve as a voltage source, and an edge is assumed to be a resistor, where its conductance is considered as the weight of the edge. Forming a SE subgraph allows to: (1) Concurrently capture thenode local and global connections, (2) Account for the node degree imbalances by downweighing the importance of paths through high-degree nodes (hops), (3) Take into account both low- and high-weight edges; and (4) Account formeta-datathat is largely being neglected by existing embed-ding methods.Meta-datarepresents network’s flow that indicates the actual unnoticeable interactions that may take place between any two nodes in the network. Capturing net-work’s flow can significantly improve that preservation of network global structure, in particular.
To summarize, our contributions are:
1. Flow-based Formulation.We propose a graph embedding approach that robustly preserves local and global structure by leveraging the notion of network flow to produce approximate but high-quality SE subgraphs between pairs of non-adjacent nodes in undirected and (un)weighted large-scale graphs. We use the formed SE subgraphs to identify the node neighborhoods and not restrict ourselves just to one- or two-hop neighbors.
2. Algorithm for Stable Representations.Contrary to all state-of-the-art methods, which involve randomness, reflected on the embeddings and their quality, our proposed SUbgraph Robust REpresentAtion Learning method, SURREAL1, produces consistent embeddings across independent runs.
SURREAL outperforms state-of-the-art algorithms by up to 36.85% on multi-label classification problem, and (2) Robustness: in contrast to baseline methods, SURREAL is stable across different runs on the same dataset.
Related work
Representation Learning. Recent work in network representation learning has been largely motivated by the new progress in natural language processing (NLP) domain (Mikolov et al. 2013; Le and Mikolov 2014; Mikolov et al. 2013), due to the existing analogy among the two fields, where a network is represented as a document. One of the NLP leading advancements is rooted to the SkipGram model (Mikolov et al. 2013), due to its efficiency in scaling to large-scale networks. However, merely adopt-ing the SkipGram model for graph representation learnadopt-ing seems to be insufficient in capturing local and global connections (Perozzi et al. 2014; Tang et al. 2015; Grover and Leskovec2016), because of the sophisticated connectivity patterns emerge in real-world networks, but not in text corpora. Specifically, DeepWalk (Perozzi et al. 2014; Perozzi et al. 2016), for instance, employ small truncated random walks to approx-imate the neighborhood of a node in a graph. LINE (Tang et al. 2015) proposes to preserve the network local and global structure using first- and second-order prox-imities (Zhang et al. 2017; Goyal and Ferrara 2017), respectively. However, using the second-order proximity allows to preserve network structure only up to 2-hop neigh-bors. To the contrary, SURREAL is able to preserve more general global structure, since there is no pre-specified number of hops examined. Another approach, node2vec (Grover and Leskovec 2016), proposes to preserve homophily and structural equiv-alence using biased random walks. Recently, graph convolutional network (GCN) methods (Chen et al.2018; Hamilton et al.2017) are developed to learn network rep-resentations. Unlike these works, we propose to effectively and robustly learn node representations.
Proximity Subgraphs.There is a significant body of work addressing the problem of finding the relationships between a set of given nodes in a network. For instance, (Akoglu et al.2013) finds simple pathways between a small set of marked nodes by leveraging the Minimum Description Length principle, while (Tong and Faloutsos2006) defines the center-piece subgraph problem as finding the most central node with strong connections to a small set of input nodes. The work on connection subgraphs (Faloutsos et al.2004), which capture proximity among any two non-adjacent nodes in arbitrary undirected and (un)weighted graphs, leverage the analogy with electrical circuits. Proximity subgraphs have also been employed for graph visualization (Rodrigues Jr. et al.2006). Our work is the first to explore and extend connection subgraphs to define appropriate neighborhoods for representation learning.
Problem formulation
Preliminary definition
Problem definition
Learning Large-scale Network Representations.Given a large-scale (un)weighted and undirected graph; G = (V,E), with |V| = n nodes and |E| = m edges, the prob-lem of learning node representations seeks to preserve the network structure (e.g., local, global) while mapping each nodev∈Vfrom a high-dimensional feature space to a low-dimensional feature spaceRd using a mapping function,f
G: V → Rd, whered |V|. Since learning node representations aims to preserve network structure, state-of-the-art methods have employed various proximity metrics, such as first-order proximity (Goyal and Ferrara2017; Zhang et al.2017) that strives to preserve network local connections, and second-order proximity (Goyal and Ferrara 2017; Zhang et al.2017) that aims to capture network global structure at a maximum distance of 2-hop neighbor from a given node. Nevertheless, since a small percentage of a network’s nodes are explicitly connected using first-order connections, and the large majority of network nodes are linked together via higher-order connections (e.g., second-order or higher), first- and second-order proximitiy are insufficient to effectively capture network structure, we propose to solve the following problem:
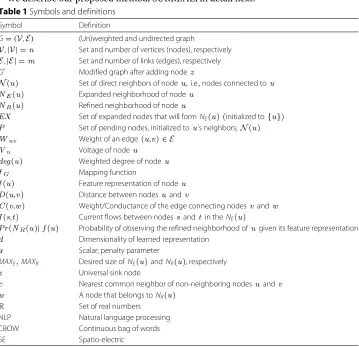
We describe our proposed method, SURREAL, in detail next. Table 1Symbols and definitions
Symbol Definition
G=(V,E) (Un)weighted and undirected graph
V,|V| =n Set and number of vertices (nodes), respectively E,|E| =m Set and number of links (edges), respectively G Modified graph after adding nodez
N(u) Set of direct neighbors of nodeu,i.e., nodes connected tou NE(u) Expanded neighborhood of nodeu
NR(u) Refined neighborhood of nodeu
EX Set of expanded nodes that will formNE(u) (initialized to{u}) P Set of pending nodes, initialized tou’s neighbors,N(u)
Wuv Weight of an edge(u,v)∈E
Vu Voltage of nodeu
deg(u) Weighted degree of nodeu fG Mapping function
f(u) Feature representation of nodeu D(u,v) Distance between nodesuandv
C(v,w) Weight/Conductance of the edge connecting nodesvandw I(s,t) Current flows between nodessandt in theNE(u)
Pr(NR(u)|f(u) Probability of observing the refined neighborhood ofugiven its feature representation
d Dimensionality of learned representation
α Scalar; penalty parameter
MAXE,MAXR Desired size ofNE(u)andNR(u), respectively z Universal sink node
c Nearest common neighbor of non-neighboring nodesuandv w A node that belongs toNR(u)
Proposed method: SURREAL
In this section, we describe our proposed method, SURREAL, a deterministic algorithm that is capable of preserving local and global—beyond two hops—connectivity patterns. It consists of two main steps: (1) Neighborhood definition via SE subgraphs (3), which consists of neighborhood expansion and refinement phases, and (2) Node representation vector update (3). Since our method is deterministic, it can be applied to multi-graph problems, unlike previous works (Perozzi et al.2014; Grover and Leskovec2016; Perozzi et al.2016) that employ random processes, such as random walks.
Step 1: neighborhood definition
The heart of learning node representations is to obtain representative node neighbor-hoods, which preserve local and global connections simultaneously. We propose to define node neighborhoods by leveraging the analogy between graphs and electrical circuits. Specifically, we introduce the idea of spatio-electric (SE) subgraphs, which are defined as proximity subgraphs that capture network structuer and formed on spatial and electri-cal bases. In particular, for a given node, we first expand its neighborhood on a distance basis to form the expanded subgraph. We afterward, refine the expanded subgraph on an electrical current (network flow) basis to ultimately generate the refined subgraph that represents the node neighborhood. We primarily summarize the benefit of using SE sub-graphs in two points: (1) They render our method capable to better preserve network global structure—beyond two hops; and (2) Unlike baseline methods that employ ran-dom processes (e.g., ranran-dom walks) for neighborhood generation, the use of SE subgraphs leads to generate robust neighborhoods, and thus robust representations across different runs on the same dataset.
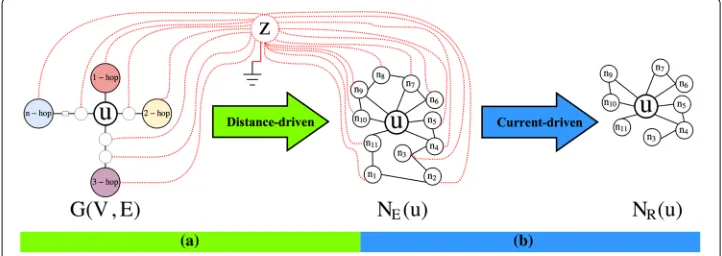
The neighborhood definition step consists of two phases: (A)Neighborhood expansion, and (B)Neighborhood refinement. We describe each phase next, and give an illustration in Fig.1.
Phase A: neighborhood expansion - NE(u)
Given a nodeu, we propose to gradually expand its neighborhood on a distance basis. Specifically, we employ the analogy with electrical circuits in order to capture the dis-tances betweenuand the other nodes in the network, and then leverage these distances to guide its neighborhood expansion. This phase refers to the spatial part of the SE subgraphs formation process.
Fig. 1A description of SURREAL algorithm neighborhood definition step main phases: (a) Neighborhood expansion of nodeuthroughn−hopneighbors to generateNE(u)on distance basis. Nodezindicates the
Graph Construction.We first construct a modified networkGfromGby introducing a universal sink node z(grounded, with voltage (Vz = 0), and connect all the nodes (except fromu) to that, as shown in Fig.1a. The newly added edges inGfor every node v ∈ {V \u}are weighted appropriately by the following weight or conductance (based on the circuit analogy):
C(v,z)=α x∈N(v)\z
C(v,x), (1)
whereC(v,x)is the weight or conductance of the edge connecting nodesvandx,N(v) is the set of 1-hop neighbors of v, and α > 0 is a scalar (set to 1 for unweighted graphs).
In the modified networkG, the distance, or proximity, between the given nodeuand every other node is defined as:
D(u,v)=
logdegC2(2u(,vu)), forv∈N(u).
logD(u,c)+D(c,v), forv∈/N(u), andu,v∈N(c). (2)
where deg(u) is the weighted degree of u (i.e., the sum of the weights of its incident edges), and the distance for non-neighboring nodes uandvis defined as the distance from each one to their nearest common neighbor c ∈ V. During the neighborhood expansion phase, the distance formula addresses the issue of high-degree nodes (e.g., hops) that are generally incidentally connected—unrelated—to a specific node in the graph, but appear closer than low-degree nodes that may be truly connected—related— to that node. Therefore, to downweigh the importance of paths through high-degree nodes, and serve our aim to include proximal nodes during the expansion phase, we significantly penalize the effect of high-degree nodes in the numerator using the termC2(u,v).
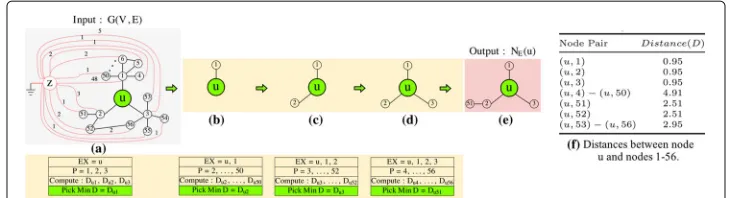
Example 1Figure 2 shows one example of generating NE(u) for an undirected, unweighted graph G, in which the original edges have conductance (weight) equal to 1, and the size of the expanded neighborhood is set to MAXE =5. The conductances for the new edges in G(red-dotted lines), computed via Eq.1, are shown in Fig.2a. Based on the dis-tances between u and every other node, which are defined by Eq.2and shown in Fig.2f, the neighborhood of u is expanded on a distance basis.
Phase B: neighborhood refinement - NR(u)
Fig. 2Neighborhood expansion example. (a) Represents the entire graph, where nodeuis the node to expand. The number on each red-dotted line refers to an edge conductance. (b, c, d) and (e) Indicate the expansion of nodeuby adding its nearest neighbors: 1, 2, 3, and 51, respectively, to form the expanded neighborhood of nodeu,NE(u). (f) Represents the computed distances between and its neighbors
In a nutshell, in this phase, we first link the nodes of theexpansionsubgraphNE(u) (except for node u) to the previously introduced grounded node z. Then, we create the refined neighborhood subgraph by adding end-to-end paths from node z to node u one at a time, in decreasing order of total current. The underlying intuition of the refinementphase is to maximize the current that reaches to nodezfrom the source node u. By maximizing the current, we maximize the information flow between the source node u and node z, which ultimately serves our goal of including proximal nodes to the source nodeu in itsNR(u). The process stops when the maximum predetermined refinedsubgraph size,|NR(u)| = MAXR, is reached. We discuss the choice ofMAXRin “Experiments” section. Each time a path is added to therefinedsubgraph, only the nodes that are not already included in the subgraph are added. We use dynamic programming to implement ourrefinementprocess, which is like a depth first search (DFS) approach with a slight modification.
To that end, we need to calculate the currentIflows between any pair of neighbors in theexpanded subgraph. In our context,I indicates the meta-data or network flow. We compute the currentIflow from source nodesto target nodetusing Ohm’s law:
I(s,t)=C(s,t)·[V(s)−V(t)] (3)
where theV(s) >V(t)are the voltages ofsandt, satisfying thedownhill constraint (oth-erwise, there would be current flows in the opposite direction). In order to guarantee this satisfaction, we need to sort the subgraph’s nodes in a descending order, based on their calculated voltage values, before we start current computations. The voltage of a node s∈Vis defined as:
V(s)=
⎧ ⎪ ⎪ ⎨ ⎪ ⎪ ⎩
v∈N(s)V(v)·C(s,v)
vC(s,v) , ∀nodess=u,z.
1, s=u.
0, s=z.
(4)
whereC(s,v)is the conductance or weight of the edge between nodessandv, as defined in Eq.1.
(a) (b) (c) (d) (f)
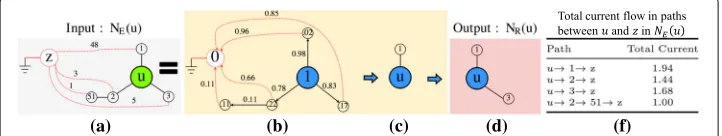
Fig. 3Neighborhood refinement example. (a) Represents the expanded neighborhood of nodeu,NE(u).
The number on each red-dotted line refers to an edge conductance. (b) Indicates the nodes’ voltages (the numbers shown inside nodes) and currents flow through edges (reveal on the red-dotted lines)
computations. (c) and (d) Indicate the refinement of nodeuby adding the neighbors: node 1 and 3 that maximizes the current flows from nodeuto nodezto form the refined neighborhood of nodeu,NR(u). (f)
Refers to the computation of total current flows through each possible path between nodesuandz
the current flow of each edge connecting nodes in the expanded neighborhood NE(u)is computed using Eq.3such that the ‘downhill constraint’ is satisfied (current flowing from high to low voltage), as shown over the red-dotted edges in (b). Given the current values, we enumerate all possible paths between nodes u and z, and give their total current flows in (f ). The paths are then added in descending order of total current into NR(u)until the stopping criterion is satisfied. In (c), we show the first such path. Finally, (d) gives the final neighborhood for MAXR=3.
Remarks
(1) Need for SE Subgraphs.The notion of SE subgraphs is beneficial in our setting, since they allow us to: (1) Better control the search space, as we robustly generate node neigh-borhoods on distance and current bases without limiting ourselves toK-hop neighbors; (2) Benefit from the actual flow, meta-data, that is being neglected by state-of-the-art methods; (3) Exploit the strength of weak ties; (4) Avoid introducing randomness caused by random/biased walks; (5) Address the issue of high-degree nodes, that is, a node with a high-degree distribution has a low chance to be included in the SE subgraph, as a pair of nodes might be incidentally connected through a high-degree node; and (6) Better handle non-adjacent nodes that are ubiquitous in real-world large-scale graphs.
(2) SURREAL neighborhood vs. context in baseline methods.Unlike existing rep-resentation learning methods: (1) We preserve the local and global structure of network by accounting for the immediate neighbors and neighbors at increasing distances of the source nodeuto identify its neighborhood; (2) We generate neighborhoods on distance and network flow bases; (3) We address the issue of high-node degree distribution; (4) We concurrently identify neighborhoods while maximizing proximity among non-adjacent nodes, which are abundant in real-world networks; and (5) We design our algorithm such that it yields consistent stable representations that suite single and multi-graph problems.
nodes; and (3) The extremely large number of subgraphs (equal to the number of nodes |V| =n) that need to be processed, to ultimately generate node neighborhoods.
(4) Computational complexity.The overall computational complexity of SURREAL is O(V2).
Step 2: node representation vector update
After identifying node neighborhoods in a graph, we aim to learn node representa-tions via the standard SkipGram model (Mikolov et al.2013). However, since SURREAL yields completely deterministic representations, we avoid the randomness implied by the SkipGram model by using the same random seed every time we employ it. The SkipGram objective maximizes the log-probability of observing the neighborhood generated during the neighborhood definition step, given each node’s feature representation:
max f
u∈V
log(Pr(NR(u)|f(u)), (5)
whereNR(u)is the refined neighborhood of nodeu, andf(u)is its feature representation. Following common practice, we make the maximum likelihood optimization tractable by making two assumptions:
Assumption 1 – Conditional independence.We assume that for nodeu, the likeli-hood of observing a neighboring node is completely independent of observing any other neighboring node, given nodeu’s feature representation,f(u):
Pr(NR(u)|f(u))= w∈NR(u)
Pr(w|f(u)) (6)
wherewrepresents any node that belongs to nodeu’s refined neighborhood.
Assumption 2 – Symmetry in feature space.The source nodeuand any nodewin its refined neighborhoodNR(u), have a symmetrical impact on each other in the continuous feature space. Therefore, the conditional probability,Pr(w | f(u)), is modeled using the softmax function:
Pr(w|f(u))= exp(f(w)·f(u)) v∈Vexp(f(v)·f(u))
(7)
Based on the above two assumptions, we can simplify the objective in Eq.5as follows:
max f
u∈V
−log
v∈V
exp(f(v)·f(u))+ w∈NR(u)
f(w)·f(u)
(8)
We note that performing such calculations for each node in large-scale graphs is com-putationally expensive. Therefore, we approximate the function using negative sampling (Mikolov et al.2013). We optimize the objective shown in Eq.8using stochastic gradient descent.
Experiments
In this section, we aim to answer the following questions:
Table 2A brief description of evaluation datasets
Dataset # Nodes # Edges # Labels Network Type
PPI (Grover and Leskovec2016) 3,890 76,584 50 Biological Wikipedia (Grover and Leskovec2016) 4,777 184,812 40 Language BlogCatalog (Grover and Leskovec2016) 10,312 333,983 39 Social
CiteSeer (Tang et al.2015) 3,312 4,660 6 Citation
Flickr (Mislove et al.2007) 80,513 5,899,882 195 Social Youtube (Mislove et al.2007) 1,138,499 2,990,443 47 Social
Before we answer these questions, we provide an overview of the datasets, and the baseline representation learning algorithms that we use in our evaluation.
Datasets. To showcase the generalization capability of SURREAL over distinct domains, we use a variety of datasets, which we briefly describe in Table2.
Baseline Algorithms.We compare SURREAL with three state-of-the-art baselines: DeepWalk(Perozzi et al.2014), node2vec(Grover and Leskovec2016), andWalklets (Perozzi et al.2016). The reason why we choose these state-of-the-art methods is the ran-dom way they adopt for neighborhood definition using ranran-dom walks. On the contrary, in SURREAL, we follow a completely deterministic manner, which makes our method applicable for single and multi-graph problems. For all of the methods, we set the number of walks per node to 10, walk length to 80, the neighborhood size to 10, and number of dimensions of the feature representationd=128. For node2vec, we set the return param-eterp= 1, and the in-out parameterq = 1, in order to capture the homophily, and the structural equivalence connectivity patterns, respectively. For Walklets, we set the feature representation scale,S=2, which captures the relationships captured at scale 2.
Experimental Setup.For SURREAL parameter settings, we set the expansion neigh-borhood subgraph size|NE(u)| = 1200. In order to compare with the baseline methods, we set the refinement neighborhood subgraph size, |NR(u)| = 800, and the number of dimensions of the feature representation,d = 128, in line with the values used for DeepWalk, node2vec, and Walklets.
Q1. Multi-label classification
Setup.Multi-label classification is a single-graph canonical task, where each node in a graph is assigned a single or multiple labels from a finite setL. We input the learned node representations to a one-vs-rest logistic regression classifier with L2 regularization. We repeat our experiments 10 times and report the mean Micro-F1 score results. We omit the
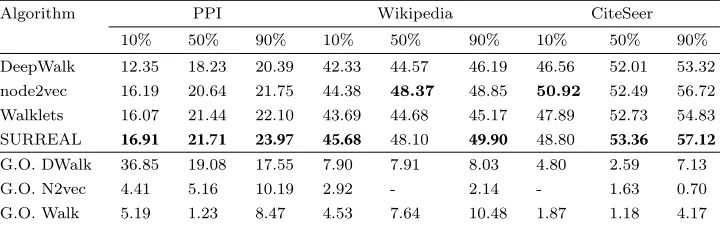
Table 3Micro-F1 scores for multi-label classification on PPI, Wikipedia, and CiteSeer datasets
Algorithm PPI Wikipedia CiteSeer
10% 50% 90% 10% 50% 90% 10% 50% 90%
DeepWalk 12.35 18.23 20.39 42.33 44.57 46.19 46.56 52.01 53.32
node2vec 16.19 20.64 21.75 44.38 48.37 48.85 50.92 52.49 56.72 Walklets 16.07 21.44 22.10 43.69 44.68 45.17 47.89 52.73 54.83 SURREAL 16.91 21.71 23.97 45.68 48.10 49.90 48.80 53.36 57.12
G.O. DWalk 36.85 19.08 17.55 7.90 7.91 8.03 4.80 2.59 7.13
G.O. N2vec 4.41 5.16 10.19 2.92 - 2.14 - 1.63 0.70
G.O. Walk 5.19 1.23 8.47 4.53 7.64 10.48 1.87 1.18 4.17
Table 4Micro-F1 scores for multi-label classification on BlogCatalog, Flickr, and Youtube datasets
Algorithm BlogCatalog Flickr Youtube
10% 50% 90% 10% 50% 90% 10% 50% 90%
DeepWalk 30.12 34.28 34.83 37.70 39.62 42.36 40.62 42.09 43.77 node2vec 34.53 36.94 37.99 38.90 41.39 43.91 41.53 43.12 44.45 Walklets 26.90 29.09 30.41 38.32 40.58 42.62 41.15 42.97 43.89 SURREAL 31.02 34.85 36.42 38.98 42.31 44.26 41.94 43.76 45.26
G.O. DWalk 3.00 1.63 4.55 3.40 6.79 4.49 3.25 3.97 3.40
G.O. N2vec - - - 0.21 2.22 0.80 0.10 1.48 1.82
G.O. Walk 15.27 19.80 19.75 1.72 4.26 3.85 1.92 1.84 3.12
Bolded numbers represent the best performance. By “G.O.” we denote “gain over”
results of other evaluation metrics—i.e., Macro-F1 score, because they follow the exact same trend. It is worth mentioning that multi-label classification is a challenging task, especially when the finite set of labelsLis large, or the fraction of labeled vertices is small (Rossi et al.2017).
Results.In Tables3and4, we demonstrate the performance of SURREAL algorithm and compare it to the three representation learning state-of-the-art methods. Our results are statistically significant with ap-value< 0.02. Overall, SURREAL outperforms or is competitive with the baseline methods, while also having the benefit of generalizing to the multi-network problems that the other methods fail to address. Below we discuss the experimental results by dataset.
PPI:It is remarkable that using various percentages of labeled nodes, SURREAL out-performs all the baselines. For instance, SURREAL is more effective than DeepWalk by 36.85% when the labeled nodes are sparse (10%), 19.08% for 50% of labeled nodes, and 17.55% when the percentage of labeled nodes is 90%.
Wikipedia:We observe that SURREAL outperforms the three baseline algorithms by up to 10.48% when using 90% of labeled nodes. In the only case where SURREAL does not beat node2vec, it is ranked second.
BlogCatalog:We observe that SURREAL has a comparable or better performance than DeepWalk and Walklets for various percentages of labeled nodes. Specifically, it outper-forms DeepWalk by up to 4.55% and Walklets by up to 19.75%, when the percentage of labeled nodes is 90%. For more labeled nodes, SURREAL achieves similar performance to node2vec.
CiteSeer:Similar to Wikipedia, SURREAL outperforms the state-of-the-art algorithms, and achieves a maximum gain of 7.13% with 90% of labeled nodes.
Flickr:We perceive that SURREAL outperforms the other three baselines by up to 6.79%, when using 50% of labeled nodes.
Youtube:We observe that SURREAL outperforms baseline methods, and achieves a maximum gain of 3.97% with 50% of labeled nodes.
of node2vec are slightly more capable in preserving the homophily, and the structural equivalence connectivity patterns in BlogCatalog network.
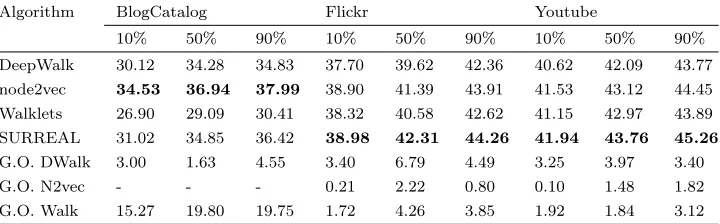
Q2. Representation learning stability
Setup.Surveying the existing node representation learning methods, we perceive that the tasks for which such algorithms are being evaluated on are limited to single-graph related tasks—i.e., prediction, recommendation, node classification, and visualization. Since many tasks involve multiple networks (e.g., graph similarity (Koutra et al.2013), graph alignment (Bayati et al. 2009), temporal graph anomaly detection (Koutra et al. 2013), brain network analysis for a group of subjects (Fallani et al.2014)), we seek to examine the applicability of representations learning approaches to multi-network set-tings. Heimann and Koutra Heimann and Koutra (2017) states that existing embedding algorithms are inappropriate for multi-graph problems, and attributes this to the fact that different runs of any method yield different representations every time the technique is run even if the same dataset is used. To that end, SURREAL is fully deterministic, with the goal of achieving stable and robust outcomes. We evaluate SURREAL’s stability by verifying the similarity of the learned vectors across different independent runs of the methods.
Results.Figure4shows the embeddings of two different runs of each approach against each other for a randomly selected set of nodes. Ford = 128, we visualize the results for three randomly selected dimensions of node2vec, DeepWalk, and Walklets. To avoid drawing a biased conclusion, we repeat the same experiment multiple times using differ-ent sets of randomly selected dimensions for the three baseline methods and the same observation holds. For SURREAL, we intentionally choose the same three dimensions randomly selected for each of the baseline methods. In the interest of space, we only show the visualization results of SURREAL using the same three dimensions (39,55,111) used for Walklets method. The results are equivalent for all the dimensions. If all points fall on (or close to) the diagonal, this indicates stability, which is a desirable attribute of a robust graph embedding. Figure4a–c show that, as expected node2vec, DeepWalk, and Walklets, suffer from significant variation across runs. To the contrary, Fig.4d shows that SURREAL obtain perfectly consistent embeddings across runs, and thus it is robust.
Q3. Parameter sensitivity
For sensitivity analysis, we use the Wikipedia dataset with 50% labeled nodes. We perform the following three experiments:
Size of the expansion neighborhood subgraph |NE(u)|. First; we demonstrate the impact of varying the size of the expanded neighborhood,|NE(u)|, in a multi-label classi-fication problem. Therefore, we run SURREAL by varying the size ofNE(u)from 600 to 1800 nodes in 200 increments. We limit the size of the refined neighborhood,|NR(u)| = 400. Figure5a shows the Micro-F1 score results. We observe that by increasing the size of NE(u), the corresponding Micro-F1 score increases up to a certain limit (|NE(u)| =1000), while it starts to decrease afterwards. This can be attributed to the fact that enlarging the NE(u)to more than 1000 introduces noise to the generated neighborhood, which ultimately compromises the performance.
(a)
(b)
(c)
(d)
(a) (b) (c)
Fig. 5Performance sensitivity analysis of SURREAL. (a) Expansion process for|NE(u)| ≥ |NR(u)| =400. By
increasing the size ofNE(u), the corresponding Micro-F1 score decreases (b) Refinement process for
|NR(u)| ≤ |NE(u)| =1200. By increasing the size ofNR(u), the corresponding Micro-F1 score increases (c)
Varylogd2from 4–9. Micro-F1 score increases up tologd2=7, and then it starts to decrease
the refined neighborhood,|NR(u)|, in a multi-label classification problem. For that, we run SURREAL, while varying the size of|NR(u)|from 200 to 1200 nodes in 200 incre-ments. Figure5b shows the Micro-F1 results. We observe that increasing the |NR(u)| is accompanied by an increase in the Micro-F1 score. This is rooted in the fact that enlarging the|NR(u)|includes more useful information in the refined neighborhoods, which SkipGram model (Mikolov et al.2013) leverages to learn and update the node representations.
Number of dimensionsd. Fixing the sizes of the expanded subgraph,|NE(u)| =1200, and the refined subgraph,|NR(u)| =800, we demonstrate the impact of varying the rep-resentation number of dimensions,d, in a multi-label classification problem. For that, we run SURREAL, while varying log2dfrom 4 to 9. Figure5c shows the Micro-F1 results.
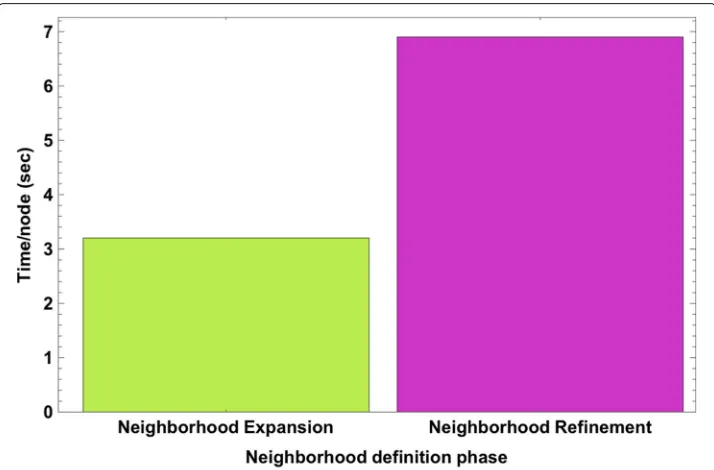
Fig. 6Runtime analysis of SURREAL’s neighborhood expansion and refinement phases, per node, of Wikipedia dataset. The|NE(u)| =1, 200 and|NR(u)=800|. The refinement process represents a bottleneck
We note that the Micro-F1 score constantly increases by increasing log2dup to 7, which corresponds tod = 128, while it starts to drop afterwards. We root this in the fact that using higher number of dimensions could introduce unrelated dimensions to the representation space, which eventually impacts the performance.
Runtime analysis
To test for scalability, we run SURREAL’s neighborhood definition step two phases: (1) Neighborhood expansion; and (2) Neighborhood refinement, and the corresponding run-time per node is reported (Fig.6). For runtime analysis, we set the expanded subgraph size|NE(u)| = 1, 200, the refinement subgraph size|NR(u)| = 800, and the representa-tion dimensionalityd=128. We observe that in order to expand and refine a single node, SURREAL takes 3.2 and 6.9 seconds, respectively. Apparently, the refinement neigh-borhood phase represents a bottleneck that renders SURREAL less efficient. Therefore, SURREAL is optimized as shown in “SURREAL’s optimization” section.
SURREAL’s optimization
In order to speedup SURREAL, the concept of graph summarization (Liu et al. 2018), where SURREAL can more efficiently handle large-scale graphs, is used. The abundance use of summarization concept is attributed to its capability of preserving and identi-fying the network structure and the meaning in data. Therefore, a compression-based summarization method (Stanley et al. 2018) is employed to summarize the networks utilized to evaluate the SURREAL method. This technique operates on a static and homogeneous—one entity and one link type—input graph. Further, it is defined as a grouping or aggregation-based method, because it employs a clustering technique to split a given graph G into multiple clusters, which afterward, map each densely-connected cluster into a supernode. The resultant summary graph is: (1) A supergraph that comprises supernodes and superedges connecting the supernodes together; (2) Flat, as the original nodes are simply grouped into several supernodes, on the same level of abstraction; and (3) Non-overlapping, where each node in the original graph is assigned to a single supernode in the summary graph. The problem of graph summarization is defined as follows:
Fig. 7SURREAL’s Performance with respect to various numbers of supernodes of supergraph summary method for Wekipedia dataset. No significant growth or drop in performance while increasing the number of supernodes
with the robustness nature of SURREAL; and (6) It is categorized as a network pre-processing compression-based technique, where the entire set of nodes exists in the original graph is included in the summary graph, and agglomerated into supernodes.
As the number of supernodes is a user-defined parameter in (Stanley et al.2018), we perform an experiment to report the SURREAL’s performance with respect to different
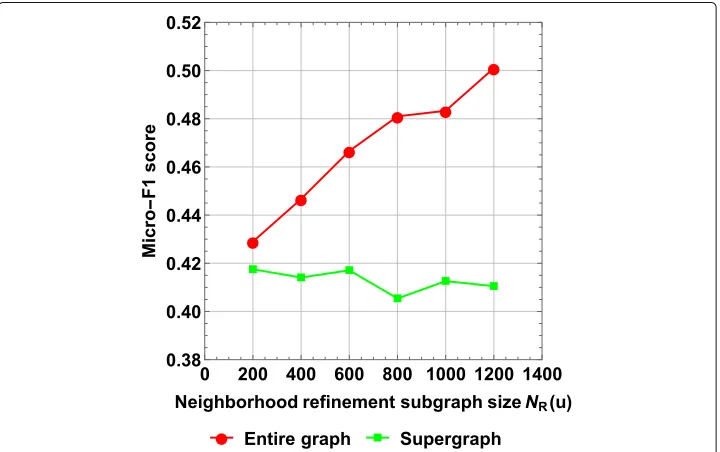
Fig. 8Performance comparison of SURREAL using two input graphs: entire graph and supergraph. The experiment is conducted using Wikipedia dataset. The|NR(u)|is varied from 200 to 1,200, while
|NE(u)| =1, 200 andd=128. The performance degrades when using the supergraph instead of entire
Fig. 9Runtime analysis for different refinement subgraph sizes when using supergraph as an input graph to SURREAL. The|NR(u)|is varied from 200 to 1,200, while|NE(u)|anddare set to 1,200 and 128, respectively
numbers of supernodes. The average Micro-F1 score is reported for Wikipedia dataset by altering the number of supernodes from 1200 to 2400 in 200 increments. Figure7shows that there is no significant increase or drop in performance when increasing the num-ber of supernodes. Therefore, having 1,200 supernodes can optimize SURREAL, since setting the number of supernodes similar to the expanded subgraph size |NE(u)| will tremendously diminish the runtime of the expansion phase.
Due to the performance-efficiency trade-off, we perform an experiment using two input graphs: (1) The entire graph; and (2) The supergraph with 1,200 supernodes. We feed the input graph to SURREAL and report the average Micro-F1 score. We use Wikipedia dataset. We vary|NR(u)|from 200 to 1,200, while setting|NE(u)| = 1, 200 andd= 128.
Figure8shows that: (1) Increasing the|NR(u)|augments the difference in performance between the two input graphs, therefore, no significant difference is captured when using small values of |NR(u)|; (2) There is a drop in performance when using a supergraph (green line) instead of the entire graph (red line) as an input graph, which confirms the performance-efficiency trade-off; and (3) The performance is more consistent when using the supergraph as an input graph.
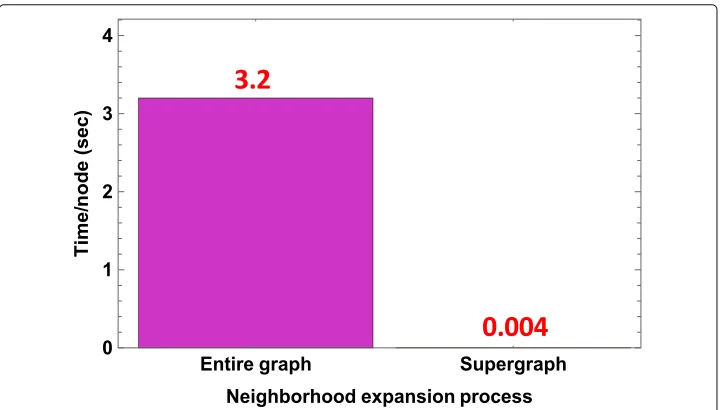
As no significant change in performance captured when when using the supergraph and varying the refinement neighborhood subgraph size|NR(u)|, we perform an experiment and report the runtime using supergraph as an input graph. We alter|NR(u)|from 200 to 1,200, while setting|NE(u)| =1, 200 andd=128. Figure9shows that enlarging|NR(u)| is accompanied with a corresponding increase in runtime. Similar to observing the run-time of various refinement neighborhood subgraph sizes, we conduct another experiment to capture the expansion process runtime by setting|NE(u)| = 1, 200,|NR(u)| = 800, andd= 128. Figure10shows that when feeding the entire graph to SURREAL, it takes 3.2 s to expand a single node, while 0.0004 second when feeding a supergraph with 1,200 supernodes. That is, expanding a node that belongs to a supergraph is much faster than expanding a node in a full graph. Therefore, Figs.9and10confirm that although accom-panied with a modest drop in performance, leveraging graph summarization concept greatly impacts SURREAL’s efficiency.
Conclusion
We propose a novel and stable representation learning algorithm; SURREAL, using SE subgraphs. In contrast to representation learning baseline algorithms, SURREAL gener-ates entirely deterministic representations, which makes it more appealing for single- and multi-graph problems. We empirically demonstrate SURREAL’s efficacy and stability over state-of-the-art approaches. Experiments show that SURREAL is more or as effective as baselines, and is completely stable. As SURREAL is less scalable comparing to baseline techniques, we optimize SURREAL using the concept of graph summarization, where a compression-based method is employed. In our future work, we will address the inter-pretability aspect that is not well-examined in the representation learning literature. We will also address the issue of embedding update, especially for a recently-joined node that has no evident connections. This problem is very related to the “cold-start” problem in the recommendation systems, where a new user joins the system and we seek external infor-mation for this user, in order to properly compute his profile. Similarly, we will explore different forms of external context and meta-data for the recently-joined nodes, which can help us address connection sparsity.
Acknowledgements
Not applicable.
Authors’ contributions
SA proposed, implemented, and evaluated the method. DK, EP, and SL improved the proposed method, suggested some of the evaluation experiments, and reviewed the manuscript. All authors read and approved the final manuscript.
Funding
Not applicable.
Availability of data and materials
Competing interests
The authors declare that they have no competing interests.
Author details
1Systems Science and Industrial Engineering Department, Binghamton University, 4400 Vestal Pkwy E, 13902 Binghamton, NY, United States.2Computer Science and Engineering Department, University of Michigan, 500 S State St, 48109 Ann Arbor, United States.3Computer Science and Engineering Department, University of California, Riverside, 446 N Campus Dr, 92507 Riverside, United States.
Received: 13 March 2019 Accepted: 19 June 2019
References
Akoglu L, Chau DH, Vreeken J, Tatti N, Tong H, Faloutsos C (2013) Mining Connection Pathways for Marked Nodes in Large Graphs. In: Proceedings of the 2013 SIAM International Conference on Data Mining. Society for Industrial and Applied Mathematics, Austin. pp 37–45
Bayati M, Gerritsen M, Gleich DF, Saberi A, Wang Y (2009) Algorithms for large, sparse network alignment problems. In: Data Mining, 2009. ICDM’09. Ninth IEEE International Conference On. IEEE, Miami. pp 705–710
Bengio Y, Courville A, Vincent P (2013) Representation learning: A review and new perspectives. IEEE Trans. Pattern Anal. Mach Intell 35(8):1798–1828
Bhagat S, Cormode G, Muthukrishnan S (2011) Node classification in social networks. In: Social Network Data Analytics. Springer, Boston. pp 115–148
Chen J, Ma T, Xiao C (2018) Fastgcn: fast learning with graph convolutional networks via importance sampling. arXiv preprint. arXiv:1801.10247
Fallani FDV, Richiardi J, Chavez M, Achard S (2014) Graph analysis of functional brain networks: practical issues in translational neuroscience. Phil Trans R Soc B 369(1653):20130521
Faloutsos C, McCurley KS, Tomkins A (2004) Fast discovery of connection subgraphs. In: Proceedings of the Tenth ACM SIGKDD International Conference on Knowledge Discovery and Data Mining. ACM, Seattle. pp 118–127
Goyal P, Ferrara E (2017) Graph embedding techniques, applications, and performance: A survey. arXiv preprint. arXiv:1705.02801
Grover A, Leskovec J (2016) node2vec: Scalable feature learning for networks. In: Proceedings of the 22nd ACM SIGKDD International Conference on Knowledge Discovery and Data Mining. ACM, San Francisco. pp 855–864
Hamilton W, Ying Z, Leskovec J (2017) Inductive representation learning on large graphs. In: Advances in Neural Information Processing Systems. Neural Information Processing Systems, Long Beach. pp 1024–1034
Heimann M, Koutra D (2017) On generalizing neural node embedding methods to multi-network problems. In: ACM SIGKDD International Worshop on Mining and Learning with Graphs (MLG). ACM, Halifax, Nova Scotia
Heimann M, Shen H, Koutra D (2018) Node Representation Learning for Multiple Networks: The Case of Graph Alignment. ArXiv e-prints.1802.06257
Koutra D, Vogelstein JT, Faloutsos C (2013) Deltacon: A principled massive-graph similarity function. In: Proceedings of the 2013 SIAM International Conference on Data Mining. SIAM, Austin. pp 162–170
Le Q, Mikolov T (2014) Distributed representations of sentences and documents. In: Proceedings of the 31st International Conference on Machine Learning (ICML-14). JMLR: W&CP, Beijing. pp 1188–1196
Liben-Nowell D, Kleinberg J (2007) The link-prediction problem for social networks. J Assoc. Inf. Sci. Technol 58(7):1019–1031
Liu Y, Safavi T, Dighe A, Koutra D (2018) Graph summarization methods and applications: A survey. ACM Comput Surv (CSUR) 51(3):62
Mikolov T, Chen K, Corrado G, Dean J (2013) Efficient estimation of word representations in vector space. arXiv preprint. arXiv:1301.3781
Mikolov T, Sutskever I, Chen K, Corrado GS, Dean J (2013) Distributed representations of words and phrases and their compositionality. In: Advances in Neural Information Processing Systems. pp 3111–3119
Mislove A, Marcon M, Gummadi KP, Druschel P, Bhattacharjee B (2007) Measurement and Analysis of Online Social Networks. In: Proceedings of the 5th ACM/Usenix Internet Measurement Conference (IMC’07), San Diego
Perozzi B, Al-Rfou R, Skiena S (2014) Deepwalk: Online learning of social representations. In: Proceedings of the 20th ACM SIGKDD International Conference on Knowledge Discovery and Data Mining. ACM. pp 701–710
Perozzi B, Kulkarni V, Skiena S (2016) Walklets: Multiscale graph embeddings for interpretable network classification. arXiv preprint. arXiv:1605.02115. New York
Rodrigues Jr. JF, Tong H, Traina AJM, Faloutsos C, Leskovec J (2006) Gmine: A system for scalable, interactive graph visualization and mining. In: Proceedings of the 32Nd International Conference on Very Large Data Bases. VLDB ’06. VLDB Endowment, Seoul. pp 1195–1198
Rossi RA, Zhou R, Ahmed NK (2017) Deep feature learning for graphs. arXiv preprint. arXiv:1704.08829 Stanley N, Kwitt R, Niethammer M, Mucha PJ (2018) Compressing networks with super nodes. Sci Rep 8(1):10892 Tang J, Qu M, Wang M, Zhang M, Yan J, Mei Q (2015) Line: Large-scale information network embedding. In: Proceedings
of the 24th International Conference on World Wide Web. ACM, Florence. pp 1067–1077
Tong H, Faloutsos C (2006) Center-piece subgraphs: Problem definition and fast solutions. In: Proceedings of the 12th ACM SIGKDD International Conference on Knowledge Discovery and Data Mining. ACM, Philadelphia. pp 404–413 Yu X, Ren X, Sun Y, Gu Q, Sturt B, Khandelwal U, Norick B, Han J (2014) Personalized entity recommendation: A
heterogeneous information network approach. In: Proceedings of the 7th ACM International Conference on Web Search and Data Mining. ACM, New York. pp 283–292
Zhang D, Yin J, Zhu X, Zhang C (2017) Network representation learning: A survey. arXiv preprint. arXiv:1801.05852
Publisher’s Note