JETIR1609013 Journal of Emerging Technologies and Innovative Research (JETIR) www.jetir.org 69
PUSHOVER ANALYSIS OF MULTISTOREY
BUILDING FRAME USING SAP2000
1
Sneha P. Meshram,
2Mayur Ghumde
1Final Year M-Tech Student, 2Professor of BIT College 1Department of Civil Engineering,
1Ballarpur Institute of Technology, Ballarshah, India
Abstract— Pushover analysis is a static, nonlinear procedure. Pushover analysis is one of the most-used nonlinear static procedures for the seismic assessment of structures, due to its simplicity, efficiency in modeling and low computational time. It is necessary to design a structure to perform well under seismic loads. The performance of a structural system can be evaluated resorting to non-linear static analysis. In this paper building frames are designed for ductility of structure. Ductility is assured by considering Special moment Resisting Frames and its performance is compared with nominally ductile frame i.e. with Ordinary moment Resisting Frames.
Index Terms— Pushover Analysis, Non-linear static Analysis, Moment Resisting Frames.
I. INTRODUCTION 1.1 GENERAL
Static pushover analysis which shows nonlinear static behavior of buildings subjected to lateral loads has been used in structural engineering due to simplicity. For the stability of any building, ductility plays an important role. This ductility is imparted in the structure by using special moment resisting frames. Special moment resisting Frames vary from ordinary Moment Resisting Frames by Response Reduction factor. For ordinary frames R=3 and for special frames R=5 as per IS 13920 (2000). All building Frames are designed with Infill Wall weak and strong with varying height and support conditions.
1.2 HISTORY AND CONCRETE CONFINEMENT :
Column shear failure has been identified as the frequently mentioned cause of concrete structure failure and downfall during the past earthquakes. In the earthquake resistant design of reinforced concrete sections of buildings, the plastic hinge regions should be strictly detailed for ductility in order to make sure that severe ground shaking during earthquakes will not cause collapse of the structure. The most important design consideration for ductility in plastic hinge regions of reinforced concrete columns is the provision of adequate transverse reinforcement in the form of spirals or circular hoops or of rectangular arrangements of steel. The cover concrete will be unconfined and will eventually become ineffective after the compressive strength is attained, but the core concrete will continue to carry stress at high strains. Transverse reinforcements which are mainly provided for resisting shear force, helps in confining the core concrete and prevents buckling of the longitudinal bars. The core concrete which remains confined by the transverse reinforcement is not permitted to dilate in the transverse direction, thereby helps in the enhancement of its peak strength and ultimate strain capacities. Thus confinement of concrete by suitable arrangements of transverse reinforcement results in a significant increase in both the strength and the ductility of compressed concrete. Confining reinforcements are mainly provided at the column and beam ends and beam-column joints. The hoops should enclose the whole cross section excluding the cover concrete and must be closed by 135° hooks embedded in the core concrete, this prevents opening of the hoops if spelling of the cover concrete occurs. Seismic codes recommend the use of closely spaced transverse reinforcement in-order to confine the concrete and prevent buckling of longitudinal reinforcement.
Ductile response demands that elements yield in flexure and shear failure has to be prevented. Shear failure in columns, is relatively brittle and can lead to immediate loss of lateral strength and stiffness. To attain a ductile nature, special design and detailing of the RC sections is required. IS 13920 recommends certain standards for the provision of confining reinforcements for beams and columns. The code suggests that the primary step is to identify the regions of yielding, design those sections for adequate moment capacity, and then estimate design shears founded on equilibrium supposing the flexural yielding sections improve credible moment strengths. The probable moment capacity is considered using methods that give a higher estimate of the moment strength of the planned cross section. Transverse reinforcement provision are given in IS 13920-2002 of Indian code of practice.
1.3 SPECIAL AND ORDNARY MOMENT RESISTING FRAMES (SMRF AND OMRF):
According to Indian standards moment resisting frames are classified as Ordinary Moment Resisting Frames (OMRF) and Special Moment Resisting Frames (SMRF) with response reduction factors 3 and 5 respectively. Another main difference is the provision of ductile detailing according to IS 13920 as explained in Section 1.2 for the SMRF structures. The differences between these two are given in Table 1.1. Different international codes classify buildings in different ways which are elaborated in Section 2.2.
Table 1.1 Differences between SMR and OMRF
SMRF OMRF
It is a moment-resisting frame specially detailed to provide ductile behaviour and comply with the requirements given in IS 13920.
JETIR1609013 Journal of Emerging Technologies and Innovative Research (JETIR) www.jetir.org 70
R = 5 R = 3
Low design base shear. High design base shear.
It is safe to design a structure with ductile detailing.
It is not safe to design a structure without ductile detailing.
1.4 RESPONSE REDUCTION FACTOR (R):
It is the factor by which the actual base shear forces, that would be generated if the structure were to remain elastic during its response to the Design Basis Earthquake (DBE) shaking, shall be reduced to obtain the design lateral force (IS 1893 Part 1, 2002).This factor permits a designer to use a linear elastic force-based design while accounting for non-linear behavior and deformation limits.
Response reduction factor of 3 is used for OMRF and 5 for SMRF during the building design. In this project four different RC plain frames designed as both OMRF and SMRF is considered and its response reduction factors are calculated by using non-linear static analysis.
II. GENERAL DISCRIPTION OF PROJECT
The frames have been considered for 5 storeys, 7 storeys, 9 storeys and 11 storeys R.C building. The models have been prepared by varying the following parameters
1. No. of storeys, 2. type of support,
3. type of frame – with infill and 4. design of frame – OMRF/SMRF
III. RESULT
3.1 COMPARISION OF SMRF AND OMRF: INFILL FRAME, FIXED SUPPORT
CASE 1:- 7S8B WEAK INFILL FRAME - FIXED SUPPORT
The fig.1 shows the pushover curves of 7S8B weak infill frames designed as both SMRF and OMRF with fixed support conditions. Initially, in both the frames, base shear increases linearly with the roof displacement. The base shear strength and displacement of OMRF with infill is 30 % more than that of SMRF with infill.
CASE 2 :- 7S8B STRONG INFILL FRAME - FIXED SUPPORT
0 0.5 1 1.5 2 2.5
0 100 200 300 400 500
Sh
e
ar
F
x 10
3(k
N
)
Displacement D x 10-3 (m) F Vs D
7S8B-OMRF-I-W-F
7S8B-SMRF-I-W-F
0 2 4 6 8 10
0 100 200 300 400
Sh
e
ar
F
x 10
3(k
N
)
Displacement D x 10-3 (m)
F Vs D
7S8B-OMRF-I-S-F
JETIR1609013 Journal of Emerging Technologies and Innovative Research (JETIR) www.jetir.org 71 The fig.2 shows the pushover curves of 7S8B strong infill frames designed as both SMRF and OMRF with fixed support conditions. Both the curves are nearly same with base shear capacity of OMRF just being a little more then SMRF and the only other difference being the displacement of SMRF more than that of OMRF.
CASE 3:- 9S8B WEAK INFILL FRAME - FIXED SUPPORT
The fig. 3 shows the pushover curves of 9S8B weak infill frames designed as both SMRF and OMRF with fixed support conditions. Initially, in both the frames, base shear increases linearly with the roof displacement. The base shear strength and displacement of OMRF with infill is 30 % more than that of SMRF with infill.
CASE 4 :- 9S8B STRONG INFILL FRAME - FIXED SUPPORT
The fig.4 shows the pushover curves of 9S8B strong infill frames designed as both SMRF and OMRF with fixed support conditions. Both the curves are nearly same with small difference in base shear capacity and the only difference being the displacement of OMRF more than that of SMRF.
CASE 5 :- 11S8B WEAK INFILL FRAME - FIXED SUPPORT
The fig.5 shows the pushover curves of 11S8B weak infill frames designed as both SMRF and OMRF with fixed support conditions. Initially, in both the frames, base shear increases linearly with the roof displacement. The base shear strength of OMRF with infill is 40 % more than that of SMRF with infill.
0 0.5 1 1.5 2 2.5
0 100 200 300 400 500
Sh
e
ar
F
x 10
3(k
N
)
Displacement D x 10-3 (m) F Vs D
9S8B-OMRF-I-W-F
9S8B-SMRF-I-W-F
0 1 2 3 4 5 6 7
0 100 200 300 400
Sh
e
ar
F
x 10
3(k
N
)
Displacement D x 10-3 (m) F Vs D
9S8B-OMRF-I-S-F
9S8B-SMRF-I-S-F
0 0.5 1 1.5 2 2.5
0 100 200 300 400 500
Sh
e
ar
F
x 10
3(k
N
)
Displacement D x 10-3 (m)
F Vs D
11S8B-OMRF-I-W-F
JETIR1609013 Journal of Emerging Technologies and Innovative Research (JETIR) www.jetir.org 72 CASE 6 :- 11S8B STRONG INFILL FRAME - FIXED SUPPORT
The fig. 6 shows the pushover curves of 11S8B strong infill frames designed as both SMRF and OMRF with fixed support conditions. Both the curves are nearly same with small difference in base shear capacity and the only difference being the displacement of OMRF more than that of SMRF
3.2 COMPARISION OF INFILL FRAMES WITH VARYING HEIGHT
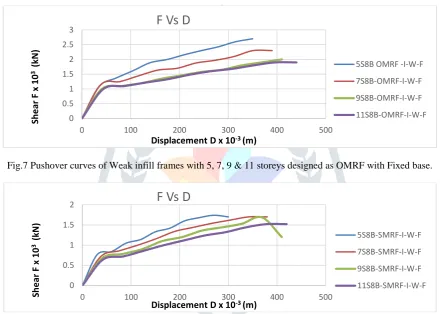
Fig.7 Pushover curves of Weak infill frames with 5, 7, 9 & 11 storeys designed as OMRF with Fixed base.
Fig.8. Pushover curves of Weak infill frames with 5, 7, 9 & 11 storeys designed as SMRF with Fixed base.
Fig. 9 Pushover curves of Strong infill frames with 5, 7, 9 & 11 storeys designed as OMRF with Fixed base.
0 0.5 1 1.5 2 2.5 3
0 100 200 300 400 500
Sh
e
ar
F
x 10
3(k
N
)
Displacement D x 10-3 (m)
F Vs D
5S8B OMRF -I-W-F
7S8B-OMRF-I-W-F
9S8B-OMRF-I-W-F
11S8B-OMRF-I-W-F
0 0.5 1 1.5 2
0 100 200 300 400 500
Sh
e
ar
F
x 10
3(k
N
)
Displacement D x 10-3 (m)
F Vs D
5S8B-SMRF-I-W-F
7S8B-SMRF-I-W-F
9S8B-SMRF-I-W-F
11S8B-SMRF-I-W-F
0 2 4 6 8 10
0 50 100 150 200 250 300 350
Sh
e
ar
F
x 10
3(k
N
)
Displacement D x 10-3 (m)
F Vs D
5S8B-OMRF-I-S-F
7S8B-OMRF-I-S-F
9S8B-OMRF-I-S-F
11S8B-OMRF-I-S-F 0
2 4 6 8
0 50 100 150 200 250 300
Sh
e
ar
F
x 10
3(k
N
)
Displacement D x 10-3 (m)
F Vs D
11S8B-OMRF-I-S-F
JETIR1609013 Journal of Emerging Technologies and Innovative Research (JETIR) www.jetir.org 73 Fig. 10 Pushover curves of Strong infill frames with 5, 7, 9 & 11 storeys designed as SMRF with Fixed base.
Above graphs indicate a reverse trend in which as the storey height increases the base shear capacity decreases. However, this trend is not observed in the bare frames. Hence, addition of infill makes the frames with infill with less storeysmore stiff. This trend is observed in non linear zone of the curves.
3.3 COMPARISION OF BARE FRAMES WITH WEAK AND STRONG INFILL FRAMES
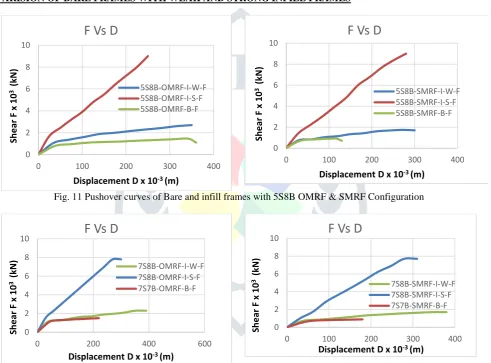
Fig. 11 Pushover curves of Bare and infill frames with 5S8B OMRF & SMRF Configuration
Fig.12 Pushover curves of Bare and infill frames with 7S8B OMRF & SMRF Configuration
Fig.13 Pushover curves of Bare and infill frames with 9S8B OMRF & SMRF Configuration
0 2 4 6 8 10
0 50 100 150 200 250 300 350
Sh e ar F x 10 3(k N )
Displacement D x 10-3 (m)
F Vs D
5S8B-SMRF-I-S-F 7S8B-SMRF-I-S-F 9S8B-SMRF-I-S-F 11S8B-SMRF-I-S-F 0 2 4 6 8 10
0 100 200 300 400
Sh e ar F x 10 3(k N )
Displacement D x 10-3 (m)
F Vs D
5S8B-OMRF-I-W-F 5S8B-OMRF-I-S-F 5S8B-OMRF-B-F 0 2 4 6 8 10
0 100 200 300 400
Sh e ar F x 10 3(k N )
Displacement D x 10-3 (m)
F Vs D
5S8B-SMRF-I-W-F 5S8B-SMRF-I-S-F 5S8B-SMRF-B-F 0 2 4 6 8 10
0 200 400 600
Sh e ar F x 10 3(k N )
Displacement D x 10-3 (m)
F Vs D
7S8B-OMRF-I-W-F 7S8B-OMRF-I-S-F 7S7B-OMRF-B-F 0 2 4 6 8 10
0 100 200 300 400
Sh e ar F x 10 3(k N )
Displacement D x 10-3 (m)
F Vs D
7S8B-SMRF-I-W-F 7S8B-SMRF-I-S-F 7S7B-SMRF-B-F 0 1 2 3 4 5 6 7
0 200 400 600
Sh e ar F x 10 3(k N )
Displacement D x 10-3 (m)
F Vs D
9S8B-OMRF-I-W-F 9S8B-OMRF-I-S-F 9S8B-OMRF-B-F 0 1 2 3 4 5 6
0 100 200 300 400 500
Sh e ar F x 10 3(k N )
Displacement D x 10-3 (m)
F Vs D
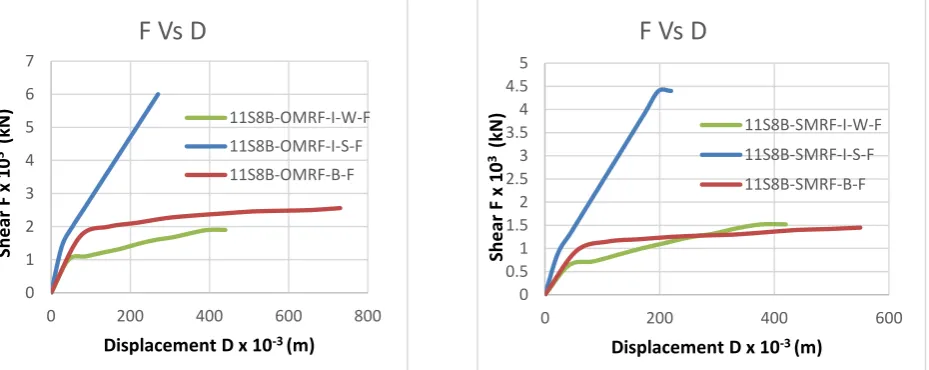
JETIR1609013 Journal of Emerging Technologies and Innovative Research (JETIR) www.jetir.org 74 Fig. 14 Pushover curves of Bare and infill frames with 11S8B OMRF & SMRF Configuration
From the above comparison, it can be observed that additional of infill in both OMRF and SMRF improves the performance of the frame. Also, presence of strong infill makes the frame much stronger than weak infill and bare frames.
IV. CONCLUSION
1. When bare frames with a particular frame configuration (OMRF & SMRF) are compared for varying support conditions, frames designed with fixed condition can attract heavy lateral forces thus they have higher base shear capacity as compared to those designed with hinged/pinned condition. The increase in the base shear capacity ranges from 30 % up to 250 % depending upon the storey height and type of frame.
2. On introduction of infill in the frames, a comparison for the design configuration – OMRF/SMRF leads to the conclusion that the performance of OMRF with weak infill is 30% more (better) than SMRF with weak infill. And in case of strong infill the difference observed is not much, thus the performance of OMRF is just better than SMRF.
3. The comparative study of particular type (OMRF & SMRF) with both strong and weak infill for varying number of storey indicate a reverse trend in which as the frame height (number of storey) increases the base shear capacity decreases. However, this trend is not observed in the bare frames. Hence, addition of infill makes the frames with infill with less storey more stiff. This trend is observed in non linear zone of the curves.
4. The introduction of infill definitely improves the performance of the frame. The improvement is observed precisely in the non linear zone. The gradient of the nonlinear zone is steepest (maximum) for the frames with strong infill. Also, not high variation is observed between frames with weak infill and bare frames with fixed support condition.
V. REFRENCES
[1] ATC 40, (1996), “Seismic Evaluation and Retrofit of Concrete Buildings”, Applied Technology Council, USA.
[2] Akas, B., Kara, F.I., and Tigsal, U..M. (2003), “Comparison of Pushover Analysis and Nonlinear Dynamic Time History on Low, Medium- and High -Rise steel frames”, Project No. 02-A-02-01-03, Scientific Research Project Fund, Gebze Institute of Technology.
[3] FEMA 356, (2000), “Prestandard and Commentary for the seismic Rehabilitation of Buildings”, American Society of Civil engineers, USA.
[4] FEMA 450, (2003), “ NEHRP Recommended Provisions for Seismic Regulations for New Buildings and Other Structures (Part 1: Provisions)”, Building Seismic Safety Council (BSSC), Washington D.C., USA
[5] IS 1893 Part1, (2000), “Indian Standard Criteria for Earthquake Resistant Design of Structures”, Bureau of Indian Standards, New Delhi.
[6] IS 456 (Fourth Revision), (2000), “Indian Standard Code for practice Plane reinforced Concrete for general building construction”, Bureau of Indian standard, New Delhi.
[7] IS 875 Part 1, 2, 3 and 4, (1987), “Indian Standard Code of practice for Design loads for buildings and structure”, Bureau of Indian Standards, New Delhi.
[8] SAP 2000 (Version 14.0),(2010), “Integrated software for Structural Analysis and Design”, Computers & Structures, Inc., Berkeley, California.
0 1 2 3 4 5 6 7
0 200 400 600 800
Sh
e
ar
F
x 10
3(k
N
)
Displacement D x 10-3 (m)
F Vs D
11S8B-OMRF-I-W-F 11S8B-OMRF-I-S-F 11S8B-OMRF-B-F
0 0.5 1 1.5 2 2.5 3 3.5 4 4.5 5
0 200 400 600
Sh
e
ar
F
x 10
3(k
N
)
Displacement D x 10-3 (m)