AN EMPIRICAL STUDY FOR AN IMPROVEMENT OF CELLULAR
NETWORK USING GENETIC ALGORITHM
Eman A. Ghenaw1 & Issmail M. Ellabib2
1.INTRODUCTION
The aim of planning and management in mobile cellular networks is to design, organize, and manage the cellular networks to reduce the cost of operation and meet the quality of service required by the subscribers. The efficiency of the network is influenced by the location management of mobile cellular networks. Location management deals with how to keep track of an active mobile station. Location registration (i.e., location update) and paging are the essential factors in the location management. Partition the network area into a set of Location Areas is the common strategy applied to increase the efficiency of the network [2]. In this strategy, each location area has one or more number of cells. The goal is to partition the network into a given number of location areas such that the total paging and location update cost is maintained at its minimum. In such partitioning approach, a balance between location update cost and paging cost is the main objective in order to enhance the performance of the network [2]. In particular, upon the arrival of a mobile-terminated call, the system tries to find the Mobile Terminal (MT) by searching for it among a set of Base Transceiver Stations (BTSs) over pre-assigned region. This search is called paging, and the set of cells in which a mobile is paged is called the Location Area (LA). At each LA boundary crossing, TMs in all cells update their new locations, and this is called location update (LU). Therefore, minimizing the cost of paging and location update depends on the number of cells assigned in each LA. Due to high mobility and increase of subscribers, most of recent mobile network systems, including the GSM system, are employing the zone based scheme [2]. In this scheme, the service area is divided into groups of cells forming LAs.
Finding the optimal number of cells assigned in each LA and finding number of location areas has motivated many researchers, as it is a difficult combinatorial optimization problem which is classified as an NP- hard problem [6]. Meta-heuristic approaches such as Simulated Annealing algorithm [7], Particle Swarm Optimization [8], and Ant Colony System [1] have addressed the LA planning problem for the zone based scheme. However, clustering of cells based on frequencies is not considered in these approaches. Due to a limited frequency bandwidth, the cells need to be clustered in terms of the frequencies pattern such as in Global System for Mobile communication (GSM) networks [5]. In particular, clustering constraint raised by limited frequency bandwidth should be taken into consideration in the LA planning. In this paper, the Genetic Algorithm is adapted to solve the LA planning problem for an existing network. The clustering constraint will be considered in this work along with other realistic constraints.
The rest of the paper is organized as follows: Section II provides problem formulation. Section III presents the adaptation of the genetic algorithm for the LA planning problem. Section IV provides a set of computational experiments for the performance evaluation and improvement of an existing network. Finally, some concluding remarks are provided in Section V.
2.PROBLEMFORMULATION
The GSM network is made primarily of Base Transceiver Stations (BTSs), Base Station Controllers (BSCs), and Mobile Service Switching Centre (MSCs). The service area is divided into a number of LAs and each LA consists of a number of BTSs, and each group of BTS is connected virtually together to form an LA. The problem arises from the trade-off between the location update and the paging costs, along with the consideration of the link cost which represents the distance between BTSs, BSCs, and MSCs. The challenge is to assign BTSs to BSCs, BSCs to MSCs, and BTSs to LAs considering that the total cost should be minimized and a set of realistic constraints must be satisfied.
1
Department of Computer Engineering, University of Tripoli, Tripoli-Libya
2
Department of Computer Engineering, University of Tripoli, Tripoli-Libya
International Journal of Latest Trends in Engineering and Technology
Vol.(9)Issue(2), pp.079-086
DOI: http://dx.doi.org/10.21172/1.92.14
e-ISSN:2278-621X
Abstract- The planning of location area in cellular networks has critical impact on the quality of service objectives. The goal of this planning is to partition the network into a given number of location areas such that paging and location update costs are minimized. This paper addresses the location area planning problem using Genetic Algorithm based approach for an existing cellular network. The approach is applied to an existing network layout with real data and realistic constrains. Potential improvement in the network layout is achieved in terms of the total cost and location update cost.
One of the important attributes in the cellular network is the size of LAs. The size comes from the number of cells in each LA, and this number may vary depending on the rate at which cells receive calls, and on the inter-cell traffic characteristics and number of users. In fact, the size of an LA can be optimized to create a balance between the LA update rate and the expected paging rate within an LA.
The objective to minimize the total network cost CNW can be represented by
link LU
P
NW
M
C
P
C
R
C
C
Min.
.
.
.
(1)Where, CP is the paging cost, CLU is the location update cost, and Clink is the link cost. M, P, and R are relative (i.e., weights)
factors.
The paging cost is caused by the network system when it tries to locate a user’s mobile terminal, during the location inquiry, and normally the number of paging transactions is directly related to the number of incoming calls. The task of calculating the paging cost is simple. It can be determined by counting the number of incoming calls in the selected LA and then multiply the value by the number of cells in the respective LA. The location update cost is corresponding to the cost involved with the location updates performed by mobile terminals in the network. The number of location updates is normally caused by the user movements in the network. The location update cost can be determined by summing up all users who enter an LA from other LAs. The link cost is representing the total cost of linking between the BTSs, BSCs, and MSCs. The geographical relationship (i.e., distance) between the BTSs and their connected to BSCs are considered in the cost of cabling so that the BTSs should be assigned to the neighboring BSCs rather than to far BSCs as well as in the BSCs and MSCs connections. Therefore, the challenge is to assign BTSs to BSCs, BSCs to MSCs, and BTSs to LAs such that the total cost should be minimized. However, these costs do not have comparable units. Therefore, it is difficult to reach a compromise. To compensate for this difficulty, previous researchers have adopted some assumptions for the relative values of these costs. For example, one unit cost for each event of paging equals ten unit costs for the events of registration. However, the cost of paging and updating in a network varies from cell to cell and from LA to LA. To reduce the difficulty of summing three incomparable costs, the paging cost is considered as a constraint, because the paging capacity is easier to quantify [1,7,8]. Thus, the objective can be formulated as follows.
link LU
NW
P
C
R
C
C
Min.
.
.
(2)Subject to a set of constraint such assignment and system capacity constraints as well as frequency constraint as will be discussed below. For more details on the problem formulation, the reader may refer to [8].
2.1 Frequency Constraint
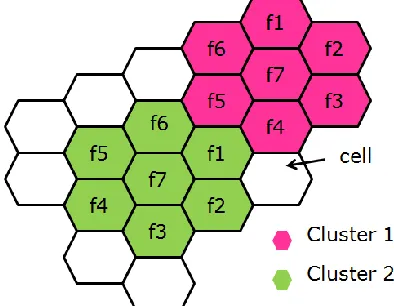
In mobile radio systems, one of the most important factors is the frequency spectrum. In order to make the best use of the bandwidth, the system is designed by means of the division of the service area into neighboring zones, or cells, which in theory have a hexagonal shape. Each cell has a BTS, which to avoid interference operates on a set of radio channels different from those of the adjacent cells. This division allows for the use of the same frequencies in nonadjacent cells. A group of cells that as a whole uses the entire radio spectrum available to the operator is referred to as a cluster (i.e., site) [5].
Since each cell is designed to use radio frequencies only within its boundaries, the same frequencies can be reused in other cells not far away without interference, in another site. The number of cells in each site must be determined for all the coverage area of an operator. Typical sites in GSM networks contain 3, 7, 9, 12 or 21 cells.
The number of cells in each site is very important. The smaller the number of cells per site is the bigger the number of channels per cell. The capacity of each cell will, therefore, increase. The reuse of frequencies enables a cellular system to handle a huge number of calls with a limited number of channels. A basic example of sites organization is shown in Figure 1. In this example, a reuse pattern of seven different frequencies (f1 to f7) is illustrated. These frequencies correspond to the beacon carrier of each cell.
As shown in Figure 1, a given carrier can be reused in two separate geographical areas, as long as these areas are far enough from each other to reduce the effect of interference. To handle this problem the cells need to be clustered in terms of the frequencies pattern. By using this technique, the area of coverage can be increased with a limited frequency bandwidth [5]. In particular, clustering in GSM networks is an important factor, and it should be taken into consideration in the GSM network planning. In this work, the constraint related to the clustering are included and considered in the design of LAs. This constraint can be described and handled as cells belonging to the same site must be connected to the same BSC, and cells belong to a particular site should all reside in the same LA. This constraint has taken place in the three proposed assignment types introduced in the next section.
3.GENETICALGORITHMBASEDAPPROACH
The Genetic Algorithm (GA) is a population based search algorithm. GA is robust search technique based on natural selection and genetic production mechanism. The GA is inspired by Darwin theory and its first model is introduced by John Holland [3]. In this algorithm, a group of individuals is called a population and each individual represents a potential solution for a given problem. The basic idea is that the genetic pool (the whole set of genes in a population) of a given population contains solutions or solutions better than the individuals in the population currently represented. With the exploration of genetic changes and the process of selection, the population of a GA is expected to evolve towards fitter solutions. For more details for the GA algorithm, the reader may refer to [3,4].
The adaptation of GA algorithm to solve the LA planning problem is critical due to the constraints and the feasibility preservation in assigning cells to location area. In this work, the feasible solution of the problem is represented by different types of assignments as described below.
3.1 Problem representation
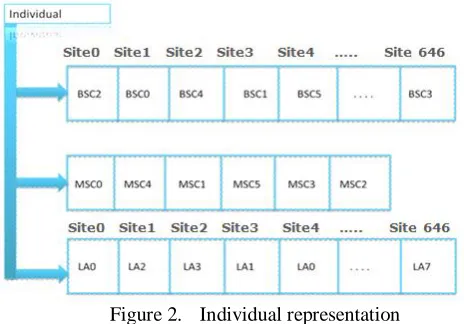
A non-binary representation of the chromosomes is chosen in this work. For instance, the order of gene in the chromosome represents the site number, and the value of gene represents the BSC number that the site assigned to this BSC. The chromosome has therefore a length equal to the number of sites in the network, and the maximal value that a gene can take is equal to the number of BSCs for this instance. Figure 2 illustrates the representation of an individual. Each individual represents a solution to the problem by three corresponding chromosomes. Bear in mind that the feasible solution means that the networks components (BTSs, BSCs, and MSCs) are connected, the borders of the LA are specified, and all the constraints are checked.
Figure 2. Individual representation
Three types of assignments are introduced in this work: Site-to-BSC, BSC-to-MSC, and Site-to-LA connections. In Site-to-BSC connection, the order of gene in the chromosome represents the site number, and the value of gene represents the BSC number that the Site assigned to this BSC. Where, each Site represents the group of cells that belong to the corresponding Site. In BSC-to-MSC connection, the order of gene in the chromosome represents the BSC number, and the value of gene represents the MSC number that the BSC assigned to this MSC. Likewise in Site-to-LA connection, the order of gene in the chromosome represents the Site number, and the value of gene represents the LA number that the Site assigned to this LA. The feasible solution can be generated by one of these types and each assignment affects the network structure in different way. The most affected connection is the BSC-MSC connection as found by our experimental work. Therefore, the ways of constructing the solution are not uniformly distributed among these assignments. As a result, the type of assignment is selected according to the probability assigned for each assignment type.
3.2 GA adapted model
randomly generated to form an initial population. Since population size depends on the nature of the problem, here this size typically contains several hundreds of possible solutions. Traditionally, the population is generated randomly, allowing the entire range of possible solutions (the search space).
The individual will pass the validity check procedure in order to generate a feasible solution to the problem, and then the new load on each BSC is updated and the capacity constraints related to BSC-MSC connection are also checked. All constraints affected by Site-BSC new connection are checked. If these constraints are violated then this individual will be marked as invalid at the end of the iteration, otherwise it is marked as valid. Finally, for each MSC starting with one LA, BTSs are assigned to this LA. Before assigning any BTS to an LA, the load of other BTSs that reside with this BTS in the particular Site should be also checked before being added to the LA. If LA capacity (paging capacity of BTSs) reaches to its limit, then a new LA is created and remaining BTSs started to be assigned to that LA in the same previous manner.
One-point crossover is applied to create the new chromosomes in this approach. Two individuals are picked from the mating pool at random for the crossover. Consequently, the corresponding chromosome of both individuals (the parents) will be fed to the crossover operator. Figure 3 illustrates an instance of the crossover operation, where this operator targets BSC-to-MSC connection chromosomes. The two new child chromosomes are created by crossing the two parent chromosomes. This is done by taking genes 1 to i (here i=3) of the first parent and genes i+1 … n (4 to 7 in this instance) of the second parent (the crossover point is randomly chosen). The new two individuals are produced by checking and add all related loads of each child.
Figure 3. Crossover process
Particularly, crossover between two parents that have high quality solutions may not always produce offspring that have better or high quality solutions. Probability of getting high quality solution for the child is high if solutions of parents have high quality solutions. If a child has low quality solution, it will probably be removed in the next iteration during selection mechanism.
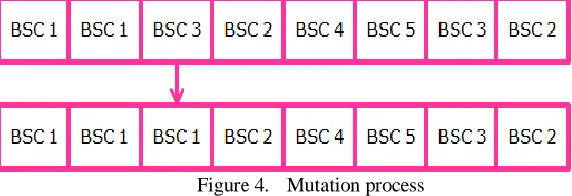
A flip-type mutation is selected to add diversity to the population. Figure 4 illustrates instance of mutation for the Site-to-BSC connection chromosome, where this chromosome will be manipulated according to the mutation probability. Hence, only one gene will be targeted for change. This change is assigning Site1 to BSC1 instead of BSC3 for this instance.
Figure 4. Mutation process
Roulette-wheel selection is opted here, where the fitness function is evaluated for each individual, which will provide the fitness values in each case. Theses fitness values are then normalized. Evaluation function determines how well the chromosomes suit the needs of the problem domain, and the evaluator is the only link between the GA and the problem to be solved. All individuals in population are evaluated by a fitness function, which is taken as the inverse of the total network cost function.
4.COMPUTATIONALEXPERIMENTSANDANALYSIS
4.1 Parameter Setting
In order to find the GA parameter set that gives the best results, different parameter values are tried on multiple data sets. The data sets used in the experiments are collected from an operational GSM network at different times of a week [7]. By choosing a pilot area from the GSM network, all relevant information about the network elements (BS, BSC, and MSCs) is extracted. The capacity limits are vendor-specific and those stipulated by the GSM operator’s equipment are fed to the algorithm as “execution parameters”.
The type of assignment is chosen according to some probabilities assigned for each type of assignment. The best quality solutions were obtained, when the probability assignment of the BSC is 0.2, BSC-to-MSC assignment is 0.5, and Site-to-LA assignment is 0.3.
The crossover probability (the rate of crossover operation) has a high impact on the GA approach performance. Different values of this probability were applied and the worst cost obtained when the crossover probability has the value of 0.1, which means that only 10% of the current population will pass through the crossover operator. While when the crossover probability gets higher the results gets better, where the best cost was achieved with a crossover probability of 0.4.
By applying the mutation operator to each element of the population, a new population is created, and later on this new population will be evaluated. Different values of this probability were applied and the lowest cost was achieved with a mutation probability of 0.3. An attention should be paid to the importance of this parameter, given that a relatively high mutation probability can turn the genetic algorithm to a random search algorithm.
Different population size values were applied and the results indicate that small population provides highest cost while large population provides lowest cost. This indicates that the algorithm has higher tendency to converge to a local sub-optimum while large population do more exploration and have a better chance of finding the global optimum for a given number of generations. the appropriate population size found is 80.
For the number of generations, the parameter is set high enough so that results are able to converge. Note that unnecessarily high value of this particular parameter makes the run time of the algorithm longer. Take into account that for each size of the problem there are a different suggested number of generations.
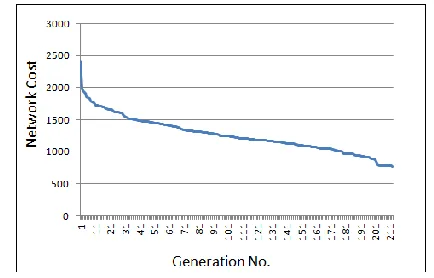
After setting the parameter of the proposed approach, the parameters have been tested and verified with different problem instances. Figure 5 depicts the NW costs (i.e., location update, paging, and link distance costs) of GA based approach at different stages of a typical run for a moderately size sample network that consists of 250 BTSs, 4 BSCs, and 2 MSCs. As illustrated in Figure 5, the initial network cost at generation 0 is 2417, and at generation 205 the cost has been reduced to 736 which is the best cost found with an improvement of 69.5% for this particular network. We noticed that the proposed approach tends to have more global search ability at the beginning of the run while having more local search ability near the end of the run time in order to refine a candidate solution. This indicates the efficiency of the algorithm is greatly dependent on the parameter setting.
Figure 5. A typical run of the GA based approach on a sample network
4.2 Performance Evaluation and improvement
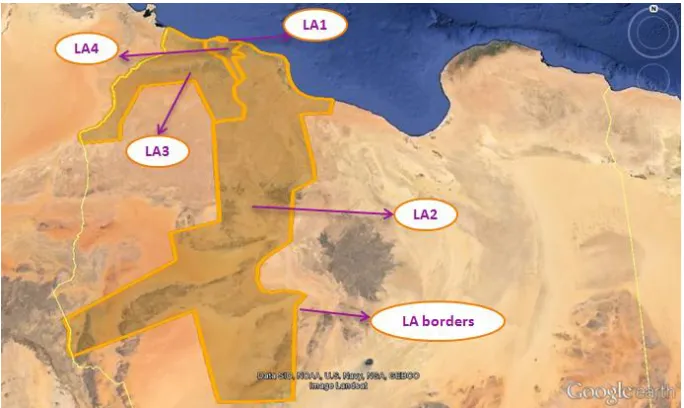
Figure 6. LAs current design of Almadar Aljadeed network
Optimizing the LA design must minimize the LU cost on the LA borders and reduce the paging cost as well; since both are inversely proportional. Between these extremes there are one or more partitions of the MSC service area that can minimize the total cost of paging and updating along with link cost. Since, the upper bound on the size of an LA is the service area of an MSC. To simplify the search, the paging cost has been preserved to a given threshold. In this regard the paging is kept at 56.59% of its full capacity, then the search for minimum location update cost is performed along with link cost. Upon that, the criteria of the design evaluation is based on how many location update event will be occur at the LAs borders and the less number of LU the better LAs design performance, at the same time the paging should be kept under the given threshold along with minimum link cost. Optimizing the existing LA borders with the site constraints make it more complicated to find better feasible solutions in the early stages of the run, That is the search space is more restricted due to this extra constraints.
The design constraints have been met since there is no capacity over load and it also shows that the paging has been kept under the capacity limits. The best result is obtained from 10 independent runs. The result is compared with the existing design, and analyzed by visualizing the data on geographic map as shown in Figure 7. This figure illustrates the complete design for the optimized LAs layout. Table-I and Table-II illustrate the LU cost for the current and the optimized layout respectively.
Table-I Assignment of BSCs to LAs and LU Cost of the current network layout
LAs BSCs LU cost
LA1 BSC1 11909
LA2 BSC2 35295
LA3 BSC3 4679
LA4 BSC4 4156
LA5 BSC5 1267
LA6 BSC6 2527
LA7 BSC7 165
LA8 BSC3 28339
Total LU cost 88337
Total NW cost 410667
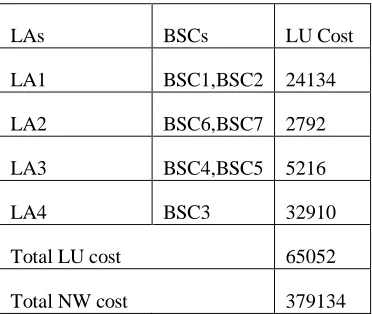
Table-II Assignment of BSCs to LAs and LU Cost of the optimized network layout
LAs BSCs LU Cost
LA1 BSC1,BSC2 24134
LA2 BSC6,BSC7 2792
LA3 BSC4,BSC5 5216
LA4 BSC3 32910
Total LU cost 65052
Total NW cost 379134
The most effective reduction in LU cost is located in BSC1 and BSC2, where BSC1 and BSC2 are assigned to LA1 and LA2 in the existing layout respectively. The total LU cost caused by these two LAs is 47204. This area actually has the largest LU cost in the existing network. In the optimized LAs layout, BSC1 and BSC2 are assigned to LA1 and the LU cost of this case has been reduced to 48.87%.
Finally, Figure 8 illustrates the performance comparison between the existing and the optimized layouts in terms of the total location update cost (LU cost) and the total network cost (NW cost). The reduction rate in total LU cost is 26% and in the total network cost is 7.6%.
0 50000 100000 150000 200000 250000 300000 350000 400000 450000
LU Cost Total Cost
C
o
st
Current layout
Optimized layout
5.CONCLUSIONS
The network resources can be utilized more efficiently, and the network construction costs can be reduced by finding the optimal number of location areas and the corresponding configuration of the partitioned network. This problem is called the location area planning problem. The goal is to partition the network into a given number of location areas such that the total paging and location update cost is maintained at its minimum.
In this paper, Genetic Algorithm is adapted to solve the location area planning problem for an existing network. The proposed approach is applied to the Almadar Aljadeed GSM network; all its realistic constraints and objectives are considered. A significant improvement is obtained over the existing network layout in terms of location update and total costs. This approach can be applied as a tool to help the planning engineers to evaluate and enhance the efficiency for any network elements or requests behavior changes.
6.REFERENCES
[1] A. Elwhishi, I. Ellabib, and I. El-Feghi, Ant Colony Optimization for Location Area Planning Problem in Cellular Networks, In the 9th International
Arab Conference on Information Technology, Hammamet- Tunisia, December 16-18, 2008.
[2] A. A. Reddy and B. N. Chatterji, "A new wavelet based logo-watermarking scheme," Pattern Recognition Letters, vol. 26, pp. 1019-1027, 2005.
[3] D. Goldberg “Genetic Algorithms in Search, Optimization and Machine Learning”, Addison-Wesley Longman Publishing Co., Inc., Boston, MA, 1989.
[4] E. Correa, M. Steiner, A. Freitas, C. Carnieri, “A genetic algorithm for solving a capacitated p-median problem”, Numerical Algorithms. Volume 35,
Issue 2-4, pp 373-388,April 2004.
[5] E. Seurre , P. Savelli , and J. Pierre, GPRS for Mobile Internet, Artech house, 2003.
[6] I. Demirkol, C. Ersoy, M. Caglayun, H. Deliç, “Location Area Planning and Cell-to-Switch Assignment in Cellular Networks” IEEE Transactions On
Wireless Communications, Vol. 3, No. 3, May 2004.
[7] I. Demirkol, C. soy, M. Caglayun, and H. Delic, Location Area Planning in Cellular Networks Using Simulated Annealing, Proc. INFOCOM,
pp.566-573, March 2001.
[8] M. Aljebari, I. Ellabib, and A. Elwhishi, Performance Analysis of Particle Swarm Optimization Approach for Location Area Planning in Cellular
Network, in the International Journal of Modern Communication Technologies & Research (IJMCTR), ISSN: 2321 -0850, Volume-2, Issue-4, April 2014.
[9] S. Almeida-Luz, M. Vega-Rodriguez, J. Gomez-Pulido, J. Sanchez-Perez, “A Differential Evolution Algorithm for Location Area Problem in Mobile
Networks”. SoftCOM2007, 15th IEEE International Conference, Sept 2007.
[10] Performance Monitoring Department, Almadar Aljadeed Network, Almadar GSM System Statistics Database, 2013.