IJIRT 147139
INTERNATIONAL JO URNAL OF INNOVATIVE RESEARCH IN TECHNOLOGY360
An Improved Outlier Detection Scheme in Wireless
Sensor Networks
Kanishka Garg
1, Tarun Kumar
2 1M.Tech Scholar, Geeta Institute of Management & Technology, Kanipla
2Asstt Prof., Galaxy Global Group of Institutes, Dinarpur
Abstract- In the field of Wireless S ensor Networks (WS Ns), the measurements that significantly deviate from the normal pattern or values of sensed data are considered as outliers. The possible sources of outliers can be noise and errors, events, and malicious attacks on the network. Traditional outlier detection techniques are not directly applicable to WS Ns due to the nature of sensor data and specific requirements and limitations of the WS N.
In this Dissertation, the problem of determining faulty readings in a WS N will be studied. A correlation network will be there which will be based on similarity between readings of two sensors. Rank of the each sensor on the basis of correlation will be calculated. In light of this S ensorRank, an efficient in-network voting algorithm will be used to determine faulty sensor readings.
To make outlier detection more energy efficient, we will use clustering in which CH collect the outlier data from its cluster and send it to the Base S tation. Cluster and cluster head will be more important part and CH will be elected base on fuzzy rules considering different membership functions. Performance studies are conducted via simulation.
Index Terms-— SNs, BS, CH, Non- CH
I. INTRODUCTION
WSNs consist of a large number of limited capabilities (power and processing) Micro Electro Mechanical Systems (MEMS) capable of measuring and reporting physical variables related to their environment. A WSN consists of spatially distributed autonomous sensors to cooperatively monitor physical or environmental conditions, su ch as temperature, sound, vibration, pressure, motion or pollutants. Sensor networks are being deployed for a wide variety of applications, including by military applications such as battlefield surveillance and is now used in many industrial and civilian application
areas, environment and habitat monitoring, healthcare applications, home automation, and traffic control. In surveillance applications, sensors are deployed in a certain field to detect and report events like presence, movement, or intrusion in the monitored area. Data collected by sensors are transmitted to a special node equipped with higher energy and processing capabilities called “Processing Node” (PN) or “sink”. The PN collects, filters, and compiles data sent by sensors in order to extract useful information.
II. OUTLIER DETECTION IN WSN In WSNs, outliers can be defined as, “those measurements that significantly deviate from the normal pattern of sensed data” [9]. This definition is based on the fact that in WSN SNs are assigned to monitor the physical world and thus a pattern representing the normal behavior of sensed data may exist. Potential sources of outliers in data collected by WSNs include noise & errors, actual events, and malicious attacks.
Recently, the topic of outlier detection in WSNs has attracted much attention. According to potential sources of outliers as mentioned earlier, the identification of outliers provides data reliability, event reporting, and secure functioning of the network.
A. Types of outliers
IJIRT 147139
INTERNATIONAL JO URNAL OF INNOVATIVE RESEARCH IN TECHNOLOGY361
sink node can also perform outlier detection via a global estimation model. Depending upon the type of outliers, outlier detection techniques can be classified as local or global. A simple classification of different types of outliers is given below.
Local Outliers or First Order Outliers
Global Outliers or Higher order Outliers
B. Methods for Analysis of Outlier Detection Techniques
Three commonly used methods for evaluation of outlier detection algorithms are
Detection Rate
False Alarm Rate
ROC Curve
C. Characteristics of outlier detection techniques for WSNs
Data Model: A straightforward approach to identify the outliers is to construct the normal profile of the data and then use the normal data to detect outliers. The observations whose characteristics differ significantly from normal data are classified as outliers. Based on the type of data available from sensors, the techniques are classified as [50]
Supervised
Unsupervised
Semi- Supervised
Data Type
User specified data
Distance Thresholds
Nearest Neighbor Thresholds
Suspected Number of Outliers
Number of determined outliers: Techniques can also be classified based on the number of outliers they determine.
Single Outliers
Multiple Outliers
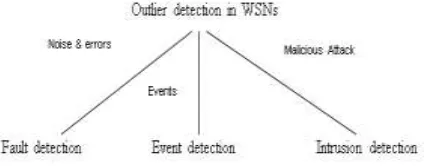
Outlier Identity: As illustrated in Figure 1.6, these topics include fault detection [9], event detection [42] and intrusion detection.
Figure 1.1: Outlier sources in WSNs and their corresponding detection techniques
Outlier Handling: Outlier handling involves the following three steps:
Outlier labeling
Outlier Identification
Outlier Accommodation
Degree of being an outlier: In WSNs, outliers are
measured in two scales.
scalar
outlier score [3].
III. CLUSTERING IN WSN
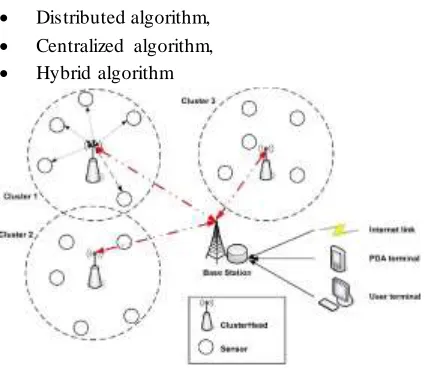
The major advantage of WSN is the ability to deploy it in an ad-hoc manner [3], as organizing these nodes into groups pre-deployment is not feasible. For this reason, a lot of research has been conducted into ways of creating these organizational structures (or clusters) [28]. A clustering scheme divides the sensor nodes in a WSN into different virtual groups, according to some set of rules. In a cluster structure, sensor nodes may be assigned a different status or function, such as cluster head or cluster member [19]. We can see in the Figure 1.7, the architecture of a generic WSN, and examine how clustering is an essential part of the organizational structure [28]. Sensor Nodes: Sensor nodes are the building blocks of a WSN. They can play multiple roles in a WSN, such as simple sensing, data processing, data storage and routing. Clusters: Clusters are the organizational unit of WSNs. The dense nature of WSNs requires them to be broken down into clusters to simplify tasks such as routing. Cluster heads: Cluster head is the organizational leader of a cluster. It organizes the activities in a cluster.
IJIRT 147139
INTERNATIONAL JO URNAL OF INNOVATIVE RESEARCH IN TECHNOLOGY362
communication link between the WSN and the end -user. End User: The data obtained from sensor network can be used for a wide-range of applications. A particular application can make use of the network data over the internet, using a PDA, or even a personal computer. In a queried sensor network, queries are generated by the end user.
B. Clustering Algorithms
Many algorithms have been proposed for routing in WSN. Clustering algorithms have gained popularity in this field. Clustering algorithms can be classified as:
Distributed algorithm,
Centralized algorithm,
Hybrid algorithm
Figure 1.2: Clusters in WSNs IV. LITRATURE SURVEY
A. Outlier Techniques Designed For WSNs
Recently, many outlier detection techniques specifically developed for WSNs have emerged. In this section, we provide a technique-based taxonomy framework to categorize these techniques.
As illustrated in Figure 2.1, outlier detection techniques for WSNs can be categorized into statistical-based, nearest neighbor-based, clustering-based, classification-based, and spectral decomposition-based approaches. Statistical-based approaches are further categorized into parametric and non-parametric approaches based on how the probability distribution model is built. Gaussian -based and non-Gaussian--based approaches belong to parametric approaches and kernel-based and histogram-based approaches belong to non-parametric approaches.
Figure 2.1: Taxonomy of outlier detection techniques for WSNs
Classification-based approaches are categorized as Bayesian network-based and support vector machine-based approaches machine-based on type of classification model that they use. Bayesian network-based approaches are further categorized into naive Bayesian network, Bayesian belief network, and dynamic Bayesian network based on the degree of probabilistic independencies among variables. Spectral decomposition-based approaches use principle component analysis for outlier detection. Distance weighted voting:
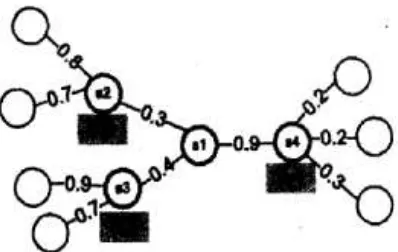
Weighted voting methods have been proposed in the literature [52]. Motivated by an assumption that the closer sensors have more resembled readings, the weighted voting algorithms give more weights to closer neighbors in voting (i.e., the weights are assigned inverse to the distances from a SN to its neighbors). However, they argued that the distance between two sensors does not fully represent the correlation between readings of those two sensors Furthermore, if the nearest sensor is faulty, the voting result may be seriously contaminated by this faulty sensor.
Disadvantage:
1. It does not precisely capture about the correlation between sensor readings.
IJIRT 147139
INTERNATIONAL JO URNAL OF INNOVATIVE RESEARCH IN TECHNOLOGY363
Figure 2.2: Weighted voting method
Using SensorRank Scheme:
In the proposed algorithm in [52], each SN is associated with a trustworthiness value (called Sensor-Rank) that will be used in voting. SensorRank of a SN implicitly represents the number of reference & (i.e.,a Similar SNs nearby) it has to support its opinions. A SN will obtain a SensorRank if this sensor has many references.
B. Classification of Clustering Attributes in WSN
The Attributes for clustering are classified according to:
Cluster Characteristics
Cluster-Head Characteristics
Clustering Process
Entire Proceeding of Algorithm
Taxonomy of Clustering Methods in WSNs
In this subsection, we integrate the set of attributes that can be use to categorize and differentiate clustering methods for WSNs. Based on the discussion above, a relatively comprehensive and fine-grained taxonomy of clustering methods in WSNs is proposed, which is summarized in Figure 2.1.
Analysis of Prominent Clustering Routing Protocols in WSNs
LEACH
LEACH (low-energy adaptive clus tering hierarchy) proposed by Heinzelman et al. [21], is one of the pioneering clustering routing approaches for WSNs. It divides the protocol operation into rounds, and each round is subdivided into two phases: setup and steady-state phase. In the setup phase, the nodes create clusters and elect CH. The node becomes a CH
for the current round if the number is less than the following threshold:
Figure 2.3: Taxonomy of Clustering Methods in WSNs
In the case of the steady state phase, non -CHs transmit the sensed data to their CH. CHs receive the data, aggregate it into a single packet and forward it to the BS. After a certain period of time the network returns to the setup phase. However, LEACH has some drawbacks-
1. It does not take account of the energy level of the sensor nodes.
2. It does not employ any scheme to control the cluster.
3. Additionally, the cluster can be formed in a disproportional way, which causes furthermore communication interferences and network partitioning.
4. LEACH cannot provide reliability, energy-efficiency or a fair distribution of resources. CLENER
IJIRT 147139
INTERNATIONAL JO URNAL OF INNOVATIVE RESEARCH IN TECHNOLOGY364
designed an head is elected. After that a cluster is formed with the cluster head and different nodes. ESEP
ESEP is proposed by M. M. Islam et al [29]. The authors devised a energy efficient protocol named as “Extended Stable Election Protocol (ESEP) for Three level Hierarchical Clustered Heterogeneous WSN”. ESEP is a three level heterogeneous protocol in HWSN. ESEP has three types of nodes normal, moderate and advance nodes. The higher energy nodes i.e. moderate and advance nodes have more chances to become cluster head due to their high initial energy. ESEP also considers the remaining energy concept accordingly the increasing number of rounds in WSN. On simulation ESEP protocol produces better results in terms of network lifetime, on comparing with traditional SEP.
MODLEACH
This protocol is proposed by Mahmood, N. Javaid et al [35]. The authors devised a protocol named as MODLEACH: A Variant of LEACH for Wireless Sensor Networks. MOD-LEACH is a modified and enhanced version of LEACH which is a very renowned protocol in hierarchical clustering routing protocols in WSN. MODLEACH has a threshold for cluster head replacement scheme after every round with dual transmitting levels. . If current CH has not dissipated much energy during that round and if the CH has more energy than required threshold, it will remain cluster head for the next round also. The MOD-LEACH protocol is more robust than LEACH on terms of packets sent to the base station, formation of the cluster head and stability of the network with longer lifetime of sensor nodes. Further advancement in the protocol is made by incorporating the hard and soft threshold concept of the TEEN protocol for reactive WSNs. Then there will be two new versions of the MOD-LEACH i.e. hard threshold MODLEACH and soft threshold MODLEACH. On comparison with the help of simulation these outperforms the traditional leach metrics of throughput and network life.
EDDEEC
This protocol is proposed by N. Javiad et al [34]. The authors proposed EDDEEC (Enhanced Developed DEEC) for HWSNs. This approach is an enhanced
version of EDEEC and DDEEC named as EDDEEC. In EDDEEC, it removes the penalizing effect of DDEEC and has the three types of energy nodes in EDEEC with a new threshold called absolute threshold. On simulations it shows better results than previous algorithms.
BEENISH
This protocol is proposed by T. N. Qureshi et al [48]. The authors devised BEENISH (Balanced Energy Efficient Network Integrated Super Heterogeneous) Protocol for WSNs. In BEENISH CHs are elected on the basis of distinct five types of probabilities for five types of different nodes. It propose four energy levels of nodes in WSN, the new forth level energy node group is ultra super nodes which has the highest energy level in WSN. Simulation shows that it outperforms DEEC variants.
ZSEP
This protocol is proposed by G. Chandini et al [18]. The authors introduced Energy Efficient Zonal Stable Election Protocol for WSNs. The authors proposed the energy efficient routing protocol Zonal St able Election Protocol (ZSEP). In which they categorized the network into three regions. One zone in network contains the normal nodes and remaining other two zones contains the advance nodes according to their energy levels. The base station is deployed in the center is stationary in sensor area. If the normal nodes want to send their sensed data to BS, they have the privilege of direct communication to BS. If the node comes in other two zones which have the advance nodes then they will forward data to CH and relay their data to BS through the CH. ZSEP shows better results from the existing protocols in terms of energy metrics.
iP-EDEEC
IJIRT 147139
INTERNATIONAL JO URNAL OF INNOVATIVE RESEARCH IN TECHNOLOGY365
Base Paper
This scheme was proposed by Ritika et al [40] in 2018. In this research, they presented an efficient technique for Outlier Detection using Sensor Rank in the WSNs. In the existing Sensor Rank scheme, a single network is considered and rank is calculated and Faulty nodes are detected. But for a network to be good designed there should be cluster formation. Traditional Algorithms have not used clustering technique. So, an efficient Clustering technique CLEANER [10] is applied to the Sensor Rank [52] and faulty nodes are detected from each cluster. A further direction of this study will be dedicated node to which a default high energy can be given. This node is outside the cluster and performs all the calculation for the cluster due to which the overhead of cluster head can be reduced.
IV. PRONLEM DEFINATION
Energy efficiency is the major aspect that needs to be taken care of while developing any protocol for the WSNs. This is because of the fact that the SNs are highly constrained in terms of power and their batteries are generally neither‟ replaceable nor rechargeable. The system model of trust voting algorithm with clustering to detect outlier nodes in WSNs takes a keen care of this issue.
This chapter elaborates the system model of the protocol developed. Generally, protocol complexity, node deployment, heterogeneity, requirement of GPS device, etc are major issues for a given system model. The proposed model saves energy by using the concept of fuzz logic with clustering. As the proposed model will use the concept of clustering in which the main purpose is to provide energy -efficiency by using fuzzy logic for cluster formation and a probability function for CHs election to find the outlier node in the cluster.
A. Objectives
The summarized and main objectives of work for the dissertation as follows:
To study existing Clustering and Outlier Techniques.
To find an efficient clustering method in WSN To enhance the life time of network.
Efficiently election of Custer Head (CH).
To compare the existing technique with the proposed technique using the different parameters.
We will use MATLAB for simulation.
V. IMPROVED CLUSTER-BASED APPROACH IN WSNs
The model considers a network with the following characteristics:
The SNs are fixed and are energy-constrained;
The BS has not subject to energy restrictions and is located inside the sensing field;
After node deployment batteries will not get recharged.
A. CH election
AS the nodes are divided into clusters and a set of nodes is periodically elected as a CH. The work of CH is very tedious as it manages all the management of SNs which are there in its cluster and send the collected data to the BS.
So election of CH is very important task in clustering. On the basis of multiple matrices, this CH must be chosen.
During the initialization of the network, BS broadcasts a startup message, which enables the node to compute the distance to BS.
After adjusting the transmission power, every node generates a random number (μ), which ranges between 0 to 1. Then, if a node decides to become a CH by comparing μ with the T(n), which is calculated using Equation 1. If μ is less than T(n), the node becomes a CH for the current round.
T(n)=
(1)
Where η and α are weights to give importance, the sum is exactly 1. The Residual Energy is denoted as
RE, and σre means the energy variance, which is used
to produce better CH candidates.
Now, the node that becomes CH broadcasts a message which contains the value of its remaining energy. Then, CH waits for a join message from the non-CH nodes. However, if the CHs do not receive a
join message, this CH should not become CH.
IJIRT 147139
INTERNATIONAL JO URNAL OF INNOVATIVE RESEARCH IN TECHNOLOGY366
In earlier work, Non-CHs select the best CH by considering a multiple metrics, i.e. residual energy, distance between non-CH and CH. Then, non-CHs compute a probability value to each CH candidate using Takagi-Sugeno Fuzzy System (TS). The non-CH chooses the non-CH with a higher probability value and sends a join message to CH.
Now in present work author had used three linguistic input variables of the system are residual energy, distance between non-CH and CH and the distance between CH and Base Station.. The specifications related for the input and output functions of the system and their respective Linguistic Values (LV) are as follows:
Residual energy: u=[0,100]: LV = low, average, high;
dis_CH_node: u=[0,100]: LV = small, average, big;
dis_CH_base: u=[0,100]: LV = small, average, big;
Probability: u=(0,1]: LV = very high, Medium high, high,
Moderately medium, fairly medium, medium, moderately low, low, very low.
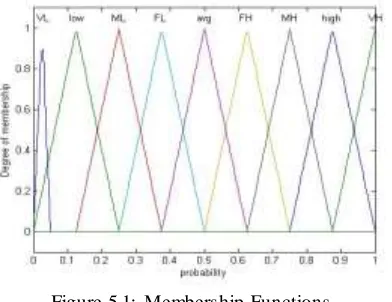
For the representation of the linguistic states (low, high, small and large) of the input variables, the degrees of membership to these sets must remain constant for certain values of the universe of discourse.
The membership functions designed for the system are shown in figure 5.1. The rules are expressed as logical implications in the form of IF-THEN statements in a mapping from fuzzy input sets to output functions.
Figure 5.1: Membership Functions
The rules are determined on the basis of an analysis of the whole network behavior through extensive
simulations over time. They result in a class of higher probability, ensure an excellent chance these nodes will be elected, and differentiate depending on their distance from each CH.
Table 5.1 shows the fuzzy inference rules used in the system.
Table 5.1: Fuzzy Inference Rules Energy dis_CH_no
de
dis_CH_bas
e Probability
H L L VH
H M L VH
H H L MH
H L M VH
H M M MH
H H M H
H L H MH
H M H H
H H H H
L L L VL
L M L VL
L H L ML
L L M VL
L M M ML
L H M L
L L H ML
L M H L
L H H L
M L L VM
M M L VM
M H L MM
M L M VM
M M M MM
M H M M
M L H MM
M M H M
M H H M
The use of fuzzy logic is appropriate, whenever it is not possible to employ a mathematical model for the system. Additionally, fuzzy can reduce the complexity of the model, computational effort and memory TS receive context information from nodes as input and converts into fuzzy linguistic variable input.
IJIRT 147139
INTERNATIONAL JO URNAL OF INNOVATIVE RESEARCH IN TECHNOLOGY367
To capture the correlation of sensor readings of SNs a correlation network is to be maintained for sensor readings.
The correlation network is modeled as a graph G = (V;E), where V represents the SNs in the deployment region and E ={(si; sj)|si, sj ∈V; dist(si; sj) <R and
corri,j> 0}. The weight of an edge (si; sj) is assigned to
be corri,j. Once the correlation network of sensors is
constructed (and maintained), one can easily deduce the correlations among SNs. Based on the correlation network, we shall further develop an algorithm to compute SensorRank for each SN, in terms of the correlation with its neighbors, in the network.
D. SensorRank Calculation
SensorRank is to represent the trustworthiness of SNs. By our design, two requirements need to be met in deriving SensorRank for each sensor.
Requirement 1: If a sensor has a large number of
neighbors with correlated readings, the opinion of this sensor is trustworthy and thus its vote deserves more weight.
Requirement 2: A SN with a lot of trustworthy
neighbors is also trustworthy. These two requirements ensure that:
1. A SN which has a large number of similar neighbors to have a high rank.
2. SN which has a large number of „good references‟ to have a high rank. Given a correlation network G = (V; E) derived previously, we determine SensorRank for each sensor to meet the above two requirements. Based on the above setting, we can formulate SensorRank of Si , denoted as ranki, as follows:
∑ ∈ ranki = ∑ ∈ (2)
wherepj,i is the transition probability from state i to state j.
With the help of clustering instead of SensorRank exchange their rank to each other CH collect the sensor ranks of all SNs thereby energy is saved which is our main motive.
D. TrustVoting Algorithm
Here we describe the TrustVoting algorithm, which consists of two phases:
self-diagnosis; and
neighbors diagnosis phase.
In the self-diagnosis phase, each sensor verifies whether the current reading of a sensor is unusual or not. Once the reading of a sensor goes through the self- diagnosis phase, this sensor can directly report the reading. Otherwise, the SN consults with its neighbors to further validate whether the current reading is faulty or not. If a reading is termed as faulty, it will be filtered out.
Self-diagnosis Phase
When a set of SNs is queried, each sensor in the queried set performs a self-diagnosis procedure to verify whether its current reading vector is faulty or not. Once the reading vector of a SN is determined as normal, the SN does not need to enter the neighbor-diagnosis phase.
Neighbor-diagnosis Phase
If a SN si sends bi(t) to a neighbor sj, sj will compare
bi(t) with its own current reading vector bj(t) and then give its vote with respect to bi(t). From the votes from
neighbors, sihas to determine whether bi(t) is faulty or
not. Notice that some votes are from sensors with high SensorRank. A SN with high SensorRank has more similar neighbors to consult with and thus is more trust- worthy. Therefore, the votes from the neighbors with high SensorRank are more authoritative, whereas the votes from the neighbors with low SensorRank should cast less weight. When sensor si sends bi(t) to all its neighbors for the
neighbor-diagnosis, each neighbor should return its vote after determining whether bi(t) is faulty or not. If a neighbor sj considers bi(t) is not faulty by comparing the similarity of the two reading vectors (i.e., corri;j )sj will send a positive vote, denoted votej(i), to si. Otherwise, the vote will be negative. In addition, the vote from sj will be weighted by its SensorRank.
{ (3) After collecting all the votes from the neighbors,
sihas two classes of votes: one is positive class (bi(t) is normal) and the other is negative class (bi(t) is
IJIRT 147139
INTERNATIONAL JO URNAL OF INNOVATIVE RESEARCH IN TECHNOLOGY368
weight of the later, the most neighbors will view bi(t) as normal. Note that the weight of a vote represents how authoritative a vote is. It is possible that a neighbor sj of si with a large SensorRank has a small
correlation with si. In this case, these two SNs may not provide good judgments for each other. Therefore, each vote (i.e., votej(i)) has to be multiplied by the corresponding correlation, corri.j.
Thus, we use the following formula to determine whether the reading is faulty or not.
deci= ∑ ∈ (4) If the weight of the positive votes is more than the weight of the negative votes, deci will be positive which means that si's reading is normal and the
current reading can be reported. Otherwise, deci is
negative, implying that the current reading of si is
faulty.
Each CH find the outlier nodes with in the cluster, it will send data to the BS. BS will aggregate the data and send the aggregated outlier data to every cluster. Now each CH has aggregated outlier data of every other cluster. So whenever there is an Inter-Cluster communicates within the network, CH will check the local aggregated outlier data.
In this way we can detect the Inter-Cluster outlier nodes.
The Pseudo code of Proposed Model is as Follows:
Step1: Start
Step 2: Create a Network
Step 3: Create Clusters from network with following considerations.
a. A CH is selected from the SNs based on threshold energy.
b. Based on last step, Non-CHs select the best CH by considering a multiple metrics i.e. residual energy, distance from non-CH to CH and distance from CH to BS using the concept of Fuzzy logic and Cluster is created.
Step 4: Rank of each node is calculated using SensorRank [52].
Step 5: With SensorRank, TrustVoting algorithm [52] is used which consists of two phases:
a.Self-diagnosis: performs a self-diagnosis procedure to verify whether its current reading vector is faulty or not.
b.Neighbor diagnosis phase: The votes from the neighbors are taken. Vote with high SensorRank
are more authoritative, whereas the votes from the neighbors with low SensorRank should cast less weights.
Step 6: If a neighbor with a large SensorRank has a small correlation node, they may not provide good judgments for each other. Therefore, each vote correlation, corri.j, following formula is used to determine whether the reading is faulty or not.
deci= ∑ ∈
if deci= +ve, node‟s reading is normal.
Otherwise, deci=-ve, implying that the current
reading of node is faulty.
Step 7: Collection of outlier data within the cluster using CH, it will send data to the BS.
Step 8: Aggregated data from the BS is forwarded to every cluster.
Step 9: Stop
VI. RESULT & DISCUSSION
A. Simulation Scenario
Initially there is a network in which nodes are distributed randomly. Election of cluster head and detection of outlier in old scheme is shown in figure 5.2.
Figure 5.2: Network creation, election and outlier detection in old scheme.
Each Normal node will elect its cluster head based on Probability which can be calculated Fuzzy Logic System using the three input variables “distance between the node & cluster head”, distance between the non-cluster head and base station” and “Residual Energy”.
IJIRT 147139
INTERNATIONAL JO URNAL OF INNOVATIVE RESEARCH IN TECHNOLOGY369
Figure 5.3: Membership function and their Correlation in Fuzzy system
B. Performance Evaluation
The basic parameters used for simulations are listed in table 5.2.
Table 5.2: Parameters employed in Simulation Parameter Value
Field Size 50m X 50m Location of Base Station 25m X 25m Probability of cluster 0.1
Initial Energy of sensor node
20 J
The Data packet Size 208 bits DeltaT 10
ᶯ 0.4
α 0.6
mindreading 1 maxReading 10 Efs 10 J/bit/m2
Emp 0.0013 J/bit/m4
Based on these parameters author will carry out the simulations. These parameters are taken after studying different research papers used in Wireless sensor network.
Figure 5.4 shows the energy consumed by existing and new scheme which is showing that the new scheme is more energy efficient than the old schemes.
Figure 5.4: Energy Consumption in Existing and New Scheme.
Figure 5.5 showing the no. of faulty nodes found by existing and new scheme.
Finally table 5.3 and 5.4 summarizes the comparison between two schemes. Both the schemes had been executed 10 no. of times and finally the comparison table is drawn.
Figure 5.5: Faulty per round in Existing and New Scheme.
Table 5.3: Average energy consumption (J) in 10 Rounds
Average energy consumption(J) in 10 Rounds Old
Scheme
Proposed Scheme Attempt 1 0.0405 0.0288 Attempt 2 0.0361 0.0224 Attempt 3 0.0311 0.0261 Attempt 4 0.0346 0.0231 Attempt 5 0.0378 0.0218 Attempt 6 0.0343 0.0204 Attempt 7 0.0334 0.0291 Attempt 8 0.0357 0.0277 Attempt 9 0.0341 0.0264 Attempt 10 0.0314 0.0289 Avg. of 10 Attempts 0.349 0.2547 Avg. Energy
Consumption(J) in %age
IJIRT 147139
INTERNATIONAL JO URNAL OF INNOVATIVE RESEARCH IN TECHNOLOGY370
Table 5.3 shows that Energy consumption in proposed scheme is less in comparison of old scheme by 2.34 % (approx.). So proposed scheme is 2.34 % (approx..) more efficient than old one.
Table 5.4 shows that no. of faulty nodes found in proposed scheme is almost same in comparison of old scheme.
Table 5.4: Average Outlier detected in 10 Rounds Average Outlier Detected in 10 Rounds
Old Scheme (Round off)
Proposed
Scheme (Round off)
Attempt 1 11 10 Attempt 2 10 12 Attempt 3 12 11 Attempt 4 11 11 Attempt 5 9 9 Attempt 6 11 10 Attempt 7 12 10 Attempt 8 11 11 Attempt 9 10 11 Attempt 10 12 10 Avg. of 10 Attempts 10.9 10.5
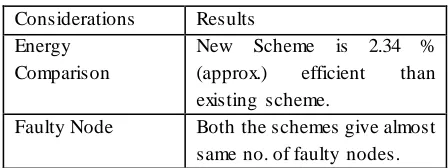
Table 5.5 gives the final results based on various considerations showing that new scheme in more energy efficient.
Table 5.5: Results based on different considerations. Considerations Results
Energy Comparison
New Scheme is 2.34 % (approx.) efficient than existing scheme.
Faulty Node Both the schemes give almost same no. of faulty nodes.
VII. CONCLUSION
A.Conclusion
In this work a new membership function is added as distance between non-CH and BS which was not considered in last work. This parameter is very important in deciding the probability for being CH as if the distance between the two is high which means there will more energy needed to work. So upon using this membership function, the energy consumption becomes low by 2.34% as compared to old scheme. Also the new scheme is as competent as
previous on in detection of outlier because it is finding almost equal faulty nodes in the network.
B. Future Scope
In future, the present work can be enhanced by setting another node as second cluster head so that when current node‟s energy goes down from minimum threshold, the second node comes in to action.
Also, the chosen cluster head should be given an extra amount of energy at the time when it will get selected as cluster head. It is for long life of cluster head and Network.
REFFERENCES
[1] A. R. Ganguly, “Knowledge Discovery from Sensor Data”, CRC Press, 2008.
[2] Anamika Saini, Ashok Kumar, H.L.Mandoria and B.K.Pandey , (2016). “Study and analysis of DEEC protocols in hetergeneous WSNs using MATLAB”. In International Research Journal of Engineering and Technology, eISSN 2395 -0056, p-ISSN- 2395-0072, Vol. 3 Issue-8, Aug 2016.
[3] Chandola, V., Banerjee, A. and Kumar, V., “Outlier detection: a survey”, Technical Report, University of Minnesota, 2007.
[4] Claudio Silva, Rodrigo Costa, AdoniasPires, Denis Rosário, Eduardo Cerqueira, Kássio Machado, Augusto Neto and JóUeyama, “A Cluster-based Approach to provide Energy-Efficient in WSN”, International Journal of Computer Science and Network Security, VOL.13 No.1, pp. 55-62, January 2013.
[5] H. Luo, P. Zefros, J. Kong, S. Lu, and L. Zhang, “Self-securing adhoc wireless networks”, in Seventh IEEE Symposium on Computers and Communications (ISCC ‟02), pp. 567-574, 2002. [6] Heinzelman, W.R.; Chandrakasan, A.;
Balakrishnan, H. Energy-Efficient Communication Protocol for Wireless Microsensor Networks. In Proceedings of the 33rd Annual Hawaii International Conference on System Sciences, Maui, HI, USA, 4–7 January 2000; pp. 10–19.
IJIRT 147139
INTERNATIONAL JO URNAL OF INNOVATIVE RESEARCH IN TECHNOLOGY371
Science and Software Engineering, International Conference on, vol. 4, pp. 154 – 157, December 2008.
[8] M.M. Islam, A.Iranli and M.Pedram (2002). Wsn. In Fourth IEEE Conference on Mobile and WirelessCommunication Networks, ICMWC, pages 88–97.
[9] N. Javaid, T.N. Qureshi, A.H. Khan, A. Iqbal, E. Akhtar, M. Ishfaq, EDDEEC: Enhanced Developed Distributed Energy-efficient Clustering for Wireless Sensor Networks, Procedia Computer Science, Volume 19, 2013, Pages 914-919, ISSN 1877-0509
[10]N.Javaid, S.Mahmood, S.Quresh, A.M.Memon, T. Zaman ,” MODLEACH: A Variant of LEACH for WSNs. 2013 Eighth International Conference on Broadband, Wireless Computing, Communication and Applications ,978-0-7695-5093-0/13 2013 IEEE
[11]Ritika, Amandeep Kaur, Dr. Rajneesh Kumar Gujral, “Outlier Detection in WSN based on Ranking and Clustering Technique”, in ICETEST-2018, Volume 4, Issue 3, March- 2018, ISSN: 2454-4248, pp. 113-117.
[12]S. Rajasegarar, C. Leckie, M. Palaniswami, and J. C. Bezdek, “Distributed anomaly detection in wireless sensor networks”, in Communication systems, 2006. ICCS 2006. 10th IEEE Singapore International Conference on, pp. 1 –5, October 2006.
[13]T. N. Qureshi, N. Javaid, A. H. Khan, A. Iqbal, E. Akhtar, and M. Ishfaq, (2013). “Balanced Energy Efficient Network Integrated Super Heterogeneous Protocol for Wireless Sensor Networks”. Procedia Computer Science, Vol.19, pp.920-925.
[14]V. J. Hodge and J. Austin, “A survey of outlier detection methodologies”, Artificial Intelligence Review, vol. 22, pp. 85–126, 2004.
[15]Xiang-Yan Xiao, Wen-ChihPeng and Chih-Chieh Hung, “Using sensor rank for in- network detection of faulty nodes in WSNs”, in proceedings of MobiDE‟07, June 10, 2007. [16]Y. Zhuang and L. Chen, “In-network outlier