FRAUDULENT
FINANCIAL
STATEMENTS:
DETECTION
MODELING USING DATA MINING
Ms. Hiral Patel1 & Dr. Satyen Parikh2
1. INTRODUCTION
Fraud is an act which is done deliberately and intentionally to deprive wealth in any form by deception or other unfair means. Most of the financial frauds in the corporate are fall under asset misappropriation. However, submission of fraudulent statements falls under the category of concealment of liabilities; improper asset valuation, fictitious revenues and improper disclosures are various forms of frauds. These practices cause severe damage to the financial system of institutions across countries. Similarly, with the help of leakages in systems of cyber and technology, fraudsters commit financial crimes. All kind of financial frauds affects the performance of economy.
The growing capital infusion and increasing pace of business diversifications have a significant impact on the interest of all stakeholders. These associated interests are affected by the financial and corporate fraudulent practices. Even fraud results into the serious risk to stakeholders. Stakeholders do not know any formal system to detect and respond to frauds. It is obvious that none of the model or system can predict fraud with the 100 percent accuracy, but stakeholder’s can take some preventive steps if model helps in giving warning signals about possible frauds.
The billions of dollars were assumed to be vanished due to fraud by corporate management annually in the United States (Wells, 1997). Association of Certified Fraud Examiners in India has noted financial statement fraud in 10 percent cases with median loss of USD 9.75 lacks (Grant Thorton and ASSOCHAM report on Financial and Corporate Fraud, July-2016). Creative manipulation of financial statement is commonly used practices, Auditing became very essential tool. In India, certified auditors are responsible for detection of any possible fraud in Financial Statement. Contrarily, the fraud detection in financial statements is a very difficult because currently it is normally done through manual observations and cross verification procedure of auditing. At the same time Auditors are overburden. Hence, standard auditing procedures is not enough to identify financial frauds. Therefore, some trained model or system can be used as alternatives for the auditors to simplify auditing. It also helps in detecting any possible fraud related to warning signal (Ata et al, 2009). In this context, if some computer based model or system developed then it can be a very helpful to stakeholders for fraud detections.
Data mining is process of searching insights that may statistically reliable, actionable and previously unknown from the available historical data sets (Elkan, 2001; Kirkos et al, 2007). Thus, in current research three different data mining algorithms were applied for training the model by feeding the data and finally were tested for the accuracy.
2. LITERATURE REVIEW
1
Acharya Motibhai Patel Institute Of Computer Studies, Ganpat University, Gujarat, India 2
Abstract- A rising incidents of financial frauds in recent time has increased the risk of investor and other stakeholders. Hiding of financial losses through fraud or manipulation in reporting and hence resulted into erosion of considerable wealth of their stakeholders. In fact, a number of global companies like WorldCom, Xerox, Enron and number Indian companies such as Satyam, Kingfisher and Deccan Chronicle had committed fraud in financial statement by manipulation. Hence, it is imperative to create an efficient and effective framework for detection of financial fraud. This can be helpful to regulators, investors, governments and auditors as preventive steps in avoiding any possible financial fraud cases. In this context, increasing number of researchers these days have started focusing on developing systems, models and practices to detect fraud in early stage to avoid the any attrition of investor’s wealth and to reduces the risk of financing. In Current study, the researcher has attempted to explore the various Data Mining (DM) techniques to detect fraud in financial statements (FFS). To perform the experiment, researcher has chosen 86 FFS and 92 non-fraudulent financial statements (non-FFS) of manufacturing firms. The data were taken from Bombay Stock Exchange for the dimension of 2008-2011. Auditor’s report is considered for classification of FFS and Non-FFS companies. T-test was applied on 31 important financial ratios and 10 significant variables were taken in to consideration for data mining techniques. 86 FFS and 92 non-FFS during 2008-2017 were taken for testing data set. Researcher has trained the model using data sets. Then, the trained model was applied to the testing data set for the accuracy check. Keywords: fraudulent Company, BSE, Data Mining, Financial Ratio, Predictive Model
Eining et. al. (1997) developed a model to be used as an expert system which can enhance the performance of auditors. The researcher found that when expert system used by auditors, they performed well in identifying various level of fraud-risk. It helps management to make consistent decisions about their actions.
In 1997, Green and Choi obtained a Neural Network (NN) model for classifying fraud and non-fraud financial statements. The researchers used 5 financial ratios resulting from the financial statements as input variables. The study concluded was that Neural Network model had strong capabilities in finding fraud in financial statement.
Fanning and Cogger (1998) again tried a Neural Network for detecting FFS. The researcher used financial ratios and qualitative variables as an input vector. They analyzed comparison of the performance of their model with logistic regression as well as linear and quadratic function of discriminate analysis and argued that model developed by them is more efficient in comparison to past models.
In 2000, Bell and Carcello built and checked a Logistic model for estimation of fraudulent financial reporting with data samples of 77 FFS and 305 non-FFS. They observed that the significant red flags that differentiate FFS from non-FFS are 1) aggressive attitude of management, 2) a weak internal control environment, 3) difficulty in auditing transaction and 4) management pressure on meeting earning goals.
According to Kirkos et al. in 2007, Neural Networks, Bayesian Belief Networks and Decision Trees are some of very useful techniques among various data mining methods. They explored these data mining methods for discovering the possible fraud in financial statements. The study has compared all three data mining techniques to know its relative performance. In their study, Kirkos et al., (2007) revealed that Bayesian Belief Network is most efficient and helps to achieve the finest performance. It manages to correctly classify 90.3% of validated sample. However the accuracy rate and effectiveness of Network model was found 80% and for the Decision Tree model it was around 73.6%. The researchers tried to check dependencies between falsifications with different ratios. The ratios considered in their study are frequently connected with firm’s financial status.
Ravisankar (2011) worked upon applying intelligent techniques to find fraud in financial statement of Chinese companies. Researcher collected 202 data of Chinese companies and analyzed the performance of various data mining methods. Researcher had selected 18 dimensions initially then for dimensions reduction t-statistic was applied. Only the significant variable for the study were selected for further process. Researcher found 10 significant variables after applying t-test. For testing the model, ten-fold cross validation was performed. Researcher observed that PNN was the best performer among all the above methods.
Zhou & Kapoor (2011) tested four data mining methods namely Bayesian networks, regression, neural network and decision trees. Objective was to examine the performance and limitation of the selected methods in examining manipulation in financial statement.
3. RESEARCH METHODOLOGY
Step by step process for development of decision model is illustrated in figure 1. In this section, reasons for data selection, tool selected and methodology used are explained.
Figure 1: Process for Development of Detection Model Annual
Reports from BSE / NSE
Categorize from Financial statement (FFS/Non-FFS)
Dataset of 31 financial ratios of 86 FFS and 92 Non-FFS
Significant financial 10 ratios
t - statistic
Application of Predictive data mining techniques to build the model
3.1 Data
Total 31 variables were selected for development of model based on literature; researcher has decided to refer the listed companies on BSE and/or NSE from timeline of 2008 to 2017. As the listed companies are represent total population under consideration. 10 years time line is true representation of whole economic cycle and hence data from time line given appropriate representation of FFS and Non-FFS companies. The researcher has referred the annual auditor’s report for the randomly selected 178 companies from manufacturing sector only. Reason behind selecting manufacturing industries is its necessity of huge capital expenditure requirement that leads to possible financial trouble. This leads to creative accounting practices in industry and possible fraud reporting.
Based on auditor’s opinion researcher has classified the companies into two categories i.e. Companies with FFS and Companies with Non-FFS. Researcher has used auditor’s unmodified (Give True and Fair View) versus modified (all others; qualified, declaimer and adverse) opinion to classify all companies as Non-FFS and FFS respectively. Researcher has selected 86 FFS and 92 Non-FFS companies to train the model.
3.2 Variables under Consideration
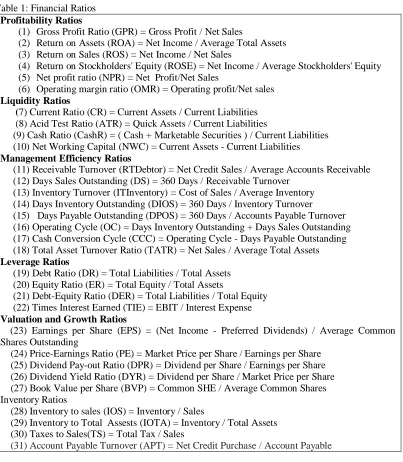
Financial ratios from income statement, Balance sheet and composite were taken for the study based on literature. The data contained 31financial ratios for each company as listed below.
Table 1: Financial Ratios Profitability Ratios
(1) Gross Profit Ratio (GPR) = Gross Profit / Net Sales
(2) Return on Assets (ROA) = Net Income / Average Total Assets (3) Return on Sales (ROS) = Net Income / Net Sales
(4) Return on Stockholders' Equity (ROSE) = Net Income / Average Stockholders' Equity (5) Net profit ratio (NPR) = Net Profit/Net Sales
(6) Operating margin ratio (OMR) = Operating profit/Net sales Liquidity Ratios
(7) Current Ratio (CR) = Current Assets / Current Liabilities (8) Acid Test Ratio (ATR) = Quick Assets / Current Liabilities
(9) Cash Ratio (CashR) = ( Cash + Marketable Securities ) / Current Liabilities (10) Net Working Capital (NWC) = Current Assets - Current Liabilities Management Efficiency Ratios
(11) Receivable Turnover (RTDebtor) = Net Credit Sales / Average Accounts Receivable (12) Days Sales Outstanding (DS) = 360 Days / Receivable Turnover
(13) Inventory Turnover (ITInventory) = Cost of Sales / Average Inventory (14) Days Inventory Outstanding (DIOS) = 360 Days / Inventory Turnover (15) Days Payable Outstanding (DPOS) = 360 Days / Accounts Payable Turnover (16) Operating Cycle (OC) = Days Inventory Outstanding + Days Sales Outstanding (17) Cash Conversion Cycle (CCC) = Operating Cycle - Days Payable Outstanding (18) Total Asset Turnover Ratio (TATR) = Net Sales / Average Total Assets Leverage Ratios
(19) Debt Ratio (DR) = Total Liabilities / Total Assets (20) Equity Ratio (ER) = Total Equity / Total Assets
(21) Debt-Equity Ratio (DER) = Total Liabilities / Total Equity (22) Times InterestEarned (TIE) = EBIT / Interest Expense Valuation and Growth Ratios
(23) Earnings per Share (EPS) = (Net Income - Preferred Dividends) / Average Common Shares Outstanding
(24) Price-Earnings Ratio (PE) = Market Price per Share / Earnings per Share (25) Dividend Pay-out Ratio (DPR) = Dividend per Share / Earnings per Share (26) Dividend Yield Ratio (DYR) = Dividend per Share / Market Price per Share (27) Book Value per Share (BVP) = Common SHE / Average Common Shares Inventory Ratios
(28) Inventory to sales (IOS) = Inventory / Sales
(29) Inventory to Total Assests (IOTA) = Inventory / Total Assets (30) Taxes to Sales(TS) = Total Tax / Sales
3.3 T-Statistic
For identifying significant and important financial ratios that can help in classification of FFS and Non-FFS companies, t-test was applied using dummy variable of 0 for FFS and 1 for Non-FFS companies. Furthermore, total 10 financial variables found significant for identifying FFS companies. Hence, these 10 financial variables namely ROA, ROSF, NWC, DIOS, DPOS, TATR, ER, EPS, BVP and APT were used for model development using data mining techniques.
3.4 Data Mining
Data mining is a statistical technique to find hidden and interesting pattern from the database or data warehouse. It is categorized into two broad categories: Descriptive data mining technique and Predictive data mining technique. Descriptive data mining technique finds patterns from the large database that are human interpretable. Clustering, Association rule discovery and Sequential Pattern discovery are descriptive data mining techniques. Predictive data mining technique finds group of an attribute with the help of independent variables under consideration. For this study, researcher has selected predictive data mining and particularly classification techniques namely Bayes network, J48 decision tree induction and Multilayer Perceptron. For all these models, accuracy, sensitivity, specificity, precision and time taken were calculated. Finally, based on area under the receiver operating characteristic curve (AUC) score best model was identified.
Accuracy of model indicates percent of companies that are correctly classified. Sensitivity measure helps in identifying percent of companies that are correctly identified as Non-Fraud companies from total Non-Fraud sample. At the same time, specificity identifying percent of companies that are correctly identified as Fraud companies from total Fraud sample. Time taken by model indicates lag of model in classification. And how much weight to correctness of classification given in model is explained as precision. Area under the receiver operating characteristic curve (AUC) is calculated using 10 iteration of data set under consideration.
3.5 Decision Tree Induction
Flow chart-like tree structure is used in decision tree where each node shown internally (non-leaf node) indicating a test on a variables. Then each branch reflects possible outcome of the variable under consideration. Each outside node (or leaf node) holds a label for the class. The top most or root node in a tree helps in solving the detection problem using decision trees is a two step process:
Step 1: Construct a Decision Tree using training data with appropriate modeling (in our case J48) Step 2: Testing the trained model by testing data
For variables selection for branching the tree 3 attribute selection methods namely gini index, gain ratio and information gain can be used.
3.6 Neural Network
Set of nodes (neurons/units) connected by links will create Neural Network which helps in identifying group or class of data set. This links have a weight for consideration and every neuron have input links. Again set of output links to other neuron used for activation of function to compute the activation level for the next step.Each neuron receives signals from connected neurons and the combined input signal is calculated. The input signal of neuron j is
Uj = Sum of (wij * xi), Where,
xi = Input signal from neuron i and
wji = Weight of the connection between neuron i and neuron j.
In case combined signal strength for input exceeds a threshold, transfer function of the neuron is transformed the value of input and then to neuron fires finally (Han & Camber, 2000). In Network with layer forms neurons are arranged. With some hidden layers in between at least one input and one output layer are arranged. After defining the network architecture, the network model is trained.
3.7 Bayes Network
Bayes Network is a statistical classifier. It do not only indicate categories but also helps in predicting the probability of data sets belongs to a particular class. If X be a data point and H be some hypothesis, such that the data set X belongs to specified class C then the probability that the hypothesis holds is
Probability (H/for X) = Probability (X/ for H) * Probability (H) / Probability (X)
4. EXPERIMENT AND RESULT ANALYSIS
The dataset of total 178 companies particularly 92 having Non-fraud financial statement and 86 having fraudulent financial statement were taken from BSE with 31 financial ratios. For taking only significant variables, researcher had applied t-statistic. As shown in table 2, researcher found total 10 significant variables.
Table 2: t-test for identify significant variables
Name of Variable t-value p-value Name of Variable t-value p-value
GPR -0.915 0.363 CCC 0.257 0.797
ROA 2.375 0.019* TATR 2.256 0.025*
ROS -0.863 0.391 DR -1.150 0.252
ROSF 2.736 0.007* ER 2.820 0.006*
NPR 1.668 0.099 DER 0.924 0.357
OMR -0.971 0.334 TIE 1.575 0.119
CR 1.291 0.198 EPS 2.746 0.007*
ATR 1.370 0.172 PE -0.982 0.327
CashR 1.507 0.135 DPR 1.224 0.222
NWC -2.206 0.030* DYR 1.463 0.145
RTDebtor 0.018 0.985 BVP 2.901 0.004*
DS -0.018 0.986 IOS -1.433 0.156
ITInvetory -0.911 0.365 IOTA -1.031 0.306
DIOS -4.722 0.000* TS -0.816 0.415
DPOS -2.443 0.016* APT 3.411 0.001*
OC -0.154 0.877
* Significant at 5 percent
10 fold cross validation was used for validating purpose. In 10-fold cross-validation, the initial data are randomly partitioned into k mutually exclusive subsets or “folds”, D1, D2, D3….Dk, each of equal size. Then training and testing was performed 10 times. In first iteration, partition D1 was reserved for test set and remaining partitions were used for training the model. In second iteration, partition D2 was used as test set and remaining partitions were used for training the model. This procedure was repeated for 10 times.
As shown in Table 3, Bayes Network correctly classifies 77.52% (=138/178) of the total data sample. The false positive rate for non-fraudulent cases was 30.23% (=26/86) and the false negative rate for fraudulent cases was 15.22% (=14/92). Sensitivity measure of the model for NF company was 84.78% (=78/92) and specificity measure of the model F company was 69.76% (=60/86). Precision of the model was 75% and time taken by the model is 0.05 seconds.
Table-3: Confusion Matrix for Bayes Network Model Predicted
/ Actual
NF F
NF 78 (Correct) 14 (Error)
F 26 (Error) 60 (Correct)
NF = Non-fraud and F = Fraud
As shown in Table 4, Multilayer Perceptron correctly classifies 75.28% (=134/178) of the total data sample. The false positive rate for Non-fraudulent cases was 16.32% (=16/86) and the false negative rate for fraudulent cases was 30.43% (=28/92). Sensitivity measure of the model for NF company was 69.56% (=64/92) and specificity measure of the model for F company was 81.39% (=70/86). Precision of the model is 80% and time taken by the model was 0.83 seconds.
Table-4: Confusion Matrix for Multilayer Percepton Model Predicted
/ Actual
NF F
NF 64 (Correct) 28 (Error)
F 16 (Error) 70 (Correct)
NF = Non-fraud and F = Fraud
As shown in Table 5, J48 Decision tree correctly classifies 70.78% (=126/178) of the total data sample. The false positive rate for Non-fraudulent cases was 26.74% (=23/86) and the false negative rate for fraudulent cases was 31.52% (=29/92). Sensitivity measure of the model for NF company was 68.47% (=63/92) and specificity measure of the model for F company was 73.25% (=63/86). Precision of the model was 73.25% and time taken by the model is 0.03 seconds.
Table-5: Confusion Matrix for J48 Decision Tree Predicted
/ Actual
NF F
NF = Non-fraud and F = Fraud
As shown in Figure 1, J48 decision tree helps in establishing step by step mechanism for identifying fraudulent companies. First up most important ration as per decision tree is BVP. If BVP less than 0.9 then there is very high chances that company is reporting FFS.
Otherwise, decision tree leads further to identify second most important financial ratio check that is ROA in J48 decision tree. All steps for identifying FFS and Non-FFS companies using J48 decision tree is shown diagrammatically in figure 1 as shown in next page.
Figure 1: J48 Decision Tree
Source: Author compiled using Weka 3.8
5. CONCLUSION:
With above analysis, and using 10-fold cross validation accuracy, sensitivity, specificity, precision, AUC and time taken were summarized in Table 6. Based on Table 6 summary best data mining model was identified.
Table 6: Summary of Results
Grouping Model Accuracy Sensitivity Specificity Precision AUC Time Taken
Bayes Network 77.52% 84.78% 69.76% 75% 8462 0.05 sec
Multilayer Perceptron 75.28% 69.56% 81.39% 80% 7913 0.83 sec
J48 Decision Tree 70.78% 68.47% 73.25% 73.25% 7058 0.03 sec
Source: Author Compiled
However, as shown in result none of the model helps with 100 percent accuracy or precision. Hence, this data mining technique only can support the auditors for early signaling about possible fraud. But for confirm the same; it is compulsory to cross check at second level for the purpose of any preventing steps.
6. REFERENCES:
[1] Ata, H. A. and Seyrek, I. H. (2009), “The use of data mining techniques in detecting fraudulent financial statements: An application on manufacturing firms”, Suleyman Demirel Universitesi İktisadi ve İdari Bilimler Fakultesi Dergisi, 14(2)
[2] Bell, T. B. and Carcello, J. V. (2000), “A decision aid for assessing the likelihood of fraudulent financial reporting”, Auditing: A Journal of Practice & Theory, 19(1), pp 169-184
[3] Eining, M. M.; Jones, D. R. and Loebbecke, J. K. (1997), “Reliance on decision aids: an examination of auditors’ assessment of management fraud”, Auditing: A Journal of Practice and Theory, 16(2), pp 1–19
[4] Elkan, C. (2001), “Magical thinking in data mining: lessons from CoIL challenge 2000”, In proceeding of KDD-2001, pp 426-431
[5] Fanning K and Cogger K. (1998), “Neural network detection of management fraud using published financial data”, International Journal of System and
Account Finance Management, 7(1), pp 21–24
[6] Green, B. P. and Choi, J. H. (1997), “Assessing the risk of management fraud through neural network technology”, Auditing, 16(1), p 14
[7] Kirkos, E.; Spathis, C. and Manolopoulos, Y. (2007), “Data mining techniques for the detection of fraudulent financial statements”, Expert systems with applications, 32(4), pp 995-1003
[8] Ravisankar, P.; Ravi, V.; Rao, G. R. and Bose, I. (2011), “Detection of financial statement fraud and feature selection using data mining techniques”, Decision Support Systems, 50(2), pp 491-500
[9] Thorton, Grant (2016), “Financial and Corporate Fraud”, ASSOCHAM report
[10] Wells, J. T. (1997), “Occupational fraud and abuse”, Obsidian Publishing Company, Nottingham