R E S E A R C H
Open Access
Inter-tissue coexpression network analysis
reveals
DPP4
as an important gene in heart
to blood communication
Quan Long
1,2†, Carmen Argmann
1,2†, Sander M. Houten
1, Tao Huang
1,2, Siwu Peng
1, Yong Zhao
1,2, Zhidong Tu
1,2,
The GTEx Consortium and Jun Zhu
1,2*Abstract
Background:Inter-tissue molecular interactions are critical to the function and behavior of biological systems in multicellular organisms, but systematic studies of interactions between tissues are lacking. Also, existing studies of inter-tissue interactions are based on direct gene expression correlations, which can’t distinguish correlations due to common genetic architectures versus biochemical or molecular signal exchange between tissues.
Methods:We developed a novel strategy to study inter-tissue interaction by removing effects of genetic regulation of gene expression (genetic decorrelation). We applied our method to the comprehensive atlas of gene expression across nine human tissues in the Genotype-Tissue Expression (GTEx) project to generate novel genetically decorrelated inter-tissue networks. From this we derived modules of genes important in inter-tissue interactions that are likely driven by biological signal exchange instead of their common genetic basis. Importantly we highlighted communication between tissues and elucidated gene activities in one tissue inducing gene expression changes in others. Results:We reveal global unidirectional inter-tissue coordination of specific biological pathways such as protein synthesis. Using our data, we highlighted a clinically relevant example whereby heart expression ofDPP4was coordinated with a gene expression signature characteristic for whole blood proliferation, potentially impacting peripheral stem cell mobilization. We also showed that expression of the poorly characterizedFOCADin heart correlated with protein biosynthetic processes in the lung.
Conclusions:In summary, this is the first resource of human multi-tissue networks enabling the investigation of molecular inter-tissue interactions. With the networks in hand, we may systematically design combination therapies that simultaneously target multiple tissues or pinpoint potential side effects of a drug in other tissues.
Background
Tissues in multicellular organisms do not operate in isolation, but interact with other tissues and organ systems. Examples include the control of adrenal glucocorticoid secretion by the hypothalamic-pituitary-adrenal axis and the regulation of glucose homeostasis by the endocrine pancreas. Although abundant large-scale data on protein–protein interactions and gene–gene
interactions [1–3] in single tissues have been reported, large scale unbiased interactions across tissues are currently less well characterized. An unbiased picture of interactions between tissues in humans will provide essen-tial insights into human biology in health and disease and further assist in the development of treatments for com-plex disease. For example, therapeutically targeting a gene in one tissue may cause side effects or beneficial effects in distant tissues. Therefore, a systematic method of unco-vering tissue–tissue interactions in an unbiased way is ur-gently needed.
Previously we reported an inter-tissue view of obesity in mice with respect to molecular states that are associ-ated with physiological states using gene expression in adipose, liver and hypothalamus from an F2 progeny [4]. * Correspondence:[email protected]
†Equal contributors
1
Department of Genetics and Genomic Sciences, Icahn School of Medicine at Mount Sinai, New York, NY 10029, USA
2
Icahn Institute of Genomics and Multiscale Biology, Icahn School of Medicine at Mount Sinai, New York, NY 10029, USA
Currently, the overall picture of tissue–tissue interac-tions at the transcriptional level in healthy humans
re-mains unknown. The Genotype-Tissue Expression
(GTEx) project [5] aims to create a comprehensive pub-lic atlas of gene expression and its regulation across multiple human tissues. This project aims to release genotype and transcriptome data generated by RNA-Seq in more than 30 tissues of approximately 900 post-mortem donors [6]. In its pilot phase, expression data for nine tissues from 185 subjects are available. In this dataset, multiple tissues have been profiled within each subject, enabling us to perform an tissue inter-action analysis (Additional file 1). To our knowledge this is the first comprehensive resource of multi-tissue hu-man expression data enabling the investigation of mo-lecular tissue–tissue interactions in healthy people.
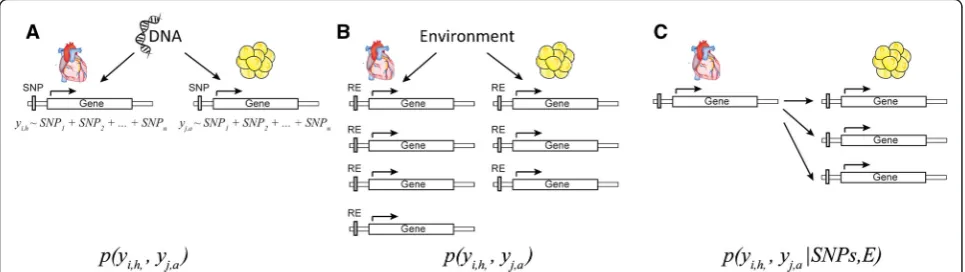
In this study, we aim to distinguish between inter-tissue interactions caused by different factors (Fig. 1). Expression levels of two genes in two tissues, e.g.,yi,hfor
gene i in the heart, andyj,a for gene jin adipose tissue,
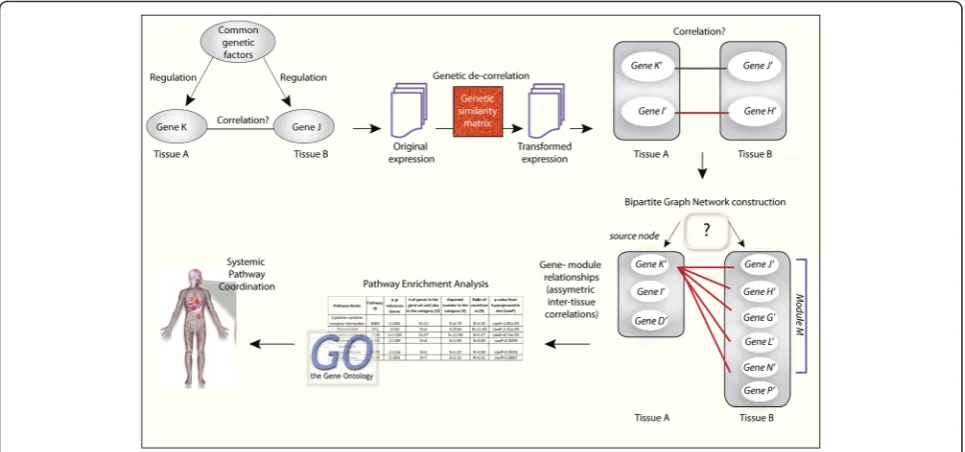
are correlated because they are regulated independently by the same genetic locus (Fig. 1a), or they respond in-dependently to the same environmental cues (Fig. 1b), or gene i in the heart signals to the adipose and regu-lates expression of genej(Fig. 1c). Transcriptional regu-lation of gene expression in different tissues by common genetic or environmental perturbations has been well studied [7]. A comparison of co-expression modules of genes within individual tissues has revealed conservation of biological pathways responding to common genetic or environmental signals [8–10]. However, signaling be-tween tissues via biological signals that regulate tran-scription has not been extensively studied. Here we developed a novel strategy for generating a global view of tissue–tissue interactions at the transcriptional level (Fig. 2). To derive modules of genes important in inter-tissue interactions that are driven by bio-logical signal exchanges instead of their common genetic
basis, we performed a genetic-decorrelated tissue–tissue coexpression (gdTTC) network analysis for all pairs of tis-sues. Genetic decorrelation is a method to remove all gen-etic contribution fromyi,aby regression yi,a∼SNPS+yi,a*.
The resulting yi,a *
is expected to be independent from genetic regulation. Following the genetic decorrelation of all gene expression data, we performed standard bipartite clustering in order to identify clusters of genes and derived biological insight related to the inter-tissue correlations. To dissect sub-clusters within a cluster, we developed a selection algorithm for iden-tifying asymmetric inter-tissue interactions, called gene-to-module detection, to find sub-clusters regu-lated by a few genes noted as key regulators and their biological function.
Here we provide an unbiased global view of the asym-metric molecular interactions between pairs of nine hu-man tissues, which reflect biological processes that are being communicated and coordinated amongst tissues rather than common responses to genetic variations. We show that some pathways, such as the“establishment of protein localization to organelle” and “translational initiation”, are the most prevalent pathways observed amongst all asymmetric inter-tissue coexpression net-works identified. On the other extreme is the observa-tion that a wide variety of pathways are found enriched only in asymmetric inter-tissue coexpression networks between a single pair of tissues. Our tissue–tissue coex-pression network analysis revealed novel asymmetric inter-tissue interactions of which we highlight two. As a clinically relevant example, we show an asymmetric inter-tissue sub-network whereby heart DPP4 is coex-pressed with a module of cell cycle-related genes in whole blood, suggesting DPP4 expression in the heart coordinates whole blood proliferation, thereby poten-tially regulating stem cell trafficking and mobilization to peripheral tissues. As a second example, we show that expression of the poorly characterized FOCAD in the
heart correlates with protein biosynthetic processes in the lung.
Methods Biospecimens
Tissue samples collected in the GTEx pilot study [5] were from 237 post-mortem donors. A full description can be found in the Supplementary Materials of the GTEx pilot study [5]. Briefly, sampled tissues were pre-served in PAXgene® tissue kits (PreAnalytiX®). Samples were fixed for a minimum of 2–4 hours, and then placed in the stabilizer buffer for shipping to the GTEx Comprehensive Biospecimen Resource (CBR). The mean sample ischemic time was around 420 minutes [5]. Supporting quality documents and workflows for the project are available at http://biospecimens.cancer.gov/ resources/sops/default.asp.
Note that tissues collected in the GTEx study are post-mortem. Melé et al. [11] show that gene expression pro-files in the GTEx study are similar to the propro-files of corresponding tissues from living donors, and tissue pro-file classifiers based on propro-files in the GTEx study can accurately classify expression profiles of tissues from liv-ing donors in multiple independent studies. Melé et al. [11] also show that sample ischemic time in the GTEx
study has a small impact on gene expression but a larger impact on splicing.
RNA sequencing
Total RNA was isolated from PAXgene® tubes using proper Qiagen kits following the manufacture's specifi-cation. Detailed experimental procedures for blood, PAXGene-preserved, and frozen tissue samples can be found in the Supplementary Materials of the GTEx pilot study [5]. All samples sequenced had a RNA integrity number (RIN) value of 6.0 or higher and at least 1μg of total RNA.
RNA sequencing was performed using a standard non-strand specific protocol with poly-A selection of
mRNA. Non-strand-specific RNA sequencing was
performed at the Broad Institute using a large-scale,
automated variant of the Illumina Tru Seq™ RNA
Sample Preparation protocol (Illumina: TruSeq Protocol Info). Detailed experimental procedures can be found in the Supplementary Materials of the GTEx pilot study [5].
RNA-seq data were aligned with TopHat version v1.4.1 to the UCSC human genome release version hg19 (Genome Reference Consortium GRCh37). Gencode version 12 was used as a transcriptome model for the
alignment as well as all gene and isoform quantifications. Unaligned reads were merged back in to create a final bam. Gencode v12 annotates a total of 53,934 genes, including 20,110 protein coding genes, 11,790 long non-coding RNAs (lncRNAs), and 12,869 pseudogenes. Ex-pression levels were produced at the gene level in RPKM units using RNA-SeQC. Samples with fewer than 10 mil-lion mapped reads were removed.
Data availability
All primary sequence and clinical data files, and any other protected data, are deposited in and available from dbGaP (http://www.ncbi.nlm.nih.gov/gap) (phs000424).
RNAseq data preprocessing
The RNAseq data used for the analyses described in this manuscript were obtained from dbGaP (accession num-ber phs000424.v2.p1) in Feb 2014. It is common practice to adjust known and hidden confounding factors in gene expression data before further analysis [12]. We used PEER factors [13] to represent hidden confounding fac-tors. While removing too many PEER factors increases the risk of filtering out genuine biological signals, adjust-ing too few PEER factors will obscure interestadjust-ing discov-eries with experimental covariates. To address this problem, we developed a systematic method to quantify the reasonable numbers of PEER factors to be adjusted in each tissue with respect to the optimal gene ontology (GO) enrichment (Notes and Figure S1 in Additional file 2). Many genes had low expression levels and low variances due to zero-valued expression levels in many subjects. As these genes may introduce artifi-cially high correlations between them we removed genes in a tissue expression data set if their standard deviations were smaller than 20 % of the difference between their maximal and minimal expression levels.
Decorrelating genetic components of gene expression Using the standard mixed model notations, a gene expres-sion level (e.g., genei) in a given tissue (e.g., tissueA) can be modeled as Yi,A=β0+ ug+ε, where ug is the
ran-dom term representing the contribution from a large number of loci of small effects and ε is the residual representing other contributions. It is assumed that the total variance was normalized to be one, and both terms follow multivariate normal distribution. More specifically, we assume that ε~ N(0, (1−hi,A)I), and
ug~ N(0, hi,AKg), where I is the identity matrix andKgthe
kinship matrix estimated from the genotypes using stand-ard procedure calculating Realized Relationship Matrix [14, 15]: therth column andsth row of the matrix (that is, the similarity of rth andsth subject) is calculated by the
formula Kg rð Þ;s ¼L1
XL
l¼1
gl;r−pl
gl;s−pl
1−pl
ð Þpl
, where Lis the
number of available SNPs,plis the allele frequency of the
SNPl, andgl,ris the genotype coded as 0, 1, and 2,
corre-sponding to homozygote, heterozygote, and the other
homozygote. Here hi;A¼
V arð Þμg V arð Þμg þV arð Þε
is the variance
component of expression level of gene i in tissue Athat can be explained by genotype, a parameter referred to as “pseudo-heritability” in mixed model literals. We used FaST-LMM method to estimate hi,A [14]. After the key
parameter hi,A has been estimated, we defined the
Cholesky decomposition matrix D in the same way as Kang et al. [16]: D¼U−12 h
i;ASþI
, where U is the eigenvector matrix of Kg, and S is the diagnose matrix
formed by eigenvalues ofKg. Applying this matrix on the
expression data yields transformed expression data for which the genetic contributions are decorrelated. More precisely, we calculate the transformed data by applying transformation Yi,A*= DYi,A. Similarly, we generatedY*j,B
following the same procedure.
As Yi,A is adjusted for all potential environmental
covariants, and Y*i,A and Y*j,B contain no contribution
from covariance of genome similarity, the inter-tissue interaction represented as a Spearman correlation Corr(Y*i,A, Y*j,B)is likely driven by biological regulation.
Pvalues and false discovery rate estimation of the
correlations
Following the standard method, for any given Spearman correlationrwith sample sizen, we calculated at-statistic using the formula t¼rpffiffiffiffiffiffiffiffiffiffiffiffiffiffiffiffiffiffiffiffiffiffiffiffiffiffiffiðn−2Þ=ð1−r2Þ. Assuming that it
Inter-tissue network generation
A natural way to find clusters in two groups of nodes is to use bipartite clustering [17], an established technique in the field of machine learning. We implemented a standard bipartite clustering algorithm using singular values decomposition [17]. However, when applying GO enrichment analysis for the genes in the partitioned clus-ters, we found no significant enrichment. A bipartite clustering method aims to find balanced clusters in the two groups of nodes. However, inter-tissue interactions may not be bi-directional, where a large number of genes in tissue A correlate with a group of genes in tis-sue B, but rather unidirectional, where a small number of genes in tissue A interact with a large number of genes in tissue B. We developed the following procedure to identify unidirectional interactions.
Gene-to-module interactions
Given a tissue pairAandB, we define a set of genes for each gene iA in tissue A, namely MiA;B, representing genes in tissue Bthat are correlated with the geneiA in
tissue A. Then, we define significant asymmetry cor-relation sets as follows. First, we calculate the total number of genes in tissue A that are correlated with any of the members in M (in tissue B) as X
JB∈MiA;B MJB;A
and the average number of genes for members in
MiA;B as AMiA;B¼ X
JB∈MiA;B MJB;A
MiA;B . If MiA;B is less than one-tenth of MiA;B, we define the set MiA;B as a date asymmetry set. Second, we check whether candi-date asymmetric inter-tissue correlations MiA;B are due to potential common regulations in a single tis-sue. For the same gene i in tissue B, we define MiA;B as an asymmetric set if MiA;B is less than one-tenth of the size of MiA;B. The significance of a module of size
MiA;B
can be approximately estimated using binomial
models. For each pair of tissues, we calculate the average number genes that each gene was correlated with. Then, according to the size of a module, we estimate the p value of observing a module of the same size by chance. Thepvalues for modules of sizemin each tissue pair is listed in Table S2b in Additional file 3.
Enrichment analysis
We used Bioconductor [18] to carry out the GO bio-logical process (GOBP) enrichment analysis. We applied the hypergeometric test using the annotation database “org.Hs.eg.db”. Thepvalue cutoff used was 0.05 dividing the number of GOBPs tested in the corresponding tissue pairs. Since the GOBPs are hierarchically organized in a tree-like structure, terms at different levels of the tree
are not comparable. We counted the number of terms in the path from the root as the “level” of each GO term and used only level 3 GO terms. We also
applied the hypergeometric test for enrichment
analysis using the disease GWAS candidate gene catalog (http://www.genome.gov/gwastudies/) and disease signature database. MSigDB (http://www.broadinstitu te.org/gsea/msigdb/index.jsp) and multiple Human tissue atlas expression profile datasets were used to generate the heat map of the expression levels of the genes in whole blood that correlated with heart DPP4 expression levels [19, 20].
Results and discussion
Genetic decorrelation of GTEx data and construction of inter-tissue coexpression networks
All gene expression data used in this analysis were pre-processed to correct for common confounders such as batch effects and experimental artifacts by adjusting for factors estimated using the probabilistic estimation of expression residuals (PEER) method [13]. After correct-ing for the PEER factors and filtercorrect-ing lowly expressed genes, we calculated the Spearman correlation for each gene pair between the nine surveyed tissues. In total, there are 9 × 8⁄2 = 36 tissue pairs, and for each tissue pair we calculated around 20,000 × 20,000 correlations be-tween gene pairs. An inter-tissue interaction was defined as a pair of genes whose correlations both before and after genetic decorrelation are significant (see "Methods" for details).
variance component explained by the genome similar-ities [22, 23]. Then we used the estimated heritability to create a transformation matrix for removing genetic regulation from the expression data so that, in theory, the data, after transformation, contain minimal genetic contributions. This procedure is commonly used in mixed models [16, 24] and is described in detail in the "Methods" section.
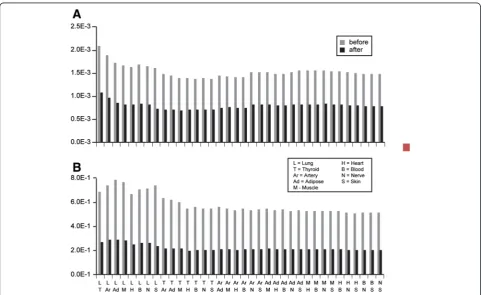
After genetic decorrelation, cross-tissue gene–gene correlations were calculated again following the same procedure described above. We usedRandR to repre-sent correlation matrices before and after genetic decorr-elation. To evaluate whether the genetic decorrelation procedure effectively removed the genetic component from the data we applied two different tests. First, we compared the shared eQTLs between cross-tissue corre-lated gene pairs. Given a pair of tissues, we calcucorre-lated the average number of shared eQTLs (as described in the GTEx pilot analysis [5]) of all pairs of genes that were significantly correlated. By comparing this indicator before and after decorrelating genetic effects, we ob-served that the average number of shared eQTLs decreased dramatically after transformation (Fig. 3a). Secondly, we compared the correlation between pairs of
identical genes in two tissues before and after genetic decorrelation. The genetic architecture of transcriptional regulators for the same gene in different tissues is simi-lar such that common genetic regulation likely contrib-utes to the correlation of expression of the same gene in different tissues. We observed that this proportion was also significantly reduced after applying the ation (Fig. 3b). Thus, we conclude that our transform-ation procedure removed a significant portion of the genetic contribution to the correlation of gene expres-sion between tissues.
In some cases, the mixed model-based transformation can also introduce artifacts such as when the pseudo-heritability of two genes is similar. In these instances, their transformation matrix will be alike and could therefore generate artificial correlations. Also, since the sample size of the shared tissue pairs is low (Additional file 1), the variance of the estimate of pseudo-heritability, which is proportional to the sample size, can be large. In order to filter out potential artificial correla-tions introduced by genetic decorrelation, we adopted the following conservative rule: two genes from two tis-sues are defined as inter-tissue correlated if and only if they are significantly correlated with each another before
and after the transformation. These inter-tissue correla-tions are most likely due to biological signals instead of common genetics.
A global overview of the patterns of inter-tissue coexpressed genes
Given the correlation matrix R calculated above, for each pair of tissues we constructed inter-tissue coexpres-sion networks as bipartite graphs. In these graphs, the nodes in two columns are the genes in the two tissues, and an edge between two nodes is added if they are inter-tissue correlated. To assess a global pattern of inter-tissue coexpressed genes we examined the total number of significant gene–gene correlations between each tissue pair, which provided an estimate of the de-gree of potential biological interactions between tissues (Fig. 4a). Among the top five pairs of tissue were nerve and heart, with nerve in combination with heart, adipose and thyroid, and heart in combination with nerve, thy-roid and adipose. Given that the function of nerves within the nervous system is to send signals from one part of the body to another and to receive feedback in
order to coordinate motor and sensory responses, it is not surprising to observe a significant number of inter-tissue correlations involving the tibial nerve. Similarly, given the intimate connection between the heart and the circulation, which delivers blood to all parts of the body, observing a significant number of inter-tissue coexpres-sions is expected. In contrast, the lung was the most prominent in tissue pairs scoring the lowest number of inter-tissue correlations in combination with skin, whole blood and muscle.
Identification of asymmetric inter-tissue correlation patterns
Gene clusters derived using a standard bipartite cluster-ing algorithm [17] were not significantly enriched in any GOBP. A standard bipartite clustering aims to find a cluster of genes interacting with another cluster of genes in the second tissue. However, cross-tissue interactions may be unidirectional, e.g., a few genes in one tissue regulate many genes in another tissue. Thus, we devel-oped a selection strategy for identifying asymmetric inter-tissue correlation patterns. For each individual
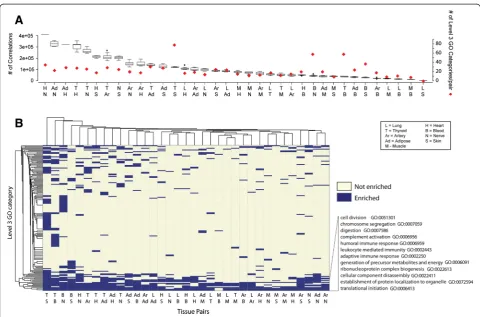
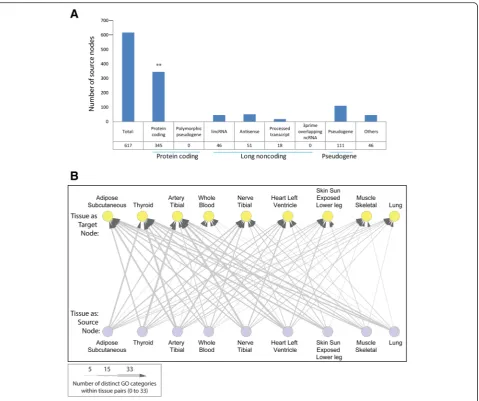
Fig. 4Functional annotation of inter-tissue correlations.aSummary of the number of correlations between tissue pairs (left axis) and summary of the number of significant GOBPs associated with the asymmetric inter-tissue correlations (gene-to-module relationships) per tissue pair (right axis).
gene we assessed whether there was a large cluster of genes in another tissue asymmetrically linked with it, which were referred to as gene-to-module relationships (Fig. 2). The numbers of gene-to-module relationships identified in each pair of tissues are listed in Additional file 4. We then performed GO enrichment analysis on the top 20 most significant gene-to-module relationships to infer which biological pathways are involved in inter-tissue interactions. The complete set of significantly enriched pathways is listed in Additional file 5. It is worth noting that the total number of inter-tissue relationships and the number of biological pathways enriched among genes involved in gene-to-module rela-tionships (Fig. 4a) were not related. The tissue pairs with the largest number of enriched level 3 GOBPs, such as thyroid–skin and thyroid–blood, had small numbers of total cross-tissue correlations (Fig. 4a). Thyroid is the tissue where gene expression is most likely to be regu-lated by genetic variation [5] so that genetic decorrela-tion has the largest effect for thyroid expression data. These results indicate that decorrelating genetic effects may facilitate the identification of biological connections between tissues.
The GOBPs associated with the top 20 most signifi-cant gene-to-module relationships according to the tis-sue pairs they were identified in are summarized in Fig. 4b (GO terms used in the analysis are listed in Additional file 6). Some pathways associated with unidir-ectional interactions between tissues were enriched in many tissue pairs while other pathways were only enriched in specific tissue pairs (Fig. 4b). A closer look at the extremes revealed some interesting observations. Most strikingly, four pathways, including establishment of protein localization to organelle, translational initi-ation, cellular component disassembly and ribonucleo-protein complex biogenesis, were identified in almost all tissue pairs, revealing global synchronization of these processes by unidirectional inter-tissue interactions. Since these pathways are related to protein synthesis, our result likely reveals the importance of coordination in growth processes within the human body and that this coordination can be achieved via asymmetric molecular interactions. The joint coordination of protein biology across tissues via asymmetric interactions implies the ex-pression of one gene in one tissue is sufficient to impact clusters of genes related to protein biology in another.
Other pathways that were involved in inter-tissue in-teractions in most tissue pairs included different aspects of the immune responses (complement activation, adap-tive immune response, humoral immune response, leukocyte-mediated immunity), metabolism (generation of precursor metabolites and energy) and cell division.
While these analyses provide information on the num-ber of inter-tissue correlations and the associated
GOBPs, they do not specify the regulators or source nodes (as shown in Fig. 2) of these interactions. We col-lected source nodes of the top ten most significant gene-to-module relationships in each tissue pair, and charac-terized them according to gene types (Fig. 5a). There were a total of 617 source nodes, among which 345 (56 %) source nodes were protein coding genes, significantly higher than the 37 % expected (pvalue = 1.6 × 10⁻²¹). Even though there are more transcripts mapped to pseudogenes than to lncRNAs, there were more lncRNAs than pseudo-genes among source nodes. These results suggest that protein coding genes and lncRNAs play a significant role in inter-tissue communication.
Instead of counting which GOBPs are inter-tissue reg-ulated as shown in Fig. 4, we examined which GOBPs are inter-tissue regulated in a unidirectional way. For each source node we therefore picked only the top sig-nificantly enriched GOBP associated with its gene clus-ter (listed in Additional file 7). We then counted the number of unique GOBPs for each possible tissue pair (Fig. 5b). This revealed that the most biologically diverse interactions are from thyroid to artery. One example of such interactions is the correlation ofHEBP2in thyroid with genes involved in translational elongation in the ar-tery. HEBP2 is a small heme binding protein that poten-tially regulates necrotic cell death and mitochondrial permeability [25]. HEBP2 is universally expressed in all tissues. However, HEBP2 protein expression is high only in thyroid tissue except for male reproductive tissues (http://www.proteinatlas.org/ENSG00000051620-HEBP2/tissue), suggesting a potential role of HEBP2 in thyroid. Other prominent interactions are from heart to artery, artery to thyroid and nerve to artery. An example of the former interaction is the correlation of SRPX2 in heart to genes associated with the respiratory electron transport chain in artery.SRPX2encodes a secreted pro-tein containing sushi repeat domains that can mediate angiogenesis [26].SRPX2also plays a role in synapse for-mation and vocalization in mice and mutations inSRPX2 have been identified in disorders of language cortex and cognition [27, 28].
These results suggest that multiple biological processes are systemically coordinated via unidirectional interac-tions between tissues. In an effort to demonstrate the utility of inter-tissue coexpression in yielding novel bio-logical insights, we highlight in the following section two asymmetric inter-tissue correlation patterns, one related to a prominent anti-diabetic drug target and another to protein synthesis.
DPP4in the heart is coexpressed with a cell cycle module
in whole blood
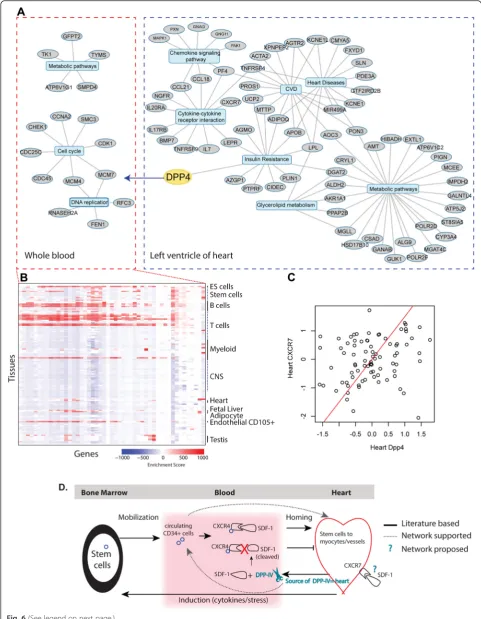
was found significantly coexpressed with a set of genes in peripheral whole blood (Additional file 8), which are enriched for genes involved in cell cycle control and DNA replication (Fig. 6a; detailed in Additional file 9). Interestingly, the majority of the correlations between heart DPP4 and the whole blood genes were negative (Additional file 8), suggesting an inverse relationship be-tween heart DPP4 and these processes. To determine the most representative cell populations associated with the DPP4–whole blood gene set, we compared expres-sion levels of these genes with expresexpres-sion profiles assayed across 126 primary human tissues and cell types in the Gene Enrichment Profiler [29]. Tissue-specific gene expression is summarized by an enrichment score
where high enrichment scores mean higher specificity. A heat map of the enrichment scores for the DPP4 -correlating whole blood gene set reveals that this set of genes is most highly expressed in many proliferat-ing blood cell types, includproliferat-ing embryonic and CD34+ hematopoietic stem cells, preB cells, thymic CD34+ T cells and CD105+ endothelial cells (Fig. 6b; listed in Additional file 10). As correlations between DPP4 in heart and the whole blood gene set are mostly negative (Additional file 8), it suggests that cardiac DPP4 expres-sion is negatively correlated with cell cycle events of mul-tipotent precursor type cells, such as populations of embryonic stem cells, which can differentiate into myeloid progenitor or endothelial progenitor subtypes.
Fig. 5Characteristics of inter-tissue unidirectional relationships.aGene types of source nodes in the top ten most significant gene-to-module relationships in each tissue pair. Protein coding genes were enriched among source nodes (pvalue = 1.6 × 10⁻²¹).bNumbers of unique GOBPs that are inter-tissue regulated in a unidirectional way. For each source node we therefore picked only the top significantly enriched GOBP associated with its gene cluster (listed in Additional file 7). The most biologically diverse interactions are from thyroid to artery.lincRNA
DPP4, also known as CD26, is a serine protease that cleaves selected N-terminal penultimate amino acids and thereby potentially alters the function of a wide number of substrates [30]. DPP4 exists both as a cell surface pro-tein (mDPP4) with fairly ubiquitous expression as well as a soluble form (sDPP4) in body fluids such as plasma, both having enzymatic capabilities. sDPP4 has been mainly linked to the proteolytic cleavage of DPP4 from the cell membrane [31]. About 90–95 % of serum DPP4 activity is associated with circulating DPP4 levels, but the kinetics and regulation of circulating DPP4 levels re-main unclear [32]. Therefore, investigating cross-tissue DPP4 molecular associations could provide valuable insight into DPP4 function in physiology and disease. Thus, DPP4 is an excellent example for investigating inter-tissue coexpression networks, as it provides the bio-logical context to investigate such complex associations.
To further investigate the inter-tissue communication being coordinated by cardiac DPP4 expression and the whole blood compartment, we assessed the coexpression network associated with DPP4 within the heart. This within-tissue coexpression network analysis revealed a set of genes that are highly enriched for cytokine–cytokine receptor interactions as well as lipid-related pathways (Fig. 6c; detailed in Additional file 11). Importantly, these genes are also enriched in diseases such as insulin resist-ance, metabolic syndrome and obesity (Fig. 6c). Thus, heart expression ofDPP4appears to be associating its mo-lecular metabolic state with decreased proliferative events in subsets of whole blood cells. We hypothesize that this reflects altered mobilization of stem cells to the heart re-quired for vascular repair in response to metabolic stresses such as diabetes.
Extensive literature exists on DPP4, mainly due to DPP4 inhibitors or gliptins, a class of oral hypoglycemics commonly used to treat type 2 diabetes [33]. These compounds lower blood glucose via enhancing circu-lating levels of the incretin GLP-1. Thus, we looked to validate our inter-tissue network-driven DPP4 hy-pothesis using existing knowledge. Many studies have
demonstrated that pharmacological inhibition of DPP4 is associated with a beneficial effect on the incidence of cardiovascular events [30]. Multiple mechanisms have been attributed to this phenomenon, including glucose-lowering, but also other direct cardiovascular effects such as anti-thrombotic as well as cardiac re-modeling and inflammation control [34, 35]. This is in part because DPP4 is known to cleave a wide array of bioactive peptides in addition to GLP-1, such as chemokines [36]. Relevant for the validation of our results is the known link between DPP4 activity and molecular signals of hematopoiesis in whole blood, namely that DPP4 is known to cleave and inactivate the stromal cell-derived factor SDF-1 [33, 37].
SDF-1 is a major chemokine regulating stem/progenitor cell trafficking in the bone marrow and tissues [34]. Diabetes and other metabolic disturbances threaten the endothelial layer of the heart, which is critical to maintain cardiac function since endothelial cells have limited proliferative capacity and low proliferation rates trigger atherogenesis. Endothelial restoration depends on the co-ordinated contribution of local endothelial cells and a sub-set of bone-marrow progenitor cells (BM-CD34+ or endothelial progenitor cells) that secrete soluble mediators that also stimulate blood vessel growth and re-endothelial-ization. Diabetes affects the ability of endothelial progeni-tor cells to migrate to the target tissue because it reduces the activity of the chemotractant molecule SDF-1 through maladaptive DPP4-mediated cleavage, thereby blunting the ability of SDF-1 to trigger CXCR4 or CXCR7 down-stream signaling [34, 38]. Our studies suggest that a key ‘source’ of the SDF-1 signal modulating the kinetics of stem/progenitor cells is the expression and activity of DPP4 in the heart. Indeed, body atlas data from BioGPS (http://biogps.org/#goto=genereport&id=1803) showed that the expression level ofDPP4in smooth muscle, car-diac myocytes as well as immune cell types is much higher than that in the whole blood.
Although our study cannot determine whether it is sDPP4 and/or mDPP4 responsible for mediating the
(See figure on previous page.)
cross-tissue coordination, overall our data are supported by observations in the literature [39]. Firstly, diabetes in-duction in a rat model promoted the activation of the membrane-bound form of cardiac DPP4, which resulted in reduced myocardial SDF-1 levels and impaired angio-genesis, a result that could be reversed by genetic and pharmacological ablation of DPP4 [39]. Secondly, in humans, it has been shown that myocardium-derived sDPP4 activity can be assessed in the coronary sinus which also correlates well with DPP4 activity measured in the peripheral vein. Importantly, in patients with dia-stolic hear failure (DHF), peripheral vein activity of DPP4 was associated with measurements of DPP4 in the coronary sinus as well as with indices representing DHF, such that circulating DPP4 may potentially serve as a biomarker for monitoring DHF [39]. Finally, circulating DPP4 activities in both peripheral and coronary sinus in patients with comorbid diabetes were also increased, thus further supporting the importance of DPP4, of which some proportion is cardiac derived.
Interestingly, our data demonstrated a significant cor-relation (p value = 0.02; Fig. 6c) between DPP4 expres-sion in heart and heart expresexpres-sion of CXCR7, a SDF-1 receptor [40] whose expression on the endothelium has been linked to regulation of systemic levels of SDF-1 [38], suggesting that mDPP4 is likely mediating this cross-tissue communication via SDF-1. Thus, overall, our inter-tissue data-driven network approach could recapitulate the known biology, namely that metabolic disturbances of the heart are negatively associated with progenitor cell populations in the blood via DPP4 expression [33] (solid and dashed arrows in Fig. 6d), thus in part validating this novel method-ology. Importantly, our network approach supports that a major contributor to the DPP4 pool is heart, especially under metabolic stress, and that there may be an important role for CXCR7 in co-modulating SDF-1 function (Fig. 6d).
Cardiac expression ofFOCADcorrelated with lung protein
synthetic processes
One example of asymmetric inter-tissue correlations re-lated to protein synthesis is observed for cardiac expres-sion of the poorly characterized FOCAD (KIAA1797 or focadhesin) and the gene set it correlated with in the lung. This set of genes in lung coordinated by FOCAD was enriched for GOBPs related to protein synthesis, such as translational termination, translational elong-ation and SRP-dependent cotranslelong-ational protein target-ing to membrane.
Focadhesin is a ubiquitously expressed gene with highest levels in brain, but appreciable levels in other tissues such as heart. Focadhesin was recently de-scribed as a tumor suppressor in glioblastoma, polyposis
and colorectal cancer [41–43]. The focadhesin protein lo-calizes to the end of actin filaments, where it cololo-calizes with vinculin, a major component of focal adhesions [41]. Moreover, focadhesin physically interacts with vinculin [41, 44]. No function for this gene has been established in the heart.
Focal adhesions are the sites where cells and extracel-lular matrix physically interact. Many proteins constitute the focal adhesion, with the integrins being the link be-tween the cytosol and the extracellular matrix. Integrins function as cell surface receptors, and their interaction with the extracellular matrix enables them to transduce signals from the outside to the cell (“outside-in” signal-ing). In the heart focal adhesions play an important role in the response to biomechanical stress, enabling the myocardium to undergo structural changes [45]. In the GTEx dataset,FOCADexpression in the heart correlates with integrin α5 (ITGA5, r= 0.44, p= 1.34 × 10⁻⁵) and paxillin (PXN,r=0.37, p= 3.12 × 10⁻⁴), further signifying its role in focal adhesion. Our data suggest that signaling at the focal adhesion not only has effects within the tis-sue, but can also affect other tissues, in this case the lung. From a mechanistic point of view, it is known that integrins can also signal to the extracellular matrix (“inside-out” signaling) [46], but how such a signal may be propagated from the heart to the lung is at present unclear.
Our observations are consistent with the close inter-action between heart and lung as both organs share the same restricted space in the chest. Moreover, heart and lung are also functionally connected, such as that the lungs are responsible for the exchange of CO2for O2in
blood, while the heart circulates this blood. This tight connection is illustrated by several pathophysiological conditions whereby one organ can develop a problem that influences the efficiency of the other. For example, in pulmonary arterial hypertension there is an increase in pulmonary vascular resistance directly impacting on the right ventricle [47]. Chronic heart failure is associ-ated with mild to moderate changes in pulmonary function [48].
Other evidence supporting a role forFOCAD in heart and lung comes from several genome-wide association
studies (GWAS) since variants in FOCAD have been
associated with cardiac as well as pulmonary traits. SNPs in FOCAD have been associated with heart rate in American Indians [49], and heart failure in the
STAMPEED study [50]. A SNP in FOCAD also
Inter-tissue module and disease GWAS candidate genes
Although our DPP4 and FOCADexamples above have
relevancy to disease, as DPP4 is a target of current diabetes therapy and the other gene is a GWAS hit, to generalize the utility of our cross-tissue network analysis on informing on disease association we anno-tated significant inter-tissue gene modules against dis-ease or drug signatures in MSigDB and the catalogue of genes implicated in various GWAS (results listed in Additional file 7). If an inter-tissue gene module is enriched for a GOBP, it is likely enriched for a signa-ture in MSigDB. We also observed 17 gene module pairs from various tissue pairs that were significantly enriched (at Fisher’s exact test p value <0.05/number disease categories) in genes genetically associated with disease. For example, in one adipose to artery gene module where the source node wasANKRD36B (ankyrin repeat domain-containing protein 36B) we found that the genes it correlates with in the artery were signifi-cantly enriched in genes reported to have relevance to Gaucher disease severity in humans. Gaucher dis-ease is associated with a genetic defect in breakdown of complex glycolipids and causes a lysosomal storage disorder. Interestingly, although the function of ANKRD36B is not well defined, it has been identified as a tumor-associated antigen in chronic lymphocytic leukemia (CLL) [52]. Multiple myeloma risk is signifi-cantly increased in Gaucher patients, but CLL has also been reported in patients and perhaps our data shed light on some of the biology associated with en-hanced cancer risk [53]. Another significant GWAS candi-date gene enrichment was found between the artery– whole blood tissue pair, with the source node being
CPLX2 (Complexin 2) and the associated GWAS for
conduct disorder (interaction). Conduct disorder is a prevalent childhood psychiatric condition including a persistent pattern of rule-breaking and aggressive be-havior [54]. Interestingly, CPLX2 is a known modula-tor of neurotransmitter release and has been shown in humans to be decreased in expression in animal models of depression and in humans suffering from depression. CPLX2 knockout mice also have signifi-cant abnormalities in cognitive function and synaptic plasticity [55]. Furthermore, variants of this gene have been found associated with attention deficient hyper-activity disorder [56] and schizophrenia [57] and the module of genes it associated with in blood are enriched for the GO pathway related to transmission
of nerve impulses. Although CPLX2 expression is
considerably high in the brain, bioGPS does suggest ubiquitous expression and one hypothesis from our dataset that could be tested is whether Clpx2 modu-lates release of a signal in the blood that in turn im-pacts on the brain.
Gene expression profiles and sample ischemic time It is known that sample ischemic time impacts on RNA quality, which in turn affects gene expression profiles. RNA quality is quantified as the RNA integrity number (RIN). The RNAseq data preprocessing process removed confounding factors, including sample ischemic time and RINs represented as PEER factors. To specifically check residual effect of sample ischemic time and RINs on the data (after correcting PEER factors) used in this study, we correlated sample ischemic time and RINs with gene expression profiles, and the correlation coeffi-cient distributions were found to be similar to those of the permuted data (Figure S2 in Additional file 2). More specifically, the correlation coefficients between sample ischemic time and heart DPP4 and FOCAD expression levels are 0.07 and 0.04, with corresponding pvalues of 0.28 and 0.35, suggesting that the processes discussed above are not due to ischemic time.
Potential shortcoming
It is worth noting that an asymmetric inter-tissue correl-ation suggests but is not equivalent to a causal–reactive relationship between tissues. Even though in the
ex-ample of heart DPP4 and whole blood expression
changes we highlighted substantial evidence supporting a causal role of heart DPP4, we need to be cautious when assuming causal–reactive relationships in general. Second, the inter-tissue relationships are based on a healthy cohort, which are useful for understanding general communication between tissues. However, the inter-tissue relationships for a specific disease may be different. Multi-tissue profiles from a disease cohort are needed to construct inter-tissue relationships under a disease state. Inter-tissue relationship differences be-tween healthy and disease states may shed light on how multiple tissues together contribute to disease pathogen-esis. Third, the accuracy of the transformation matrixD used in genetic decorrelation depends on the sample size. A large number of samples are needed to robustly estimate the matrix D and to use our inter-tissue ana-lysis based on genetic decorrelation.
Conclusions
DPP4 in the heart are coordinated with whole blood proliferation, thereby potentially regulating stem cell proliferation, trafficking and mobilization to peripheral tissues, an observation important for regenerative medi-cine. More broadly, this is the first resource of human multi-tissue networks enabling the investigation of mo-lecular inter-tissue interactions. With the networks in hand, we may systematically design combination therap-ies that simultaneously target multiple tissues or pin-point potential side effects of a drug in other tissues.
Additional files
Additional file 1: Table S1.Sample sizes of shared subjects for each pair of tissues. (PDF 6 kb)
Additional file 2:Supporting notes. Figure S1.The optimal numbers of principal components (PCs) to correct in each tissue.Figure S2.
Histograms of correlation coefficients between sample ischemic time and RINs with gene expression profiles in nine tissues.Red linesare for correlation with RINs, andblue linesare for correlation with sample ischemic time.Solid linesare for empirical gene expression profiles in the study,dashed linesare for permuted data. (DOCX 500 kb)
Additional file 3: Table S2.Significant scores based on permutation tests.aEstimated FDRs of inter-tissue connection for each tissue pair.
bEmpiricalpvalue for significant gene-to-module interactions in each tissue pair. (XLSX 129 kb)
Additional file 4: Table S3.Number of significant gene-modules identified for each tissue pair. (PDF 42 kb)
Additional file 5: Table S4.Top 20 significant modules in terms of
pvalue of GO enrichment analysis in all tissue pairs. (PDF 2423 kb)
Additional file 6: Table S5.Names and IDs of GO terms used in Fig. 4b. (PDF 11 kb)
Additional file 7: Table S6.Functional annotation of significant inter-tissue gene modules against GO biological processes, disease candidate genes in GWAS catalog, and the molecular signature database (MSigDB). (CSV 387 kb)
Additional file 8: Table S7.A list of genes whose expression in whole blood significantly correlated with cardiacDPP4expression. (XLSX 15 kb)
Additional file 9: Table S8.Full list of KEGG enrichment analysis results for the set of genes that heart DPP4 correlates with in whole blood. (XLSX 10 kb)
Additional file 10: Table S9.The enrichment scores for each of the DPP4-correlating whole blood genes in primary human tissues and cell types. (XLSX 64 kb)
Additional file 11: Table S10.KEGG and disease pathway enrichment analysis for genes that correlate with DPP4 within the heart. (XLSX 16 kb)
Competing interests
The authors declare that there is no competing interest.
Authors’contributions
QL and JZ conceived and designed the experiments. The GTEx Consortium provided the data. QL led the computational analysis. CA led the biological mining of the data, and SMH made a significant contribution to data mining. TH, SP, YZ, and ZT contributed to data analysis and data mining. QL, CA, SMH, and JZ wrote the paper. All authors contributed to the discussion. All authors read and approved the final manuscript.
Acknowledgements
The project was partially funded by NIH grants R01MH090948, U01AG046170, and U01HG008451 (JZ). We thank Dr. Li Wang and Dr. Bin Zhang for fruitful discussions. The Genotype-Tissue Expression (GTEx) Project was supported by the Common Fund of the Office of the Director of the National Institutes of
Health. Additional funds were provided by the NCI, NHGRI, NHLBI, NIDA, NIMH, and NINDS. Donors were enrolled at Biospecimen Source Sites funded by NCI\SAIC-Frederick, Inc. (SAIC-F) subcontracts to the National Disease Research Interchange (10XS170), Roswell Park Cancer Institute (10XS171), and Science Care, Inc. (X10S172). The Laboratory, Data Analysis, and Coordinating Center (LDACC) was funded through a contract (HHSN268201000029C) to The Broad Institute, Inc. Biorepository operations were funded through an SAIC-F subcontract to Van Andel Institute (10ST1035). Additional data repository and project management were provided by SAIC-F (HHSN261200800001E). The Brain Bank was supported by supplements to University of Miami grants DA006227 and DA033684 and to contract N01MH000028. Statistical Methods development grants were made to the University of Geneva (MH090941 and MH101814), the University of Chicago (MH090951, MH090937, MH101820, MH101825), the University of North Carolina - Chapel Hill (MH090936 and MH101819), Harvard University (MH090948), Stanford University (MH101782), Washington University St Louis (MH101810), and the University of Pennsylvania (MH101822).
Received: 6 August 2015 Accepted: 21 January 2016
References
1. Zhu J, Zhang B, Smith EN, Drees B, Brem RB, Kruglyak L, et al. Integrating large-scale functional genomic data to dissect the complexity of yeast regulatory networks. Nat Genet. 2008;40(7):854–61.
2. Gerstein MB, Kundaje A, Hariharan M, Landt SG, Yan KK, Cheng C, et al. Architecture of the human regulatory network derived from ENCODE data. Nature. 2012;489(7414):91–100.
3. Basso K, Margolin AA, Stolovitzky G, Klein U, Dalla-Favera R, Califano A. Reverse engineering of regulatory networks in human B cells. Nat Genet. 2005;37(4):382–90.
4. Dobrin R, Zhu J, Molony C, Argman C, Parrish ML, Carlson S, et al. Multi-tissue coexpression networks reveal unexpected subnetworks associated with disease. Genome Biol. 2009;10(5):R55.
5. GTEX consortium. Human genomics. The Genotype-Tissue Expression (GTEx) pilot analysis: multitissue gene regulation in humans. Science. 2015;348(6235):648–60.
6. The GTEx Consortium. The Genotype-Tissue Expression (GTEx) project. Nat Genet. 2013;45(6):580–5.
7. Gagneur J, Stegle O, Zhu C, Jakob P, Tekkedil MM, Aiyar RS, et al. Genotype-environment interactions reveal causal pathways that mediate genetic effects on phenotype. PLoS Genet. 2013;9(9):e1003803.
8. Zhang B, Horvath S. A general framework for weighted gene co-expression network analysis. Stat Appl Genet Mol Biol. 2005;4:Article17.
9. Chen Y, Zhu J, Lum PY, Yang X, Pinto S, MacNeil DJ, et al. Variations in DNA elucidate molecular networks that cause disease. Nature. 2008;452(7186):429–35.
10. Emilsson V, Thorleifsson G, Zhang B, Leonardson AS, Zink F, Zhu J, et al. Genetics of gene expression and its effect on disease. Nature. 2008;452(7186):423–8.
11. Mele M, Ferreira PG, Reverter F, DeLuca DS, Monlong J, Sammeth M, et al. Human genomics. The human transcriptome across tissues and individuals. Science. 2015;348(6235):660–5.
12. Kang HM, Ye C, Eskin E. Accurate discovery of expression quantitative trait loci under confounding from spurious and genuine regulatory hotspots. Genetics. 2008;180(4):1909–25.
13. Stegle O, Parts L, Piipari M, Winn J, Durbin R. Using probabilistic estimation of expression residuals (PEER) to obtain increased power and interpretability of gene expression analyses. Nat Protoc. 2012;7(3):500–7.
14. Lippert C, Listgarten J, Liu Y, Kadie CM, Davidson RI, Heckerman D. FaST linear mixed models for genome-wide association studies. Nat Methods. 2011;8(10):833–5.
15. Long Q, Zhang Q, Vilhjalmsson BJ, Forai P, Seren U, Nordborg M. JAWAMix5: an out-of-core HDF5-based java implementation of whole-genome association studies using mixed models. Bioinformatics. 2013;29(9):1220–2. 16. Kang HM, Sul JH, Service SK, Zaitlen NA, Kong SY, Freimer NB, et al. Variance
component model to account for sample structure in genome-wide association studies. Nat Genet. 2010;42(4):348–54.
International Conference on Knowledge Discovery and Data Mining: San Francisco, Ca, USA. August 26-29, 2001:269-274.
18. Gentleman RC, Carey VJ, Bates DM, Bolstad B, Dettling M, Dudoit S, et al. Bioconductor: open software development for computational biology and bioinformatics. Genome Biol. 2004;5(10):R80.
19. Liberzon A, Subramanian A, Pinchback R, Thorvaldsdottir H, Tamayo P, Mesirov JP. Molecular signatures database (MSigDB) 3.0. Bioinformatics. 2011;27(12):1739–40.
20. Su AI, Wiltshire T, Batalov S, Lapp H, Ching KA, Block D, et al. A gene atlas of the mouse and human protein-encoding transcriptomes. Proc Natl Acad Sci U S A. 2004;101(16):6062–7.
21. Korte A, Farlow A. The advantages and limitations of trait analysis with GWAS: a review. Plant Methods. 2013;9:29.
22. Yang J, Benyamin B, McEvoy BP, Gordon S, Henders AK, Nyholt DR, et al. Common SNPs explain a large proportion of the heritability for human height. Nat Genet. 2010;42(7):565–9.
23. Yang J, Zaitlen NA, Goddard ME, Visscher PM, Price AL. Advantages and pitfalls in the application of mixed-model association methods. Nat Genet. 2014;46(2):100–6.
24. Segura V, Vilhjalmsson BJ, Platt A, Korte A, Seren U, Long Q, et al. An efficient multi-locus mixed-model approach for genome-wide association studies in structured populations. Nat Genet. 2012;44(7):825–30.
25. Szigeti A, Bellyei S, Gasz B, Boronkai A, Hocsak E, Minik O, et al. Induction of necrotic cell death and mitochondrial permeabilization by heme binding protein 2/SOUL. FEBS Lett. 2006;580(27):6447–54.
26. Miljkovic-Licina M, Hammel P, Garrido-Urbani S, Bradfield PF, Szepetowski P, Imhof BA. Sushi repeat protein X-linked 2, a novel mediator of angiogenesis. FASEB J. 2009;23(12):4105–16.
27. Roll P, Rudolf G, Pereira S, Royer B, Scheffer IE, Massacrier A, et al. SRPX2 mutations in disorders of language cortex and cognition. Hum Mol Genet. 2006;15(7):1195–207.
28. Sia GM, Clem RL, Huganir RL. The human language-associated gene SRPX2 regulates synapse formation and vocalization in mice. Science. 2013;342(6161):987–91.
29. Benita Y, Cao Z, Giallourakis C, Li C, Gardet A, Xavier RJ. Gene enrichment profiles reveal T-cell development, differentiation, and lineage-specific transcription factors including ZBTB25 as a novel NF-AT repressor. Blood. 2010;115(26):5376–84.
30. Zhong J, Rao X, Rajagopalan S. An emerging role of dipeptidyl peptidase 4 (DPP4) beyond glucose control: potential implications in cardiovascular disease. Atherosclerosis. 2013;226(2):305–14.
31. Röhrborn D, Eckel J, Sell H. Shedding of dipeptidyl peptidase 4 is mediated by metalloproteases and up-regulated by hypoxia in human adipocytes and smooth muscle cells. FEBS Lett. 2014;588(21):3870–7.
32. Durinx C, Lambeir AM, Bosmans E, Falmagne JB, Berghmans R, Haemers A, et al. Molecular characterization of dipeptidyl peptidase activity in serum: soluble CD26/dipeptidyl peptidase IV is responsible for the release of X-Pro dipeptides. Eur J Biochem. 2000;267(17):5608–13.
33. Zhong J, Rajagopalan S. Dipeptidyl peptidase-4 regulation of SDF-1/ CXCR4 axis: implications for cardiovascular disease. Front Immunol. 2015;6:477.
34. Fadini GP, Avogaro A. Dipeptidyl peptidase-4 inhibition and vascular repair by mobilization of endogenous stem cells in diabetes and beyond. Atherosclerosis. 2013;229(1):23–9.
35. Pala L, Rotella CM. The role of DPP4 activity in cardiovascular districts: in vivo and in vitro evidence. J Diabetes Res. 2013;2013:590456. 36. Ou X, O’Leary HA, Broxmeyer HE. Implications of DPP4 modification of
proteins that regulate stem/progenitor and more mature cell types. Blood. 2013;122(2):161–9.
37. Christopherson 2nd KW, Hangoc G, Mantel CR, Broxmeyer HE. Modulation of hematopoietic stem cell homing and engraftment by CD26. Science. 2004;305(5686):1000–3.
38. Berahovich RD, Zabel BA, Lewen S, Walters MJ, Ebsworth K, Wang Y, et al. Endothelial expression of CXCR7 and the regulation of systemic CXCL12 levels. Immunology. 2013;141(1):111–22.
39. Shigeta T, Aoyama M, Bando YK, Monji A, Mitsui T, Takatsu M, et al. Dipeptidyl peptidase-4 modulates left ventricular dysfunction in chronic heart failure via angiogenesis-dependent and -independent actions. Circulation. 2012;126(15):1838–51.
40. Chen Q, Zhang M, Li Y, Xu D, Wang Y, Song A, et al. CXCR7 mediates neural progenitor cells migration to CXCL12 independent of CXCR4. Stem Cells. 2015;33(8):2574–85.
41. Brockschmidt A, Trost D, Peterziel H, Zimmermann K, Ehrler M, Grassmann H, et al. KIAA1797/FOCAD encodes a novel focal adhesion protein with tumour suppressor function in gliomas. Brain. 2012;135(Pt 4):1027–41.
42. Weren RD, Venkatachalam R, Cazier JB, Farin HF, Kets CM, de Voer RM, et al. Germline deletions in the tumour suppressor gene FOCAD are associated with polyposis and colorectal cancer development. J Pathol. 2015;236(2):155–64. 43. Horpaopan S, Spier I, Zink AM, Altmuller J, Holzapfel S, Laner A, et al.
Genome-wide CNV analysis in 221 unrelated patients and targeted high-throughput sequencing reveal novel causative candidate genes for colorectal adenomatous polyposis. Int J Cancer. 2015;136(6):E578–89. 44. de Hoog CL, Foster LJ, Mann M. RNA and RNA binding proteins participate
in early stages of cell spreading through spreading initiation centers. Cell. 2004;117(5):649–62.
45. Manso AM, Kang SM, Ross RS. Integrins, focal adhesions, and cardiac fibroblasts. J Investig Med. 2009;57(8):856–60.
46. Shattil SJ, Kim C, Ginsberg MH. The final steps of integrin activation: the end game. Nat Rev Mol Cell Biol. 2010;11(4):288–300.
47. Malenfant S, Neyron AS, Paulin R, Potus F, Meloche J, Provencher S, et al. Signal transduction in the development of pulmonary arterial hypertension. Pulm Circ. 2013;3(2):278–93.
48. Olson TP, Beck KC, Johnson BD. Pulmonary function changes associated with cardiomegaly in chronic heart failure. J Card Fail. 2007;13(2):100–7. 49. Melton PE, Rutherford S, Voruganti VS, Goring HH, Laston S, Haack K, et al.
Bivariate genetic association of KIAA1797 with heart rate in American Indians: the Strong Heart Family Study. Hum Mol Genet. 2010;19(18):3662–71. 50. STAMPEED: http://www.ncbi.nlm.nih.gov/gap/phegeni?tab=1&gene=
54914#pgGAP. Accessed date: April 20,2015.
51. Wilk JB, Walter RE, Laramie JM, Gottlieb DJ, O’Connor GT. Framingham Heart Study genome-wide association: results for pulmonary function measures. BMC Med Genet. 2007;8 Suppl 1:S8.
52. Krackhardt AM, Witzens M, Harig S, Hodi FS, Zauls AJ, Chessia M, et al. Identification of tumor-associated antigens in chronic lymphocytic leukemia by SEREX. Blood. 2002;100(6):2123–31.
53. Choy FY, Campbell TN. Gaucher disease and cancer: concept and controversy. Int J Cell Biol. 2011;2011:150450.
54. Dick DM, Aliev F, Krueger RF, Edwards A, Agrawal A, Lynskey M, et al. Genome-wide association study of conduct disorder symptomatology. Mol Psychiatry. 2011;16(8):800–8.
55. Glynn D, Gibson HE, Harte MK, Reim K, Jones S, Reynolds GP, et al. Clorgyline-mediated reversal of neurological deficits in a Complexin 2 knockout mouse. Hum Mol Genet. 2010;19(17):3402–12.
56. Lionel AC, Crosbie J, Barbosa N, Goodale T, Thiruvahindrapuram B, Rickaby J, et al. Rare copy number variation discovery and cross-disorder comparisons identify risk genes for ADHD. Sci Transl Med. 2011;3(95):95ra75.
57. Hass J, Walton E, Kirsten H, Turner J, Wolthusen R, Roessner V, et al. Complexin2 modulates working memory-related neural activity in patients with schizophrenia. Eur Arch Psychiatry Clin Neurosci. 2015;265(2):137–45.
• We accept pre-submission inquiries
• Our selector tool helps you to find the most relevant journal
• We provide round the clock customer support
• Convenient online submission
• Thorough peer review
• Inclusion in PubMed and all major indexing services
• Maximum visibility for your research
Submit your manuscript at www.biomedcentral.com/submit