The impact of sample size
and marker selection on the study of
haplotype structures
Xiao Sun,
1,2J. Claiborne Stephens
1and Hongyu Zhao
2*
1
Genaissance Pharmaceuticals, 5 Science Park, New Haven, CT 06511, USA 2
Yale University School of Medicine, 60 College Street, New Haven, CT 06520, USA
*Correspondence to:Tel:þ1 203 785 6271; Fax:þ1 203 785 6912, E-mail: [email protected]
Date received (in revised form): 22nd December 2003
Abstract
Several studies of haplotype structures in the human genome in various populations have found that the human chromosomes are structured such that each chromosome can be divided into many blocks, within which there is limited haplotype diversity. In addition, only a few genetic markers in a putative block are needed to capture most of the diversity within a block. There has been no systematic empirical study of the effects of sample size and marker set on the identified block structures and representative marker sets, however. The purpose of this study was to conduct a detailed empirical study to examine such impacts. Towards this goal, we have analysed three representative autosomal regions from a large genome-wide study of haplotypes with samples consisting of African-Americans and samples consisting of Japanese and Chinese individuals. For both populations, we have found that the sample size and marker set have significant impact on the number of blocks and the total number of representative markers identified. The marker set in particular has very strong impacts, and our results indicate that the marker density in the original datasets may not be adequate to allow a meaningful characterisation of haplotype structures. In general, we conclude that we need a relatively large sample size and a very dense marker panel in the study of haplotype structures in human populations.
Keywords:single nucleotide polymorphism (SNP), haplotype, sample size, marker selection, haplotype block, tag SNPs
Introduction
Human DNA sequence variation accounts for a large fraction of the observed phenotypic differences between individuals, including susceptibility to disease. Sites in the DNA sequence where individuals differ at a single DNA base are called single nucleotide polymorphisms (SNPs). SNPs represent by far the most common source of genetic variation, and it is esti-mated that the human genome may contain over 10 million SNPs, about one in every 300 bases.1 – 3
A haplotype is the specific combination of marker alleles within a region of a chromosome. Tightly linked SNPs are not independent on a given chromosome, but tend to be associ-ated with each other across small regions. This tendency is called linkage disequilibrium. Empirical data suggest that relatively few of the theoretically possible haplotypes are observed at significant frequencies for a set of SNPs within a very short physical distance.4
Genome-wide disease association studies using SNPs and haplotypes may be the most promising approach to identifying genetic variants underlying complex diseases, and recent
technological advances have made high-throughput sequen-cing and genotyping possible. With the aim of speeding the discovery of genes related to common illnesses, as well as preventing adverse drug reactions, the National Institutes of Health launched the international HapMap Project to organise what is known about genetic variation within the human genome. One objective of this project was to understand haplotype structures throughout the human genome.
One attractive feature of statistical association methods based on haplotype blocks is the idea that, although blocks may contain a large number of SNPs, only a few SNPs are needed to uniquely identify the haplotypes in a block. This much smaller subset of SNPs, which are termed ‘haplotype tagging SNPs’ (htSNPs), can be used to explain a large proportion of diversity. Tag SNPs make it unnecessary to genotype all the SNPs in a given region and therefore represent an economic approach to genome-wide association studies. Zhanget al.10studied the power of different association tests in a variety of disease models by using Tag SNPs and concluded that the genotyping efforts can be significantly reduced without much loss of power.
Despite these findings of block-like structures in the human genome, there is no universally accepted definition of haplotype blocks. In fact, each study has its own definition. Different definitions of haplotype blocks include: (1) a con-tinuous set of markers in which the average pairwise D’ is greater than some predetermined threshold;11(2) a region where a small number of common haplotypes account for the majority of the chromosomes;6,12 (3) regions with both lim-ited haplotype diversity and strong linkage disequilibrium but allowing several markers to be skipped;7 and (4) regions with absolutely no evidence for historical recombination between any pair of SNPs.13 Therefore, block definition remains sub-jective and arbitrary, and it is not yet clear how to compare haplotype blocks between studies. Furthermore, each method varies in terms of the SNP minor allele frequency threshold used. The most appropriate definition may depend on how the inferred blocks are used, such as whether the identified blocks will be used to infer recombination hot spots or to identify regions that are associated with disease. Moreover, recent studies suggest that there may be non-trivial departures from block structures.14
Despite extensive empirical studies on haplotype blocks, one issue that has not been well addressed is the impact of sample size on the assessment of haplotype block structure. In some previous studies, blocks were identified based on a small set of chromosomes and may not provide a comprehen-sive representation of the whole population. For example, the chromosome 21 study only examined 20 independent chromosomes from diverse populations.6The largest dataset reported to date contains samples from 275 individuals, leading to 400 independent chromosomes.8It is not known, however, how many individuals are sufficient to get reliable character-isation of haplotype block structures.
In addition, the effect of SNP marker selection on the inferred haplotype block structures has not been well studied either. To date, the density of SNPs analysed has ranged from approximately one marker per kilobase6,9to one marker per 15 kb.7 Published results suggest that a denser marker panel tends to give rise to a larger number of shorter blocks,6 whereas a sparser marker panel generates fewer longer blocks.7,8Furthermore, the block boundaries and Tag SNPs
may substantially change, even if we keep the SNP density constant but select a different set of SNPs. In a recent study by Wall and Pritchard,15they found using simulations that marker density is more important than sample size for inferring haplotype structures.
One of the objectives of the HapMap project is to under-stand population differences in their haplotype structures. It is important to compare haplotype blocks in different popu-lations and to examine whether the same set of Tag SNPs can be used in different populations to capture haplotype diversi-ties. Existing data have shown that the blocks in a Yoruban population from Nigeria are generally the same as, but shorter than, those in European and Asian populations.8If different populations indeed share similar haplotype block structures, one broad map would be sufficient. If the populations are different enough, however, it might be necessary to construct population-specific haplotype maps.
These are very important questions requiring answers, and the data collected from the HapMap project may help us to gain a better understanding of these issues. In the current study, we focused on the impact of sample size and SNP marker selection on the haplotype block partitioning and Tag SNP selections in a sample consisting of African-Americans and a sample consisting of Japanese and Chinese people.
Materials and methods
Datasets
SNP genotype data of 51 autosomal regions that collectively span,0.4 per cent of the human genome from African-American samples (called population B in the original study) and from Japanese and Chinese samples (called population C in the original study) were downloaded from the following website: http://www.genome.wi.mit.edu/mpg/hapmap/ hapstruc.html. A detailed description of the data can be found in the paper by Gabrielet al.,8Population B contains 50 samples from unrelated African-Americans and population C includes 42 samples from unrelated individuals of Japanese and Chinese origin. This is the largest public dataset available to date.
Haplotype block partitioning and Tag SNP
selections
To obtain haplotype boundaries and Tag SNPs, we used ‘HapBlock’, a dynamic programming algorithm for haplotype block partitioning with minimum number of Tag SNPs developed by Zhang et al.,12The following parameters were used in our analysis: the input data type was genotype data; the method for block definition was the one used in Patil et al.,6 the threshold to define the block was set at 0.8; the threshold to define the common haplotype was set at 0.099; the method to find the Tag SNPs was the haplotype block diversity introduced by Johnson et al.;16and the threshold to find the Tag SNPs was set at 0.9.
Impact of sample size
To examine the impact of sample size on the identified hap-lotype structures, we randomly selected 10, 20, 30 and 40 individuals out of 50 African-Americans in population B and repeated the random selection 100 times. For each randomly selected sample, we took their SNP genotype data in regions 52a, 42a and 31a and ran the HapBlock program to identify the number of blocks, the block boundaries and the Tag SNPs for each block. The same procedures were applied to population C, which included 42 unrelated Japanese and Chinese people. These results were used to assess the effect of sample size on haplotype block structures.
Impact of marker selection
Random marker selection. To study the impact of marker selection on the assessment of haplotype block structures, we carried out random selection on SNP markers for the three regions. Because region 52a contains 46 SNPs for popula-tion B (African-American) and 45 SNPs for populapopula-tion C ( Japanese and Chinese), we randomly selected 10, 20, 30 and 40 SNPs for each population and repeated random selection 100 times. For region 42a, which includes 100 SNPs for popu-lation B and 99 SNPs for popupopu-lation C, we randomly selected 20, 40, 60 and 80 SNPs for each population and repeated this 100 times. Similarly for region 31a, where there are 23 SNPs for population B and 25 SNPs for population C, we randomly selected 5, 10, 15 and 20 SNPs for each population and repeated this 100 times. For each marker set selected, we ran the HapBlock program to identify the total number of blocks, the block boundaries and the Tag SNPs for each block.
Sequential marker selection. Since an SNP could only be a boundary marker in the event that it was in the subset chosen, comparing block boundaries among totally different sets of SNP markers is difficult. In order to further investigate the underlying mechanism explaining why higher density markers usually give rise to more, smaller blocks than is the case for lower density markers, we applied a sequential marker selection method to 46 SNPs on chromosome region 52a from the African-American population. First, we randomly selected
ten SNPs out of the original 46 SNPs to identify block structures. Secondly, we randomly selected another ten SNPs out of the 36 remaining SNPs and combined them with the previously selected 10 SNPs to identify block structures. Then, we randomly selected another 10 SNPs out of the 26 remaining SNPs and combined them with the previously selected 20 SNPs to do the analysis. Lastly, we randomly selected 10 more SNPs out of the 16 remaining SNPs and combined them with the previously selected 30 SNPs to identify block structures. This simulation approach ensured that the lower density marker set is a subset of the higher density marker set. The whole selection process was repeated 100 times. Comparisons of the block boundary results were based on these results.
Block boundary and Tag SNP comparisons
In the comparison of block boundaries, we counted the frequency of each SNP that was used as the starting or ending position of the block boundaries in the results based on 100 randomly selected samples. Comparing Tag SNPs is more complicated than comparing block boundaries because the Tag SNPs are not unique for each block. In other words, there is usually more than one set of Tag SNPs (see Appendix A for a Tag SNP example) in a block. Therefore, to incorporate the multiplicities of the Tag SNPs, for the results from each randomly selected sample, we counted the frequency of each SNP that was selected as a Tag SNP across all Tag SNP sets and divided this frequency by the number of Tag SNP sets in each block and the total number of blocks in the region. Based on the 100 randomly selected samples, we then calculated the mean weighted frequency for each SNP.Results
Haplotype block partitioning based on
the observed data
Using the observed genotype data, region 52a was partitioned into nine blocks with a total of 19 Tag SNPs for the African-Americans (population B) and six blocks with a total of ten Tag SNPs for the Japanese and Chinese (population C). Region 42a, however, was divided into 16 blocks with a total of 33 Tag SNPs for African-Americans and 14 blocks with a total of 22 SNPs for Japanese and Chinese. As with region 31a, both populations had three blocks and six Tag SNPs (see appendix for detailed block information using region 52a as an example).
Inspection of all 51 autosomal regions in the Gabrielet al.
Impact of sample size
Table 1 summarises the results of the number of blocks when we randomly selected 10, 20, 30 and 40 individuals 100 times from each population. For example, in the upper left
panel of Table 1, column ‘ran10’ corresponds to the results based on 100 simulated datasets consisting of ten individuals. The sum did not add up to 100 because the HapBlock pro-gram we used for block partitioning would tend to fail when
Table 1. Frequency of the number of blocks in which the number of individuals is varied in simulations
we had few individuals or few markers included in the sample. Among the 99 simulated samples with HapBlock results, region 52a was partitioned into five blocks 17 times, six blocks 55 times, seven blocks 21 times, and eight blocks six times. If we focus on the trend of modes for each sample size based on 100 simulated samples, it is apparent that the number of blocks generally increases as we include more individuals in the sample. With the original 50 African-Americans, region 52a was partitioned into nine blocks. When we included only ten people, most of the times we obtained six blocks for this region. When we increased the sample size to 20 people, most of the times the region was partitioned into eight blocks. When the sample size grew to 30 and 40, most of the times the region was partitioned into nine blocks, the same as that in the original dataset. Therefore, a minimum of 30 individuals is
needed for this given set of markers to infer the number of blocks.
We also examined the sample size effect on the total number of Tag SNPs associated with block partitioning, and the results are summarised in Table 2. Similar to the results summarised in Table 1, the total number of Tag SNPs increases as the sample size increases. A shorter region with fewer SNPs, such as region 31a, seems to require fewer individuals than a longer region with more SNPs, such as regions 52a and 42a, to identify a similar number of Tag SNPs as the original sample. In fact, the inferred number of blocks and Tag SNPs did not level off in region 42a in either population, indicating that our sample size may not have been adequate to define a set of Tag SNPs for this region. Statistical comparisons based
Table 2. Frequency of the total number of Tag SNPs when the number of individuals is varied in simulations
on t-tests or Wilcoxon tests also indicated that there was a significant difference between the inferred block structures from samples of size 30 and those from samples of size 40 in region 52a.
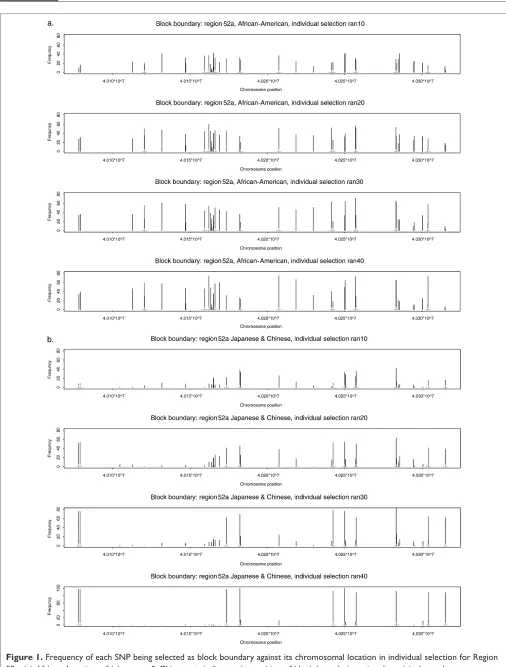
Using region 52a as an example, Figure 1 summarises the frequency of each SNP being used as block boundary against its chromosomal location across 100 simulated samples with 10, 20, 30 and 40 individuals, respectively. Although block boundaries differed from one sample to another (for samples consisting of the same number of individuals), when we pooled the results of 100 random selections, the overall pat-terns were very similar for samples of different sizes. The block boundaries in region 52a from the Japanese and Chinese samples were more clear-cut than those from the African-American samples. The high frequency bars matched block boundary positions from those identified in the original 42 Japanese and Chinese people perfectly.
Detailed Tag SNP comparisons are more difficult than block boundary comparisons mainly because Tag SNPs are not unique. Usually there is more than one set of Tag SNPs in a
block (see Appendix A for tag SNP example). In order to examine the impact of sample size on Tag SNP selections, we calculated the weighted frequency of each SNP being selected as a Tag SNP and plotted it against the SNPs in the combined order (see Appendix B for SNPs in the combined order due to differences between SNP sets between the two populations). Figure 2 summarises the results for Tag SNP selections for different sample sizes (10, 20, 30 and 40) and it can clearly be seen that similar sets of Tag SNPs were identified on average across all simulations for different sizes. Comparing these to the Tag SNPs from the original sample of 50 African-Americans, we found that they were almost identical, with the exception of SNP numbers 20 and 45. Both of these had a relatively high frequency of being selected as Tag SNPs using randomly selected samples, but they did not show up in the Tag SNP list using the original sample. In addition, we found that most of the Tag SNPs selected for the Japanese and Chinese population also appeared on the Tag SNP list for the African-American population, but not vice versa, indi-cating that Tag SNPs for the Japanese and Chinese population
is largely a subset of those for the African-American population.
Impact of marker selection
Table 3 summarises the results of the number of blocks after we randomly selected: 10, 20, 30 and 40 SNPs for
region 52a; 20, 40, 60 and 80 SNPs for region 42a; and 10, 15 and 20 SNPs for region 31a. Simulated samples consisting of a random selection of five SNPs for region 31a crashed the HapBlock program every time, and therefore no results from this part of the study are shown in Table 3. It is apparent from this Table that as we included more SNP
Table 3. Frequency of the number of blocks when the number of markers is varied in simulations
markers in our sample, the number of blocks continued to grow, and there was evidence that the inferred haplotype structures would have continued to change if more markers had been included.
As for the number of Tag SNPs, Table 4 clearly shows that, as we included more SNP markers in our sample, the total number of Tag SNPs also continued to grow, and did not show any sign of stabilisation.
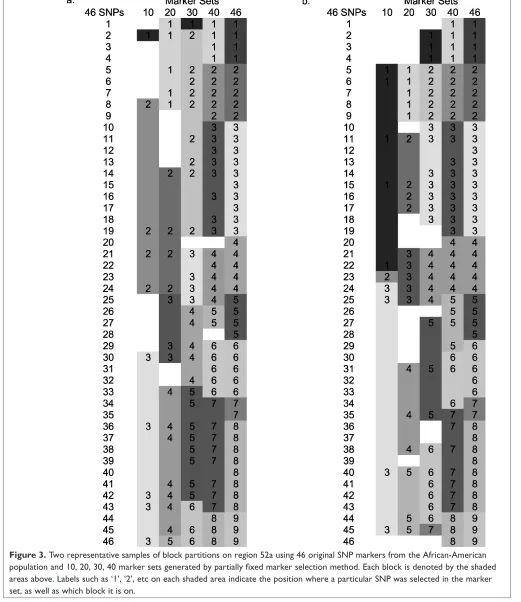
To answer the question of why denser marker sets usually give rise to more, smaller blocks than is the case for sparser marker sets, we studied chromosomal region 52a in the African-American population in detail. Figure 3 shows two representative patterns of how region 52a was partitioned into
blocks using 10, 20, 30 and 40 sequentially-selected SNP markers, as well as the original 46 SNP marker set. Both marker sets of size 10 generated three blocks, with one set consisting of SNPs number 2, 8, 19, 21, 24, 30, 36, 42, 43 and 46, and the other set consisting of SNPs number 5, 6, 11, 15, 22, 23, 24, 25, 40 and 45. The blank space between the blocks is due to the lack of information regarding which block the SNPs belong to. By adding ten more SNPs to both marker sets, the two 20-marker sets generated five blocks, as shown in Figures 3a and 3b. As we included additional SNPs in the marker set within this region, i.e. as we increased the marker density, the number of blocks increased for two reasons. First, the old large blocks at lower densities are often broken into
Table 4. Frequency of the total number of Tag SNPs when the number of markers is varied in simulations
smaller pieces at higher density. For example, in Figure 3a, block 7 in marker set 40 became block 7 and block 8 when two more SNPs (numbers 35 and 40) were added to this
region. Secondly, new blocks emerged from areas where there was a lack of information due to the lack of markers in the smaller marker set, such as block 3 in marker set 20 in
Figure 3a and block 1 in marker set 30 in Figure 3b. The block boundaries were obviously not random but were in fact quite consistent across different marker sets.
Discussion
Our studies have clearly demonstrated that sample size and marker selection have a significant impact on the number of blocks and the total number of Tag SNPs inferred from a population sample. As we include more individuals in our sample, both the number of blocks and the total number of Tag SNPs increase. For a shorter region with fewer SNP markers, like region 31a (181.98 kb, 23 SNPs), 20 people may be adequate to infer the haplotype patterns, while for a longer region with more SNP markers, such as 52a (237.22 kb, 46 SNPs) and 42a (409.92 kb, 100 SNPs), the required sample size may be 30 or more. The minimal sample size needed for a reliable haplotype structure inference clearly depends on the structure of the region being investigated. Although the pat-terns of block boundary and the set of Tag SNPs selected look very similar on average across all sample sizes, there is more variation from one simulated sample to another when the sample size is small. In addition, the set of Tag SNPs selected in the Japanese and Chinese population seems to be a subset of those in the African-American population.8 This observation, however, may be due to the ascertainment of the specific set of markers being examined in the original study.
Our marker selection results demonstrate that the number of blocks and the total number of Tag SNPs increase as more SNP markers are included. In addition, our results indicate that we would need to include more SNP markers in these regions in order to draw a valid conclusion on the number of blocks
and Tag SNPs. The number of SNPs needed for a reliable inference on the haplotype structures may be a function of both the region and the specific population under study.
Another issue to bear in mind is that our haplotypes were inferred from genotype data, not directly observed. Although the accuracy is quite high, greater than 80 per cent,17it is likely that the results may differ if different algorithms are used to reconstruct individual haplotypes. In addition, the inac-curacy in haplotype inference may contribute to the observed sample size effect. It should also be noted that the specific set of parameters used in the HapBlock program in our analysis to infer blocks and Tag SNPs does not affect the general patterns for the impact of the sample size and marker selection on the inferred haplotype structures (results not shown).
In summary, our study indicates that sample size and marker selection have a significant impact on the inferred haplotype structures reflected in the haplotype blocks and Tag SNPs. Although haplotype blocks may be an over-simplistic rep-resentation of the haplotype structures,14we hypothesise that the impact would have been equally significant if we had used other approaches to analysing haplotype structures in the human genome. In order to draw valid conclusions on hap-lotype block structure, we need a relatively large sample size and a dense marker panel and we need to make adaptive adjustments according to the specific region and specific population to be studied.
Acknowledgments
Appendix A
Region 52a (Chromosome 22, 237.22 kb)
Population B (African-American)†
# of blocks 9 total # of Tag SNPs 19
BlockID NumTagSNP StartPos EndPos BlockSize NumHap
Block_0001 3 1 4 4 100
Block_0002 2 5 9 5 100
Block_0003 2 10 19 10 100
Block_0004 2 20 24 5 100
Block_0005 2 25 28 4 100
Block_0006 2 29 33 5 100
Block_0007 2 34 35 2 100
Block_0008 2 36 43 8 100
Block_0009 2 44 46 3 100
Tag SNP for block_0001 Tag SNP for block_0005
1 4 5 0.95825 27 29 0.91095
1 4 5 0.9582521* 27 29 0.9109521*
Tag SNP for block_0002 Tag SNP for block_0006
7 10 0.94339 31 33 0.90816
9 10 0.90594 32 33 0.90614
7 10 0.9433921* 31 33 0.9081621*
Tag SNP for block_0003 Tag SNP for block_0007
11 15 0.93446 36 37 1
11 17 0.93107 36 37 121*
11 18 0.93234
11 19 0.9346 Tag SNP for block_0008
15 20 0.92013 40 42 0.90181
17 20 0.91561 40 42 0.9018121*
18 20 0.91455
19 20 0.92754 Tag SNP for block_0009
11 19 0.934621* 46 47 0.93096
46 48 0.92839
Tag SNP for block_0004 46 47 0.9309621*
25 26 0.90927
25 26 0.9092721*
† Tag SNPs are in combined order.
Population C (Japanese & Chinese)†
# of blocks¼6 Total # of TagSNPs¼10
BlockID NumTagSNP StartPos EndPos BlockSize NumHap
Block_0001 1 1 1 1 84
Block_0002 2 2 22 21 84
Block_0003 2 23 29 7 84
Block_0004 2 30 34 5 84
Block_0005 2 35 43 9 84
Block_0006 1 44 45 2 84
Tag SNP for block_0001 Tag SNP for block_0004
1 1.00000 32 36 0.90335
1 1.00000 21* 34 36 0.9073
34 36 0.907321*
Tag SNP for block_0002
7 15 0.96085 Tag SNP for block_0005
7 17 0.96085 37 39 0.93032
7 18 0.96085 37 40 0.92593
7 19 0.96085 39 46 0.93265
7 15 0.9608521* 40 46 0.92716
39 46 0.9326521*
Tag SNP for block_0003
25 27 0.92191 Tag SNP for block_0006
25 31 0.90516 48 0.95869
26 27 0.92676 48 0.9586921*
26 31 0.91236
27 31 0.92645
26 27 0.9267621*
† Tag SNPs are in combined order.
Appendix B
SNP_ID COMBINED
ORDER
POP_B ORDER
POP_C ORDER
CHROM_POS POP_B BLOCK POP_C BLOCK
110924 1 1 1 40077996 Block_0001 Block_0001
110926 2 2 2 40078865 Block_0001 Block_0002
110525 3 NA 3 40104585 NA Block_0002
110527 4 3 4 40112652 Block_0001 Block_0002
110528 5 4 5 40120338 Block_0001 Block_0002
110529 6 5 6 40120419 Block_0002 Block_0002
3884 7 6 7 40131747 Block_0002 Block_0002
117587 8 7 8 40147031 Block_0002 Block_0002
117590 9 8 9 40147256 Block_0002 Block_0002
91037 10 9 10 40159355 Block_0002 Block_0002
82256 11 10 11 40162170 Block_0003 Block_0002
117575 12 11 NA 40163399 Block_0003 NA
117578 13 12 NA 40163843 Block_0003 NA
3943 14 13 12 40163920 Block_0003 Block_0002
2442 15 14 13 40164108 Block_0003 Block_0002
117580 16 15 14 40164192 Block_0003 Block_0002
117581 17 16 15 40164236 Block_0003 Block_0002
117582 18 17 16 40164840 Block_0003 Block_0002
117583 19 18 17 40165138 Block_0003 Block_0002
37728 20 19 18 40165262 Block_0003 Block_0002
14523 21 NA 19 40166038 NA Block_0002
82025 22 20 20 40166144 Block_0004 Block_0002
84395 23 21 21 40168971 Block_0004 Block_0002
117586 24 22 22 40173352 Block_0004 Block_0002
117592 25 23 23 40182141 Block_0004 Block_0003
117593 26 24 24 40182498 Block_0004 Block_0003
117596 27 25 25 40207457 Block_0005 Block_0003
26726 28 26 26 40218483 Block_0005 Block_0003
16893 29 27 27 40229786 Block_0005 Block_0003
11692 30 28 28 40241571 Block_0005 Block_0003
117608 31 29 29 40242422 Block_0006 Block_0003
32936 32 30 30 40249849 Block_0006 Block_0004
117566 33 31 31 40250303 Block_0006 Block_0004
44133 34 32 32 40250387 Block_0006 Block_0004
117567 35 33 33 40256951 Block_0006 Block_0004
23139 36 34 34 40257384 Block_0007 Block_0004
118681 37 35 35 40283200 Block_0007 Block_0005
99869 38 36 36 40283420 Block_0008 Block_0005
2584 39 37 37 40284703 Block_0008 Block_0005
118669 40 38 38 40285521 Block_0008 Block_0005
118674 41 39 39 40294440 Block_0008 Block_0005
30109 42 40 40 40295018 Block_0008 Block_0005
118676 43 41 41 40300494 Block_0008 Block_0005
88347 44 42 NA 40303907 Block_0008 Block_0005
118679 45 43 42 40303949 Block_0008 NA
88348 46 44 43 40303993 Block_0009 Block_0005
3742 47 45 44 40314969 Block_0009 Block_0006
References
1. Kruglyak, L. and Nickerson, D.A. (2001), ‘Variation is the spice of life’,
Nat. Genet.Vol. 27, pp. 234 – 236.
2. Sachidanandam, R., Eeissman, D., Schmidt, S.C.et al.(2001), ‘A map of human genome sequence variation containing 1.42 million single nucleotide polymorphisms’,NatureVol. 409, pp. 928 – 933.
3. Venter, J.C., Adams, N.D., Myers, E.W.et al.(2001), ‘The sequence of the human genome’,ScienceVol. 291, pp. 1304 – 1351.
4. Stephens, J.C., Schneider, J.A., Tanguay, D.A.et al.(2001), ‘Haplotype variation and linkage disequilibrium in 313 human genes’,ScienceVol. 293, pp. 489 – 493.
5. Daly, M.J., Rioux, J.D., Schaffnel, S.F.et al.(2001), ‘High-resolution haplo-type structure in the human genome’,Nat. Genet.Vol. 29, pp. 229 – 232. 6. Patil, N., Berno, A.J., Hurds, D.A.et al.(2001), ‘Blocks of limited
haplotype diversity revealed by high-resolution scanning of human chromosome’,ScienceVol. 294, pp. 1719 – 1723.
7. Dawson, E., Abecasis, G.R., Bumpstead, S.et al.(2002), ‘A first-gener-ation linkage disequilibrium map of human chromosome 22’,NatureVol. 418, pp. 544 – 548.
8. Gabriel, S.B., Scnaffnel, S.F., Nguyen, H.et al.(2002), ‘The structure of haplotype blocks in the human genome’,ScienceVol. 296, pp. 2225 – 2229. 9. Jeffreys, A.J., Kauppi, L. and Neumann, R. (2001), ‘Intensely punctate
meiotic recombination in the class II region of the major histocompati-bility complex’,Nat. Genet. Vol. 29, pp. 217 – 222.
10. Zhang, K., Calabrese, P., Nordborg, M. and Sun, F. (2002), ‘Haplotype block structure and its applications to association studies: Power and study designs’, Am. J. Hum. Genet. Vol. 71, pp. 1386 – 1394.
11. Reich, D.E., Cargill, M., Bolk, S.et al.(2001), ‘Linkage disequilibrium in the human genome’,NatureVol. 411, pp. 199 – 204.
12. Zhang, K., Deng, H., Chen, T.et al.(2002), ‘A dynamic programming algorithm for haplotype block partitioning’,Proc. Natl. Acad. Sci. USA
Vol. 99, pp. 7335 – 7339.
13. Wang, N., Akey, J.M., Zhang, K.et al.(2002), ‘Distribution of recombination crossovers and the origin of haplotype blocks: The interplay of population history, recombination, and mutation’,
Am. J. Hum. Genet. Vol. 71, pp. 1227 – 1234.
14. Wall, J.D. and Pritchard, J.K. (2003), ‘Haplotype blocks and linkage disequilibrium in the human genome’,Nat. Rev. Genet.Vol. 4, pp. 587 – 597.
15. Wall, J.D. and Pritchard, J.K. (2003), ‘Assessing the performance of the haplotype block model of linkage disequilibrium’,Am. J. Hum. Genet.
Vol. 73, pp. 502 – 515.
16. Johnson, G.C., Esposito, L., Barratt, B.J.et al.(2001), ‘Haplotype tagging for the identification of common disease genes’,Nat. Genet.Vol. 29, pp. 233 – 237.