RESEARCH
Pitching stability of diving seabirds
during underwater locomotion: a comparison
among alcids and a penguin
Takuji Noda
1*, Dale M. Kikuchi
2, Akinori Takahashi
2,3, Hiromichi Mitamura
1and Nobuaki Arai
4Abstract
Background: In animals, recoil motion resulting from underwater propulsion can destabilise trajectory and decrease locomotory performance. The posture of diving seabirds fluctuates simultaneously with their appendage beat, espe-cially in the vertical plane, because of the recoil force of the beat. Seabirds that fly and swim face trade-offs between maximising their locomotory performance in one medium relative to the other, and flightless penguins were hypoth-esised to have higher underwater pitching stability than alcids that fly and swim. To test this hypothesis, we investi-gated the in situ pitching stability of three species of diving seabirds, including a penguin, Pygoscelis adeliae, and two species of alcids, Cerorhinca monocerata and Uria lomvia. A high-resolution gyroscope data logger was attached to the back of each bird and recorded the angular velocity of the body during the descent phase of dives.
Results: For all three species, the root mean square (RMS) of the angular velocity, which indicated the level of angular fluctuation, was negatively correlated with the depth. Many factors, such as the dorsoventral acceleration result-ing from wresult-ing beat, dive angle, speed, and current depth, as well as the maximum depth in each dive, significantly affected the angular velocity RMS. The angular velocity RMS at a given depth (e.g. 5 and 10 m) significantly increased with the maximum depth of the dives, suggesting buoyancy regulation relative to the target depth to reduce the destabilising angular momentum in all three species. During entire descent periods, the angular fluctuation was generally lower in P. adeliae than in the two species of alcids, supporting the hypothesis of a higher pitching stability in penguins. Furthermore, the angular fluctuation of U. lomvia was lower than that of C. monocerata at deeper depths, suggesting higher pitching stability and more efficient underwater locomotion in U. lomvia.
Conclusions: This study demonstrated a difference in the pitching stability, which is an important component of underwater locomotory efficiency, of a penguin and two alcid species while diving freely in natural conditions. In situ angular fluctuation data obtained by gyroscope would be useful to understand the locomotory strategy of swimming animals.
Keywords: Gyroscope, Accelerometer, Pitching stability, Moment of inertia, Adélie penguin, Rhinoceros auklet, Brünnich’s guillemot, Biotelemetry, Biologging
© 2016 Noda et al. This article is distributed under the terms of the Creative Commons Attribution 4.0 International License (http://creativecommons.org/licenses/by/4.0/), which permits unrestricted use, distribution, and reproduction in any medium, provided you give appropriate credit to the original author(s) and the source, provide a link to the Creative Commons license, and indicate if changes were made. The Creative Commons Public Domain Dedication waiver (http://creativecommons.org/ publicdomain/zero/1.0/) applies to the data made available in this article, unless otherwise stated.
Background
Many animals use their appendages (legs, wings, flippers, fins, etc.) to displace themselves or to retain their posi-tion and posture in a medium. Whereas the appendage usage enables them to achieve displacement or reten-tion, the movement simultaneously produces recoil force
[1–6]. This is especially true in water, where the viscosity (~50 times that of air) and density (~800 times that of air) of the medium are relatively high, and the resulting drag and recoil forces are large. Fluctuation of the body due to appendage movement can cause the desired track of the animals to deviate, and additional appendage move-ment or extra energy would be needed if the animals are to return to the required trajectory [3]. Destabilisation may even inhibit sensory perceptions [7]. Controlling
Open Access
*Correspondence: takujinodan@gmail.com
the destabilising force from the medium effects and the resultant body movement would be important to loco-motory efficiency [3–5].
Diving animals, such as seabirds, are expected to regu-late their diving behaviour and movement to minimise energy expenditure and maximise foraging time. Buoy-ancy force, which changes dramatically with depth due to the compression of the air spaces in the lungs and feathers, is one of the key factors affecting the locomo-tory efficiency of diving seabirds [8] that utilise resources distributed widely in the water column. Previous stud-ies have demonstrated various energy-saving strategstud-ies in underwater locomotion of diving seabirds, including the regulation of swim speed [9–11], dive angle [11–14], stroke patterns [15, 16] and frequency [13, 15, 17], and passive ascent [18, 19]. However, little research has been conducted on the body stability associated with append-age movement during dives [20, 21], especially in the field.
When diving seabirds beat their appendages (wing or foot), their body posture (i.e. the orientation of the body with respect to an inertial frame of reference) would fluc-tuate simultaneously through self-generated perturba-tion. This is because gaps exist between the pivot (i.e. the centre of rotation) and effort (i.e. the recoil force) point [3,
5], resulting in the generation of rotational momentum. Rotational fluctuation may change greatly during dives due to various factors. For example, during dives, when the buoyancy changes with diving depth, the recoil force of the appendage beat would be large when the buoyancy is large and vice versa. Hence, the rotational momentum caused by appendage beating will vary with changes in buoyancy and depth. The force of the appendage beat will change the counteracting recoil force. The stroke pattern (upstroke or downstroke and angle of attack, etc.) and frequency of the appendage beat would affect the direc-tion and timing of the thrust and recoil forces, which may also produce rotational fluctuation. Dive angle may be associated with rotational fluctuation because a higher force of appendage beat would be required to counter the absolute value of the sum of the vectors of buoyancy and drag [9, 13] if the dive angle was more vertical. In addi-tion to the propulsive movement (powered force) by the appendage, the stability is generated by flow induced over the control surfaces of the body, where the resultant force vectors can be modulated by varying the attitude of the body and appendages of animals (trimming force) [3, 5]. While the trimming force can stabilise the posture, the trimming becomes less effective at low speed [3], and hence, higher speed may produce less rotational fluctua-tion. Because unwanted rotational momentum should lead to energy loss, examining the factors that affect the
angular fluctuations acting on the body would be useful to gain a better understanding of the locomotory effi-ciency associated with rotational instability in these birds while diving.
A comparison of angular fluctuations during dives among penguins and alcids may help answer how vari-ous factors affect the angular fluctuations of diving seabirds. Both penguins and alcids are wing-propelled divers, but penguins are flightless, whereas alcids use their wings for both aerial flight and underwater loco-motion. Seabirds that fly and swim face trade-offs between maximising their locomotory performance in one medium relative to the other [22]. Previous research has shown that penguins, having a proportion-ally greater mass of upstroke muscles (~50 % of greater pectoral muscle) than alcids (~30 % of greater pectoral muscle), perform both the upstroke and downstroke regardless of dive depth, whereas alcids produce for-ward acceleration with both the upstroke and down-stroke at shallow depths (<10 m) but mainly with the downstroke at greater depths during descent [9, 23]. Alcids, with 1.4 times greater air volume per mass than penguins, experience greater buoyancy in water [24]. Penguins adjust their inhalation of air depending on the target maximum dive depth before dives [16, 18]. Based on these previous findings, alcids are hypothesised to exhibit generally high angular fluctuations (hence low angular stability), and penguins are hypothesised to have higher angular stability than alcids to the recoil motions associated with the wing beat.
Methods
Data loggers
A high-resolution gyro logger (LP-BLKU02; made by Biologging Solutions Inc., Kyoto, Japan) was used to record the three-axial acceleration and three-axial angu-lar velocity of the seabirds. This data logger was a rec-tangular parallelepiped (60 × 13 × 5 mm3) with a mass
of 6.5 g in air, and it includes a rechargeable lithium polymer battery. The measurement ranges were ±16 g and ±6000°/s for the acceleration and angular veloc-ity, respectively. The measurement resolution was 16 bit (−32,768 to +32,768). The data logger measured and stored all of the sensor outputs in internal memory at a sampling frequency of 200 Hz, for a total sample time of 2.5 h. Additionally, this device allowed scheduled record-ings (e.g. recording times could be preset). Therefore,
although the recording hours are limited, the recording schedule could be set to the most plausible time when the study birds were expected to dive (not during rest on the pack ice or sea surface or while flying). The data logger was covered by epoxy, which made it water- and pres-sure-proof to a depth of 300 m.
Multiple data loggers were simultaneously used with the gyro loggers, and the combinations of the data loggers used for the different birds are summarised in Additional file 1: Table S1. For ADPE, the gyro logger was simulta-neously used with either of the following multi-sensor data loggers: (1) the ORI-380D3GT (12 mm diameter, 45 mm length; 10 g in air; made by Little Leonardo Ltd., Tokyo, Japan) for measuring 3-axis acceleration at 20 Hz, depth, and temperature at 1 Hz for approximately 40 h or (2) the W-190 L-PD2GT (21 mm diameter, 117 mm
0.8
0
-100
0
100
-0.8
0.0
Time
2012.12.27
8:25:00 AM
20
10
8:25:25 AM
Time
8:25:05 AM 8:25:10 AM
0.8
-100
0
100
-0.8
0.0
Angular velocity (deg/s
)
Dynami
c
acceleration (g)
Dept
h
(m
)
b
a
c
Pitching
length; 60 g in air; made by Little Leonardo) for meas-uring 1-axis flow speed at 1 Hz (converted from propel-ler rotation, see below for details), 2-axis accepropel-leration at 32 Hz, depth, and temperature at 1 Hz for approximately 30 h. These data loggers were attached to the lower back of the ADPE. Furthermore, an additional gyro logger was attached to the head of all the ADPE, and a video data logger (DVL400 video camera; 23 mm diameter, 114 mm length; 80 g in air; made by Little Leonardo) was also attached to the lower back of the ADPE. For the BRGU and RHAU, the gyro logger was simultaneously used with a depth and temperature data logger [Lat1500 (8 mm diameter, 32 mm length; 3.4 g in air; made by Lotek Wireless Co., Newfoundland, Canada)]. These data log-gers were attached to the lower back of the BRGU and RHAU. Only flow speed and depth data were used for the present analysis, together with the gyro logger data obtained from the body (therefore, the data collection duration for the analysis was <2.5 h for each bird). Video data obtained from the ADPE were used for visual confir-mation of the body fluctuations associated with the wing beat (see the “Results” section for details). The gyro log-ger data obtained from the head of the ADPE were not used for the present analysis. For all species, the total mass of the equipment was <2 % of the mass of the stud-ied birds.
For the ADPE, the time settings of the different data loggers were synchronised for every dive by manually adjusting the acceleration signal of the gyro logger and the acceleration signal of the ORI-380D3GT or W-190 L-PD2GT. For the BRGU and RHAU, the time settings of the different data loggers were also synchronised for every dive by manually adjusting the acceleration signal of the gyro logger and the depth signal of Lat1500 based on the knowledge of the relation between acceleration and depth signal from our other research using accelera-tion and depth data loggers on the BRGU and RHAU.
Effects of attached loggers
The device configuration for the BRGU and RHAU were the same among individuals and species but different from the ADPE. Two types of device configuration were used for the ADPE, and each type consisted of three and five individuals, respectively. The different device con-figuration may affect the comparison of results among the different deployment groups. Specifically, the drag and mass or buoyancy caused by the device attachment would be different among the different deployment groups. Assuming that the density of salt water at 10 °C was 1.0269 g/ml, the buoyancy of the total equipment can be calculated as −0.22 or −0.40 N for the ADPE and −0.04 N for the BRGU and RHAU. Because the moment of inertia, reflecting the tendency to rotate in physics,
is affected by the distribution of mass (see the “ Discus-sion” section for details), device attachment may alter the angular fluctuation that seabirds experience during dives. However, the buoyancy of the birds without devices was much larger (3.6 N kg−1 for Spheniscidae penguins [24],
4.9 N kg−1 for the BRGU and 6.3 N kg−1 for the RHAU
[9]) at the sea surface. Thus, the effect on the angular fluctuation of the mass distribution change due to device attachment would be small.
The effect of the drag induced by device deployment is difficult to assess, especially because multiple data log-gers were attached in this study. The total frontal cross-sectional areas of the attached devices (4.76 or 6.58 cm2)
were 2.49 or 3.44 %, respectively, of the maximum cross-sectional area of the ADPE (191.16 cm2), assuming the
girth of the ADPE was 0.49 cm [27]. The total frontal cross-sectional areas of the attached devices (1.15 cm2)
was 2.10 and 3.97 % of the maximum cross-sectional areas of the BRGU (54.77 cm2) and RHAU (28.99 cm2),
respectively [9]. African penguins (Spheniscus demer-sus) are expected to reduce swim speed by 11.69 % if they carry devices having a cross-sectional area of 3.97 % [28]. Adélie penguins equipped with a streamlined log-ger, whose frontal cross-sectional area was 21.00 cm2 and
whose buoyancy was −0.78 N, swim 8.3 % slower than those without the device due to the drag increase [29]. The increase of drag may not only modify the behaviour [30] and energy expenditure [29] but also require a higher wing force to counter the drag force, partially resulting in the generation of larger recoil forces. In the statisti-cal analysis, the effects of the various factors (dynamic acceleration RMS, dive angle, speed, etc.) on angular fluctuation measured with angular velocity were exam-ined within the measurements obtaexam-ined from each indi-vidual, and individual differences were treated as random variables (see the “Analysis” section for details). However, we could not rule out the possibility of effects of device attachment when comparing the results among the dif-ferent deployment groups. In future studies, the use of a miniaturised and streamlined device with one package to minimise the effect of device attachment is important.
Field studies
Field studies were conducted on the ADPE at Hukuro Cove colony (69°13′S, 39°38′E), 23 km south of Syowa Station in Lützow-Holm Bay, Antarctica, during late December 2012–mid-January 2013, corresponding to brooding and the early crèche stage; on the RHAU at Teuri Island (44°25′N, 141°18′E), Japan, during late June to July 2013; and on the BRGU at St. George Island (56°36′N, 169°38′W), USA, during August 2013.
RHAU) or by a noose-pole (BRGU) (Additional file 1: Table S1). Combinations of data loggers were attached to the feathers using Tesa™ tape (Charlotte, NC, USA) secured with instant adhesive glue (handling time: 20 min maximum). The direction of the measurement axis of the data logger (x, y, and z axes), attached to the back of stud-ied birds, was adjusted to the direction of the longitudi-nal (head-to-tail), lateral, and dorsoventral axes of the birds. The birds were recaptured after they returned to the colony from foraging, and then the data loggers were recovered.
Ethics statement
All experiments on the ADPE and RHAU were con-ducted with permits from The Ministry of the Environ-ment, Japan, and those on the BRGU were conducted with permits from US Federal, state, and special use permits.
Analysis
Data were analysed using a custom-written program in Igor Pro (Wave Metrics, Inc., Lake Oswego, OR, USA) and in python 2.7.8 with pandas [31] and matplotlib [32] library for time-series analysis and visualisation. Statisti-cal analysis was performed using R StatistiStatisti-cal Comput-ing Software (version 2.13.0, R Foundation for Statistical Computing, Vienna, Austria).
The pitching stability was evaluated using the root mean square (RMS) of angular velocity in pitch direc-tion for every second. Although slight differences existed in the attachment positions of the data loggers on the back of the body among the different individuals, the angular velocity to the centre of the rotation of the body should not change as a result of these slight differences in the attachment positions on the animals assuming the entire body is rigid. The descent period of the dive was extracted for analysis because the pressure and the buoy-ancy of the birds change dramatically during descent, and the period considered included mostly directed move-ment towards the bottom and did not interfere with other behaviour (e.g. chasing prey). We defined the descent as the continuous increase of depth from the initiation of the dive (depths >1 m) [14]. Additionally, dives in which the maximum depth was more than 5 m were selected to remove the shallower dives that often occur during bath-ing or other activities not associated with foragbath-ing.
In addition to the angular velocity RMS, the following parameters were also extracted for analysis: the dynamic acceleration RMS, dive angle (pitch angle), rate of change in depth, and speed, and each value were obtained every second. The maximum dive depth reached during the dive (hereafter, the max dive depth) was extracted for every dive. Dive time, or duration from the start
of descent to 50 % depth of the max dive depth, was also extracted for every dive. The dynamic acceleration RMS in the dorsoventral direction (heave acceleration) for every second was used to indicate the magnitude of wing forces at each second, although the dynamic accel-eration measured by the accelerometer attached to the body reflected all movement resulting from the buoy-ancy, thrust, and drag. The accelerometer simultane-ously measured the dynamic acceleration caused by wing movement and the static acceleration caused by grav-ity change. The two components were separated by two band low-pass filters (0.5/1.0 Hz, IFDL ver. 4.0; Wave Metrics, Inc.) based on the assumption that high- and low-frequency components represented dynamic and static acceleration, respectively [18]. To obtain the dive angle (angle of the bird’s body axis relative to a horizon-tal plane) for every second, the pitch angle was calculated from the static component of the acceleration data in the longitudinal direction (measured with 20 Hz), and then, the data were resampled to 1 Hz. The dive angle was corrected with the attachment angle of the data logger estimated when the birds were at the water surface [15]. Speed data were obtained from propeller rotation data if these were available, and if not, the speed was calculated by the rate of change in depth/sine (dive angle) assuming that the birds moved forward in the direction of the tail-to-head axis. For the five ADPE whose propeller rotation data were available, the association between the propeller rotation and swimming speed was obtained for all dives from each individual, and the vertical changes obtained from the dive angle and propeller rotation were com-pared with the actual vertical changes from the depth data for each dive [33]. Because the possibility existed for errors in speed estimation based on the dive angle and rate of change in depth when the dive angle approached 0° or 90°, data points with swim speed calculated using dive angles <10° or >80° were excluded from analyses. In addition, because the maximum speed measured by the propeller rotation data from all dives was <3.5 m/s, data points with swim speeds calculated using the dive angle and rate of change of depth in >3.5 m/s, possibly result-ing from other errors, were excluded from the analyses.
and species and individual animal as factors. Because we were not interested in the differences across individuals and dive order, the individual animal and dive order were treated as random variables. Before modelling, collinear-ity (i.e. high correlation between explanatory variables) was examined by pairwise scatterplots, the correlation coefficients calculation, and variance inflation factors (VIF) [35]. The VIF values are the reciprocal of tolerance (1 − R2), showing how much the variance of the
esti-mated regression coefficients are inflated compared to when the predictor variables are not linearly related. Because a high correlation (r = 0.8) existed between the dive angle and rate of change in depth, the rate of change in depth was removed from the model’s variables. We considered that the birds regulated the rate of change in depth towards the bottom depending on the speed in the direction of the tail-to-head axis and the dive angle, and the angular fluctuation was better reflected in the speed and the dive angle relative to the direction of buoyancy (i.e. vertical direction). A high correlation (r = 0.9) also existed between the max dive depth and dive time, and the dive time was removed from the model’s variables. We considered that the effect of buoyancy was better reflected in max dive depth if the birds regulated their inhaled air volume depending on their target max dive depth.
As a result, two types of variable combinations for the full model were considered. First, the combinations of species, dive angle, speed, max dive depth, dynamic acceleration RMS, and current depth were considered as explanatory variables for the full model (Trial 1). The variables of current depth and max dive depth had a rela-tively high correlation (r = 0.7), and the VIF values for max dive depth (4.41) were a little higher (VIF values of the other variables were <3). This result is not surpris-ing because certain depths can only be visited if the max depth allows for it. However, these variables were both selected for the analysis because we aimed to examine the effect of both current depth and max dive depth to the response variable. Because the analysis of Trial 1 indicated a significant effect of max dive depth and the 95 % point-wise confidence intervals for current depth were relatively wide (see the “Results” section and Addi-tional files 4: Table S3, 5: Table S4), the current depth was replaced with the percentage of the current depth to max dive depth reached during a dive (hereafter, current depth percentage), which considers the effect of the cur-rent depth in relation to the max dive depth. Therefore, the combinations of species, dive angle, speed, dynamic acceleration RMS, current depth percentage, and max dive depth were considered explanatory variables for the full model (Trial 2). In this case, the VIF values of all explanatory variables were <3.
The GAMM analyses were performed using the “gamm” function of the “mgcv” package [34] in R using cross-validation. Model selection protocols followed the methods in [35, 36]. Gamma distribution with a log link function was used for the response variable distribution. First, full models using the same covariate but different random structures were fitted with the restricted maxi-mum likelihood estimation (REML). Optimal random structure was decided by examining the autocorrelation lag plots, and the normalised residuals against independ-ent variables, including those not in the models. Indi-vidual animals and dive number were used as random intercepts to model the random variance across animals and dives, and within-animal serial autocorrelations (ARMA model) were modelled to account for repeated measurements on the same animal during a trip. Then, an optimum fixed structure fitted with the ML was selected by the Akaike information criteria (AIC). The interactions between the smooth and factor terms were also modelled where appropriate. The significance of the terms included in the final models was examined using approximate p values from the “mgcv” output. The final results are presented using the REML estimation.
Values are represented as the mean ± SD. The signif-icance level was generally set at p < 0.05 except for the smoothers in the GAMM fitted using the “mgcv”, for which p < 0.01 is generally considered significant.
Results
We obtained data from 241 dives from eight ADPE (body mass: mean ± SD 4.22 ± 0.31 kg), 104 dives from 2 RHAU (body mass 0.54 ± 0.04 kg), and 15 dives from 2 BRGU (body mass 1.04 ± 0.07 kg) (Additional file 1: Table S1). Angular velocity, as well as dynamic accelera-tion, of all three species fluctuated with wing beat in the descent periods (Fig. 1a, b, example shown only for the ADPE). Video footage obtained from the video data log-ger attached to the ADPE is provided as Additional file 2: Video S1 to show the body fluctuation with wing beat.
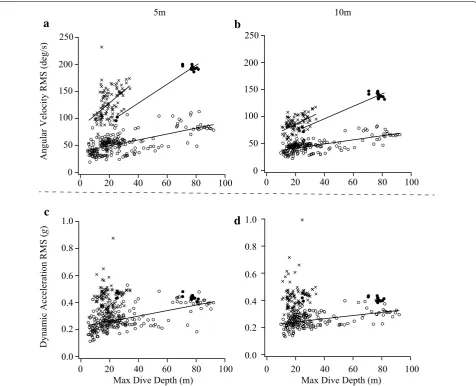
positive (Additional file 4: Table S3). The effect of the current depth on the angular velocity RMS increase was especially large until a depth of approximately 20 m, and then the effect decreased and approached a plateau after approximately 20 m (Additional file 5: Table S4). The dynamic acceleration RMS was larger near the sea sur-face than at deeper depths in all three species (Fig. 2d– f), although the correlation coefficients between the dynamic acceleration RMS and the current depth were significantly negative only in the ADPE and BRGU (Pear-son’s r = −0.10, and p < 0.0001 for ADPE; r = −0.34, and p < 0.0001 for BRGU; and r = 0.00, and p = 0.82 for RHAU). The dynamic acceleration RMS at a given cur-rent depth (e.g. 5 and 10 m) significantly increased with max dive depth for ADPE but not for BRGU and RHAU (Fig. 3c, d; Additional file 3: Table S2).
Because the angular velocity RMS of all three species at a given current depth was suggested to change with the max dive depth, the values were also represented as the percentage of the current depth to max dive depth (cur-rent depth percentage) in each dive (Additional file 6: Figure S1). The angular velocity RMS was also nega-tively correlated with the current depth percentage for
all three species (Pearson’s r = −0.57, and p < 0.0001 for the ADPE; r = −0.79, and p < 0.0001 for the BRGU; and r = −0.75, and p < 0.0001 for the RHAU), showing larger negative Pearson’s r values than when the current depth was used as a covariate. The correlation coefficient of the current depth percentage to the dynamic accel-eration RMS also produced larger negative values than when the current depth was used as a covariate (Pear-son’s r = −0.40, and p < 0.0001 for ADPE; r = −0.36, and p < 0.0001 for BRGU; and r = −0.09, and p < 0.0001 for RHAU).
The effect of the current depth percentage to the angu-lar velocity RMS decreased with increasing current depth percentage and was significantly different among the three species (Fig. 4; Table 1). The effect of the current depth percentage on the angular velocity RMS of the ADPE was generally lower than the BRGU and RHAU at the current depth percentage of 0–20 (e.g. near the sea surface, approximately 0.2 for ADPE, approximately 1.0 for BRGU, and approximately 0.6 for RHAU; Fig. 4). The effects of the dynamic acceleration RMS to the angular velocity RMS increased with an increase of the dynamic acceleration RMS (Fig. 4; Table 1). The contribution of Angular Velocity RMS ( S M R noi tar ele cc A ci ma ny D g ) 0.8 0.6 0.4 0.0 0.2 1.0
ADPE BRGU RHAU
60 40 20 0 80
Max Dive Depth (m
) 60 40 20 0 80 100
Current Depth (m ) 60 40 20 0 80100
Max Dive Depth (m ) (deg/s ) 200 250 0 100 60 40 20 0 80 100 Current Depth (m ) 60 40 20 0 80100
Max Dive Depth (m ) 60 40 20 0 80 100
Current Depth (m ) 60 40 20 0 80100 Max Dive Depth (m) 60 40 20 0 80 100 Curren t Depth (m
) 60 40 20 0 80100 Max Di ve Depth (m
) 0.8 0.6 0.4 0.0 0.2 1.0 60 40 20 0 80 100 Current De pth (m) 60 40 20 0 80100 Max Dive Depth (m) 0.8 0.6 0.4 0.0 0.2 1.0 60 40 20 0 80 100 Current De pth (m) 60 40 20 0 80100 Max Dive Depth (m ) ( S M R noi tar ele cc A ci ma ny D g ) ( S M R noi tar ele cc A ci ma ny D g ) 50 150 Angul ar Ve lo city RMS (deg/ s) 200 250 0 100 50 150 A ngular Velocity R MS (deg/ s) 200 250 0 100 50 150 100
a
b
c
d
e
f
the dynamic acceleration RMS to the angular fluctuations was significantly different among the species, and the effect of the higher dynamic acceleration RMS (greater than approximately 0.4 g) of penguins on the angular acceleration RMS was lower than for alcids (Fig. 4). The effect of speed on the angular velocity RMS significantly decreased with the increase of the value, whereas the effect of pitch on the angular velocity RMS significantly increased with the increase of the value (Table 1). Nota-bly, the effects of the max dive depth on the angular velocity RMS significantly decreased with the increase of their values (Table 1).
The angular velocity RMS for the RHAU (97.18 ± 33.92°/s, n = 2112) over the range of depths during the descent was significantly larger than for the BRGU (81.16 ± 41.92°/s, n = 766) (Fig. 5a; Addi-tional file 7: Table S5), although the RHAU and BRGU had comparable angular velocity RMS near the sea sur-face (Fig. 6). The angular velocity RMS of the ADPE (41.30 ± 13.64°/s, n = 4612) over the range of depths during descent was significantly smaller than for the two alcids (Figs. 5a, 6; Additional file 7: Table S5). The angu-lar velocity RMS of all three species reached a plateau after current depth percentage (to the target depth) of
m 0 1 m
5
250
200
100
0
Angular Velocity RMS (deg/s)
Dynamic Acceleration RMS
(
g
)
0.6
0.4
0.2
0.0 0.8
0 20 40 60 80
Max Dive Depth (m) 1.0
100 150
50
0 20 40 60 80 100
250
200
100
0 150
50
0.6
0.4
0.2
0.0 0.8 1.0
0 20 40 60 80
Max Dive Depth (m) 100
0 20 40 60 80 100
b
a
c
d
Fig. 3 Angular velocity and dynamic acceleration with max dive depth at a given current depth. Relationships between max dive depth in each dive and a, b the angular velocity RMS and c, d the dynamic acceleration RMS at a given current depth from each species (open circle ADPE, filled
circle BRGU, cross RHAU) (at 5 m, N= 211, 14, and 101, respectively, for ADPE, BRGU, and RHAU in a, c, and at 10 m, n= 160, 15 and 98, respectively,
for ADPE, BRGU, and RHAU in b, d). The relationship can be described by the following linear equations: (a) (at 5 m) ADPE: y= 0.55x+ 38.26, BRGU: y= 1.76x+ 57.89, RHAU: y= 2.25x+ 83.46. (b) (at 10 m) ADPE: y= 0.38x+ 33.78, BRGU: y= 1.16x+ 49.47, RHAU: y= 1.31x+ 59.24. (c) (at 5 m) ADPE: y= (2.04x+ 217.80) × 10−3. (d) (at 10 m) ADPE: y= (1.18x+ 217.13) × 10−3. Significant linear relationships are also represented as lines.
approximately 60 % (Fig. 6). The dynamic acceleration RMS values for the RHAU (0.42 ± 0.08 g, n = 2112) and the BRGU (0.42 ± 0.04 g, n = 766) were relatively similar and significantly larger than that observed for the ADPE (0.24 ± 0.06 g, n = 4612) (Fig. 5b; Additional file 7: Table S5).
Discussion
The aim of this study was to quantify the in situ angu-lar fluctuation and stability of the self-generated pertur-bations (mainly recoil force from wing beat) of diving seabirds in their natural environments. Because angular
fluctuations can destabilise the trajectory and decrease the locomotory performance [3, 5], the angular stability should be one of the key factors affecting efficient loco-motion. We acknowledge that we only studied a small number of birds for the RHAU and BRGU, and the sam-ple size for dives was especially limited for the BRGU. We assume that the overall results of the BRGU are rep-resentative, however, because a similar trend of angular velocity (e.g. with depth) was observed in the RHAU and ADPE. However, any conclusions associated with the BRGU may require caution, and the results obtained in this study need to be confirmed with larger sample sizes.
s(Dynamic Acceleration RMS, 7.53)
Species == ADPE
2
-6 -2 0
-4
0.0 0.2 0.4 0.6 0.8 1.0 Dynamic Acceleration RMS (g)
s(Dynamic Acceleration RMS, 3.08) s(Dynamic Acceleration RMS, 7.48)
0.0 0.2 0.4 0.6 0.8 1.0 Dynamic Acceleration RMS (g)
0.0 0.2 0.4 0.6 0.8 1.0 Dynamic Acceleration RMS (g) 2
-6 -2 0
-4
Species == BRG
U
Species == RHAU
2
-6 -2 0
-4
0 20 40 60 80
Current Depth Percentage (%) 100
s(Current Depth Percentage, 7.51
)
Species == ADPE
-1 2
1
0
-2
0 20 40 60 80
Current Depth Percentage (%)
100 0 20 40 60 80
Current Depth Percentage (%) 100
s(Current Depth Percentage, 6.96
)
s(Current Depth Percentage, 7.50
)
Species == BRG
U
Species == RHAU
-1 2
1
0
-2
-1 2
1
0
-2
a
b
c
d
e
f
Overall trend of the angular velocity RMS
As predicted, the birds from all three species exhibited higher angular velocity RMS values near the sea sur-face, suggesting that it was easier for the birds to rotate near the sea surface. Then, the angular velocity RMS decreased with the depth reaching a plateau after current depth percentage (to the target depth) of approximately 60 %. These results indicate that the angular fluctuation experienced by the birds decreased with depth, which may allow the birds to have high pitching stability at the bottom of dives, where foraging occurs.
Factors affecting the angular velocity RMS
Several factors, such as dynamic acceleration RMS, cur-rent depth, dive angle, speed and max dive depth, were shown to significantly affect the angular velocity RMS of diving wing-propelled seabirds during descent.
First, higher dynamic acceleration had a greater effect on angular fluctuation. This observation is not surprising Table 1 Summary statistics of the GAMM (Trial 2)
Summary statistics of the GAMM (Trial 2) fitted to the angular velocity RMS via the “mgcv” package [34]. The effects of nonlinear term, indicated by s(), are shown in
Fig. 4
Response Model term Parametric coefficient df F value p value
Angular velocity RMS (°/s) Max dive depth −0.0027 1.00 101.25 <0.0001
Speed −0.0358 1.00 75.17 <0.0001
Pitch 0.0027 1.00 72.64 <0.0001
s(dynamic acceleration RMS): ADPE 7.53 383.67 <0.0001 s(dynamic acceleration RMS): BRGU 3.08 36.18 <0.0001 s(dynamic acceleration RMS): RHAU 7.48 62.00 <0.0001 s(current depth percentage): ADPE 7.51 88.21 <0.0001 s(current depth percentage): BRGU 6.96 219.88 <0.0001 s(current depth percentage): RHAU 7.50 296.67 <0.0001
Dynamic Acceleration RMS
(
g
)
Angular Velocity RMS (deg/s) 0 50 150
100 200
ADPE BRGU RHAU 0.0
0.2 0.6
0.4 0.8 1.0
ADPE BRGU RHAU
b
a
Fig. 5 Overall angular velocity RMS and dynamic acceleration RMS. Boxplot showing a angular velocity RMS, b dynamic acceleration RMS for all the individuals of each species (ADPE, BRGU, and RHAU) over all descents
Current Depth Percentage (%)
Angular Velocity RMS (deg/s)
200
0 100
75 50
25
0 100
250
150
50
Fig. 6 Overall trend of angular velocity RMS. Mean ± standard error of the mean (SEM) of angular velocity RMS with the current depth percentage to max dive depth for each species (open circle ADPE,
because a higher magnitude of wing forces would result in higher recoil forces from the medium. Because descending penguins and alcids are known to adjust their swim speed within relatively narrow ranges to reduce drag forces [8, 9, 37], the decrease of the dynamic accel-eration RMS with depth may reflect a reduction in the effort required to maintain a certain speed, involving buoyancy reduction with depth. However, a higher mag-nitude of wing forces would be required near the sea sur-face to counter the buoyancy, thereby partly resulting in the high angular fluctuations at the beginning of the dive.
Second, the effect of the current depth on the angular velocity RMS was greater until approximately 20 m, and then the effect decreased and approached a plateau after approximately 20 m. This change of the effect of the cur-rent depth is likely because of the effect of buoyancy that dramatically changes until a depth of 20 m according to Boyle’s law [8, 9]. If the buoyancy is larger, the magnitude of recoil forces at a given magnitude of wing forces would be larger. However, if the air contained in the lung and feathers is greatly compressed, the magnitude of recoil forces at a given magnitude of wing forces would be smaller. Thus, the birds can have higher pitching stability with increasing depth.
Third, when the dive angle became more vertical, a greater effect of dive angle on the angular fluctuation was observed. This may be because a higher magnitude of wing forces would be required to counter the absolute values of the sum of the vectors of buoyancy and drag [9,
13] if the dive angle was more vertical, resulting in the generation of a larger recoil force.
Fourth, higher speed contributed to lower angular fluctuations. Because trimming force to stabilise the posture becomes less effective at low speed [3], a higher speed may produce less rotational fluctuation. Whereas higher drag force involved with the higher speed [8, 37] may require a higher magnitude of wing forces and more energy to counter the drag force, the higher speed may promote pitching stability.
Finally, the max dive depth had positive contributions to angular fluctuation, suggesting that the birds changed their locomotion or behaviour depending on their target max dive depth. The contributions of the max dive depth to angular fluctuation may also be explained by the pat-tern of narrower 95 % point-wise confidence intervals of the current depth percentage effect on the angular veloc-ity RMS (Trial 2) rather than using the current depth as a covariate (Trial 1). Additionally, the angular velocity RMS at a given depth (e.g. 5 and 10 m) significantly increased with the max dive depth for all three species. Consider-ing that the buoyancy change, mostly caused by the com-pression of the air in the lung and feathers, should affect the magnitude of recoil forces at a given magnitude of
wing forces, the results may indicate the possibility of buoyancy regulation of the target dive depth before div-ing. Thus, the recoil forces resulting from the buoyancy can be mitigated if the volume of inhaled air is adjusted to the optimal volume required for the dive. Possibly, the seabirds showed a higher magnitude of upthrust force to counteract the greater buoyancy, hence resulting in higher pitching fluctuations near the sea surface. How-ever, the upthrust force of the birds that is required to displace themselves for a given distance, especially near the sea surface, possibly can be mitigated if the volume of inhaled air is less. Previously, penguins have been dem-onstrated to change stroke frequency, dive angle, and stroke amplitude and adjust the volume of inhaled air before diving, depending on their target max dive depth [12, 16, 18]. Because alcids are also known to regulate the dive angle relative to the max dive depth of each dive [13], possibly, the alcids also regulate their buoyancy relative to the max dive depth of each dive. When the current depth percentage was used instead of the cur-rent depth as a covariate for the GAMM (Trial 2), the effect of the max dive depth to the angular velocity RMS became smaller with the increase of the value. Because the effect of the current depth relative to the max dive depth reflected the current depth percentage, the effect of the max dive depth would reflect the buoyancy regula-tion relative to the value of the max dive depth. In other words, less angular fluctuations would be present if the volume of inhaled air was less even for a deeper target diving depth.
called the metacentric height, may affect the stability of the seabirds. The apparent body weight of a bird can change with changing buoyancy and weight in water. All these factors would affect the changes in the moment of inertia and the resulting rotational fluctuations in diving seabirds. In fish, the head and fins ahead of the centre of mass can create large torques [7]. Although no published research exists for this subject in penguins and alcids, the movement of the tail also may have affected the body sta-bility of the birds [20, 39]. Cormorants in a shallow dive have been suggested to use their tails simultaneously with paddling to control body tilting, producing a downward-directed hydrodynamic lift to resist buoyancy [20]. Even changes in the total body mass, body size, or mass dis-tribution from carrying a food load in the stomach (pen-guins) or in the bills (murres and auklets) might affect the moment of inertia, and some adjustment in behaviour might be required to maintain the same level of stability.
Although this study focused on the pitching fluctua-tions caused by self-generated perturbation, posture instability may also be induced by environment pertur-bations [3] such as rough conditions at the sea surface and unpredictable current or turbulence in water, which would also affect the angular fluctuation during dives. Under harsh conditions, a higher magnitude of wing forces may be needed if seabirds are to return to the required trajectory, hence resulting in higher angular fluctuation, especially at the sea surface where the buoy-ancy is large. In addition, external perturbations due to other individuals swimming nearby, especially for pen-guins usually diving with flocks, could potentially induce the posture fluctuation.
Comparison among the three species
Overall, our results support the hypothesis that flight-less penguins have a higher pitching stability than alcids, although this needs to be confirmed by studying a larger number of species of penguins and auks. Assuming that angular instability increases the energy cost of diving [3], our results accord with a recent study showing that the energy costs of diving are lower in penguins than in similar-sized flying wing-propelled divers (guillemot and auklets) [22]. The angular fluctuation exhibited by the ADPE was smaller than the BRGU and RHAU during entire descent periods. Notably, as with the comparison between the two species of alcids, the angular fluctua-tion of the BRGU was high and comparable to the RHAU near the sea surface; however, the angular fluctuation of the BRGU was lower than those of the RHAU in deeper depths, which may indicate the greater locomotory effi-ciency of the BRGU than the RHAU.
Several factors may have contributed to the higher pitching stability of the flightless penguins relative to the
alcids, which fly in air and dive in water. Because flying divers face trade-offs between maximising their locomo-tory performance in one medium relative to the other [22], the difference of the pitching stability among pen-guins and alcids may be associated with their morpho-logical and kinetic characteristics adapted for survival in their environment. First, the body mass would be an important factor for determining body stability. This is because the moment of inertia linearly increases with the increased body mass, hence promoting stability. The body mass of penguins is generally greater than ~1 kg, whereas alcids weigh less than ~1 kg. The BRGU (body mass is approximately 1 kg) represents an extreme exam-ple in body mass among the flying wing-propelled divers, and the RHAU exhibits half the body mass (approxi-mately 0.5 kg) of the BRGU. These differences in mass may have contributed to the difference of angular fluctu-ations according to the order RHAU, BRGU, and ADPE, from high to low. In future study, an examination of the pitching fluctuation of flightless penguins whose body mass approaches 1 kg (e.g. the Little penguin) would be interesting to compare mitigating factors in the effect of body mass among penguins and alcids.
Second, the difference in buoyancy would be another important factor affecting the difference of body stabil-ity among the three species. Alcids have 1.4 times greater air volume per mass than penguins [24]. Higher buoy-ancy would require a higher magnitude of wing forces, resulting in higher recoil forces and angular fluctua-tions. Mass-specific buoyancy at the water surface was estimated to be greater for the RHAU (6.3 N kg−1) than
the BRGU (4.9 N kg−1) [9], which may partly explain
why the angular fluctuation of the RHAU is higher than the BRGU even though the air was compressed during descent according to Boyle’s law.
body stability, the energy loss caused by the larger drag force of the larger wingspan may be significant.
Fourth, the stroke pattern may also contribute to the difference in angular fluctuations among the three spe-cies. The contribution of the dynamic acceleration RMS to angular fluctuations was different among species, and the effect of the higher dynamic acceleration RMS (greater than approximately 0.4 g) of penguins on the angular acceleration RMS was lower than in alcids, which may be related to the difference in stroke pattern. For example, penguins swim steadily by producing lift dur-ing both upstroke and downstroke, whereas alcids swim unsteadily because they mainly use downstroke for pro-pulsion [9]. Higher angular fluctuations would only occur in downstroke (alcids) than in both upstroke and down-stroke, most likely by cancelling the recoil forces of each stroke (penguins). The low wing-beat frequency obtained in penguins by optimising the muscle contraction rate [22] may also contribute to the reduced instantaneous angular velocity.
We need to note that whereas the angular velocity RMS at a given depth significantly increased with the max dive depth for all three species, the dynamic acceleration RMS at a given depth significantly increased with the max dive depth only in the ADPE, and not in the BRGU and RHAU. The dynamic acceleration RMS from the RHAU and BRGU over the range of depths during descent was relatively similar between the BRGU and the RHAU. These results suggest that the magnitude of wing forces of the BRGU and RHAU was not necessarily reflecting a behavioural change related to the target max dive depth, which may be supported by the fact that no significant effect of the thrust frequency has been observed on the target max dive depth in alcids [13]. Thus, angular fluc-tuations, rather than dynamic acceleration, may be useful parameters that likely reflect buoyancy regulation of the target max dive depth.
Utility of gyroscope to quantify angular fluctuations
Recently, gyroscopes have been used to monitor the detailed 3D motions of animals [26, 40] and to identify complex behaviours and body movements that have been difficult to study using only accelerometers and mag-netometers [41, 42]. In this study, we used a gyroscope to quantify the in situ angular velocity of diving seabirds to gain an understanding of their rotational stabilities. Many previous studies have quantified the hydrodynamic stabil-ity of aquatic animals in the laboratory using video footage [2, 20, 21]. However, a video camera system is difficult to implement in the field, and an examination of the changes in angular fluctuations of animals diving to great depths and exhibiting various behaviours in the wild is also diffi-cult. To our knowledge, this is the first study quantifying
the in situ angular fluctuation of the body of aquatic ani-mals in their natural environments. Although our research focused on the pitching stability of a period during the descent dive, animals would face posture fluctuation in the other direction of rotations (i.e. rolling and yawning) and during the other behaviours (e.g. prey capture and flying). The in situ angular fluctuation data obtained by gyroscope would be useful for understanding how animal faces pos-ture instability during their behaviour under self-generated or environmental perturbations, which may highlight the locomotory strategy associated with rotational instabil-ity. The novel methodology using a gyroscope may also be used for other animals (fish, flying birds, etc.) to investigate and understand the movement stability of diving animals in the field. Because the recoil motions associated with appendage beating are observed for other animals (e.g. sea turtle [25]), a comparison of the patterns in in situ angular fluctuations among various animals would be interesting.
Conclusions
Abbreviations
RMS: root mean square. Statistical measure of the magnitude of varying quantity. 1
N
N
i=1Yt2; ADPE: Adélie penguin (P. adeliae); BRGU: Brünnich’s guillemot (U. lomvia); RHAU: Rhinoceros auklet (C. monocerata).
Authors’ contributions
TN, HM, and NA designed and developed the gyroscope data logger. All authors contributed to the design of the experimental study. TN, DMK, AT, and HM executed field works. TN analysed the data and wrote the draft of manu-script. All authors provided critiques on the research and the manumanu-script. All authors read and approved the final manuscript.
Author details
1 Graduate School of Informatics, Kyoto University, Kyoto 606-8501, Japan. 2 Department of Polar Science, SOKENDAI, Tokyo 190-8518, Japan. 3 National Institute of Polar Research, Tokyo 190-8518, Japan. 4 Field Science Education and Research Centre, Kyoto University, Kyoto 606-8502, Japan.
Acknowledgements
We would like to thank three anonymous referees, whose comments greatly improved this manuscript. We would like to thank the members of the 54th Japanese Antarctic Research Expedition (JARE54) and the crew of the icebreaker Shirase for the logistics and field support for penguin studies in the Antarctica. We also wish to thank Nobuo Kokubun, Takashi Yamamoto, and Alexander Kitaysky for the support of BRGU field studies in Pribilof Islands and Yutaka Watanuki, Nobuhiko Sato, and Kenji Hoshina for the support of RHAU field studies in Teuri Islands. This research was supported by the Grant-in-aid for Scientific Research from the Japanese Society for the Promotion of Science of 20310016 to AT, 26-5363 to DMK, and partly 10J06259 to TN.
Additional files
Additional file 1: Table S1. Summary table of descriptive information and diving data of studied penguins and alcids.
Additional file 2: Video S1. Video data showing the body fluctuation of ADPE. Video data, obtained from the video data logger attached to the back of ADPE, showing the body fluctuation occurring simultaneously with the wing beat during descent.
Additional file 3: Table S2. Summary table of ordinary least square regression (OLS) analysis. OLS regression analysis was applied between each of the angular velocity RMS and dynamic acceleration RMS obtained at a given depth (5 m and 10 m) and max dive depth in each dive for ADPE, BRGU, and RHAU.
Additional file 4: Table S3. Summary statistics of the GAMM model (Trial 1). Summary statistics of the GAMM model (Trial 1) fitted to the angular velocity RMS via the ‘mgcv’ package [34]. The effects of nonlinear term, indicated by s(), are shown in Additional file 5.
Additional file 5: Table S4. GAMM analysis on the angular velocity RMS (Trial 1). Pattern of the effect of (a)(b)(c) the dynamic acceleration RMS, and (d)(e)(f ) the current depth of each species [(a)(d): ADPE, (b)(e): BRGU, (c)(f ): RHAU] on the angular velocity RMS (Trial 1). Estimated smoothing functions (solid lines) with 95 % point-wise confidence intervals (dashed lines). s() and the number in the parenthesis indicate the smoothing term and the estimated degrees of the smoother, respectively. The vertical lines along the x-axis indicate the values of observations.
Additional file 6: Figure S1. Changes in (a)(b)(c) the angular velocity RMS and (d)(e)(f ) the dynamic acceleration RMS with the current depth percentage and the max dive depth from each species [(a)(d): ADPE, (b)(e): BRGU, (c)(f ): RHAU]. Colour also represents the max dive depth for each data point for visual aid. Because of many data points, data from only 2 individuals (APE/12108B and APE/12129B) are shown for the ADPE. Additional file 7: Table S5. Summary table of pairwise test for overall angular velocity and dynamic acceleration among three species. Games Howell test applied to the angular velocity RMS and dynamic acceleration RMS obtained from the entire descents of ADPE, BRGU, and RHAU.
Competing interests
The authors declare that they have no competing interests.
Received: 19 February 2015 Accepted: 22 March 2016
References
1. Webb PW. Is the high cost of body/caudal fin undulatory swimming due to increased friction drag or inertial recoil? J Exp Biol. 1992;162:157–66. 2. Rivera G, Rivera ARV, Blob RW. Hydrodynamic stability of the painted
turtle (Chrysemys picta): effects of four-limbed rowing versus forelimb flapping in rigid-bodied tetrapods. J Exp Biol. 2011;214:1153–62. 3. Webb PW. Control of posture, depth, and swimming trajectories of fishes.
Integr Comp Biol. 2002;42:94–101.
4. Weihs D. Stability versus maneuverability in aquatic locomotion. Integr Comp Biol. 2002;42:127–34.
5. Fish FE. Balancing requirements for stability and maneuverability in cetaceans. Integr Comp Biol. 2002;42:85–93.
6. Hove JR, O’Bryan LM, Gordon MS, Webb PW, Weihs D. Boxfishes (Teleostei: Ostraciidae) as a model system for fishes swimming with many fins: kinematics. J Exp Biol. 2001;204:1459–71.
7. Webb PW. Is tilting behaviour at low swimming speeds unique to negatively buoyant fish? Observations on steelhead trout, Oncorhynchus
mykiss, and bluegill, Lepomis macrochirus. J Fish Biol. 1993;43:687–94.
8. Lovvorn JR, Croll DA, Liggins GA. Mechanical versus physiological deter-minants of swimming speeds in diving Brunnich’s guillemots. J Exp Biol. 1999;202:1741–52.
9. Watanuki Y, Wanless S, Harris M, Lovvorn JR, Miyazaki N, Tanaka H, Sato K. Swim speeds and stroke patterns in wing-propelled divers: a comparison among alcids and a penguin. J Exp Biol. 2006;209:1217–30.
10. Lovvorn JR, Watanuki Y, Kato A, Naito Y, Liggins GA. Stroke patterns and regulation of swim speed and energy cost in free-ranging Brünnich’s guil-lemots. J Exp Biol. 2004;207:4679–95.
11. Wilson RP, Shepard E, Laich AG, Frere E, Quintana F. Pedalling downhill and freewheeling up: a penguin perspective on foraging. Aquat Biol. 2010;8:193–202.
12. Ropert-Coudert Y, Kato A, Baudat J, Bost C-A, Le Maho Y, Naito Y. Time/ depth usage of Adelie penguins: an approach based on dive angles. Polar Biol. 2001;24:467–70.
13. Watanuki Y, Sato K. Dive angle, swim speed and wing stroke during shal-low and deep dives in Common Murres and Rhinoceros Auklets. Ornithol Sci. 2008;7(1):15–28.
14. Sato K, Charrassin J-B, Bost C-A, Naito Y. Why do macaroni penguins choose shallow body angles that result in longer descent and ascent durations? J Exp Biol. 2004;207:4057–65.
15. Watanuki Y, Niizuma Y, Geir WG, Sato K, Naito Y. Stroke and glide of wing-propelled divers: deep diving seabirds adjust surge frequency to buoyancy change with depth. Proc R Soc B Biol. 2003;270:483–8. 16. Wilson RP, Zimmer I. Inspiration by Magellanic penguins: reduced
swim-ming effort when under pressure. Mar Ecol Prog Ser. 2004;278:303–7. 17. Kato A, Ropert-Coudert Y, Gremillet D, Cannell B. Locomotion and
foraging strategy in foot-propelled and wing-propelled shallow-diving seabirds. Mar Ecol Prog Ser. 2006;308:293–301.
18. Sato K, Naito Y, Kato A, Niizuma Y, Watanuki Y, Charrassin JB, Bost CA, Handrich Y, Le Maho Y. Buoyancy and maximal diving depth in penguins: do they control inhaling air volume? J Exp Biol. 2002;205:1189–97. 19. Cook TR, Kato A, Tanaka H, Ropert-Coudert Y, Bost C-A. Buoyancy under
control: underwater locomotor performance in a deep diving seabird suggests respiratory strategies for reducing foraging effort. PLoS One. 2010;5:e9839.
20. Ribak G, Weihs D, Arad Z. How do cormorants counter buoyancy during submerged swimming? J Exp Biol. 2004;207:2101–14.
21. Ribak G, Weihs D, Arad Z. Consequences of buoyancy to the maneuver-ing capabilities of a foot-propelled aquatic predator, the great cormorant
(Phalcrocorax carbo sinensis). J Exp Biol. 2008;211:3009–19.
• We accept pre-submission inquiries
• Our selector tool helps you to find the most relevant journal
• We provide round the clock customer support
• Convenient online submission
• Thorough peer review
• Inclusion in PubMed and all major indexing services
• Maximum visibility for your research
Submit your manuscript at www.biomedcentral.com/submit
Submit your next manuscript to BioMed Central
and we will help you at every step:
biomechanical hypothesis for flightlessness in penguins. Proc Natl Acad Sci. 2013;110:9380–4.
23. Lovvorn JR. Upstroke thrust, drag effects, and stroke-glide cycles in wing-propelled swimming by birds. Am Zool. 2001;41:154–65.
24. Wilson RP, Hustler K, Ryan PG, Burger AE. Diving birds in cold water: do Archimedes and Boyle determine energetic costs? Am Nat. 1992;140:179–200.
25. Noda T, Okuyama J, Koizumi T, Arai N, Kobayashi M. Monitoring attitude and dynamic acceleration of free-moving aquatic animals using a gyro-scope. Aquat Biol. 2012;16:265–76.
26. Noda T, Kawabata Y, Arai N, Mitamura H, Watanabe S. Animal-mounted gyroscope/accelerometer/magnetometer: in situ measurement of the movement performance of fast-start behaviour in fish. J Exp Mar Biol Ecol. 2014;451:55–68.
27. Sato K, Shiomi K, Watanabe Y, Watanuki Y, Takahashi A, Ponganis PJ. Scaling of swim speed and stroke frequency in geometrically similar penguins: they swim optimally to minimize cost of transport. Proc R Soc B. 2010;277:707–14. doi:10.1098/rspb.2009.1515.
28. Wilson RP, Grant WS, Duffy DC. Recording devices on free-ranging marine animals: does measurement affect foraging performance? Ecology. 1091;1986:67.
29. Culik BM, Bannasch R, Wilson RP. External devices on penguins: how important is shape? Mar Biol. 1994;118:353–7.
30. Ropert-Coudert Y, Bost C-A, Handrich Y, Bevan RM, Butler PJ, Woakes AJ, Le Maho Y. Impact of externally attached loggers on the diving behaviour of the king penguin. Physiol Biochem Zool. 2000;73:438–44.
31. McKinney W. Python for data analysis: data wrangling with Pandas, NumPy, and IPython. Sebastopol: O’Reilly Media; 2012.
32. Hunter JD. Matplotlib: a 2D graphics environment. Comput Sci Eng. 2007;9:90–5.
33. Sato K, Mitani Y, Cameron MF, Siniff DB, Naito Y. Factors affecting stroking patterns and body angle in diving Weddell seals under natural condi-tions. J Exp Biol. 2003;206:1461–70.
34. Wood S. Generalized additive models. Boca Raton: CRC Press; 2006. 35. Zuur AF, Ieno EN, Walker NJ, Saveliev AA, Smith GM. Mixed effects models
and extensions in ecology with R. New York: Springer; 2009.
36. Zuur AF, Saveliev AA, Ieno EN. A beginner’s guide to generalised additive mixed models with R. Newburgh: Highland Statistics; 2014.
37. Lovvorn J, Liggins GA, Borstad MH, Calisal SM, Mikkelsen J. Hydrodynamic drag of diving birds: effects of body size, body shape and feathers at steady speeds. J Exp Biol. 2001;204:1547–57.
38. Dudley R. Mechanisms and implications of animal flight maneuverability. Am Zool. 2000;40:1003.
39. Thomas ALR. Why do birds have tails? The tail as a drag reducing flap, and trim control. J Theor Biol. 1996;183:247–53.
40. Fourati H, Manamanni N, Afilal L, Handrich Y. Posture and body accelera-tion tracking by inertial and magnetic sensing: applicaaccelera-tion in behav-ioral analysis of free-ranging animals. Biomed Signal Process Control. 2011;6:94–104.
41. Noda T, Kawabata Y, Arai N, Mitamura H, Watanabe S. Monitoring escape and feeding behaviours of cruiser fish by inertial and magnetic sensors. PLoS One. 2013;8:e79392.