www.atmos-meas-tech.net/4/379/2011/ doi:10.5194/amt-4-379-2011
© Author(s) 2011. CC Attribution 3.0 License.
Atmospheric
Measurement
Techniques
An over-land aerosol optical depth data set for data assimilation
by filtering, correction, and aggregation of MODIS Collection 5
optical depth retrievals
E. J. Hyer1, J. S. Reid1, and J. Zhang2
1Naval Research Laboratory, 7 Grace Hopper Avenue, Monterey, CA 93943, USA
2University of North Dakota, 4149 University Avenue Stop 9006, Grand Forks, ND 58202, USA Received: 12 August 2010 – Published in Atmos. Meas. Tech. Discuss.: 14 September 2010 Revised: 4 February 2011 – Accepted: 4 February 2011 – Published: 1 March 2011
Abstract. MODIS Collection 5 retrieved aerosol optical depth (AOD) over land (MOD04/MYD04) was evaluated using 4 years of matching AERONET observations, to as-sess its suitability for aerosol data assimilation in numeri-cal weather prediction models. Examination of errors re-vealed important sources of variation in random errors (e.g., atmospheric path length, scattering angle “hot spot”), and systematic biases (e.g., snow and cloud contamination, sur-face albedo bias). A set of quality assurance (QA) filters was developed to avoid conditions with potential for signifi-cant AOD error. An empirical correction for surface bound-ary condition using the MODIS 16-day albedo product cap-tured 25% of the variability in the site mean bias at low AOD. A correction for regional microphysical bias using the AERONET fine/coarse partitioning information increased the global correlation between MODIS and AERONET from r2= 0.62–0.65 to r2= 0.71–0.73. Application of these fil-ters and corrections improved the global fraction of MODIS AOD within (0.05±20%) of AERONET to 77%, up from 67% using only built-in MODIS QA. The compliant frac-tion in individual regions was improved by as much as 20% (South America). An aggregated Level 3 product for use in a data assimilation system is described, along with a prognos-tic error model to estimate uncertainties on a per-observation basis. The new filtered and corrected Level 3 product has im-proved performance over built-in MODIS QA with less than a 15% reduction in overall data available for data assimila-tion.
Correspondence to: E. J. Hyer (edward.hyer@nrlmry.navy.mil)
1 Introduction
The Moderate Resolution Imaging Spectroradiome-ter (MODIS) instruments on board the Terra and Aqua platforms provide nearly daily global coverage of key atmo-spheric and land surface parameters. Retrievals of aerosol optical depth (AOD) by MODIS are the most commonly used of any satellite AOD product. Although MODIS is technically a research instrument, its use in operational applications is increasingly widespread. Remote sensing and modeling technology has progressed to a point where operational aerosol data assimilation methods are being implemented for forecasting applications (e.g., Zhang et al., 2008; Hollingsworth et al., 2008).
The use, aggregation, and statistical reduction of remotely sensed aerosol data are application specific. Crucial to the application of AOD data in a data assimilation system is a thorough understanding of the data’s error characteristics. Not only is a global estimate of measurement uncertainty needed, but also a point by point uncertainty determination gained through a thorough understanding of retrieval pro-cesses that can cause both random and systematic errors. AOD data with consistent biases or poorly characterized un-certainties can degrade analyses and forecasts if used in a data assimilation system (Reid et al., 2009).
Oceanography Center (FNMOC) through the Navy Varia-tional Data Assimilation System for AOD (NAVDAS-AOD) into the Navy Aerosol Analysis and Prediction System (NAAPS) (Zhang et al., 2008).
Assimilation of over-land AOD data, however, is a very different problem, both in terms of the retrieval of AOD from satellite observations and assimilation into an atmospheric model. Even without systematic bias, the precision of re-trieved AOD over land is lower than over the ocean. The land surface has strong aerosol sources, and observations in prox-imity to these sources will have stronger spatial and temporal gradients. These gradients reduce the accuracy and precision of AOD retrievals, and interfere with pair-wise comparison to point validation datasets. But the principal challenge of aerosol retrieval over the land surface is the surface itself. Whereas the ocean surface is dark and well characterized, the land surface is brighter and more heterogeneous with strong temporal variability.
The strongest aerosol signal in visible wavelengths comes from scattering of incoming solar radiation. Inverting to ob-tain the signal of aerosol effects from reflected light requires simultaneous retrieval of the surface reflectance. As surface brightness increases, the relative contribution of the atmo-spheric radiance decreases, leading to a differential signal-to-noise limitation of the atmospheric component. Thus, re-trieval over a brighter surface requires a tighter constraint on surface reflectance to achieve a comparably precise retrieval of AOD. The complexity and variability of the lower bound-ary condition make over-land retrieval of AOD with passive optical observations very challenging.
The MODIS Collection 5 over-land aerosol retrieval (Levy et al., 2007b; Remer et al., 2006) corrects many of the short-comings of earlier versions, and now represents the state of the art for global retrievals of AOD. It is made publi-cally available in near real time through the NASA Land-Atmosphere Near real-time Capability for EOS (LANCE) (http://lance.nasa.gov). Based on a preliminary analysis, Collection 5 reached the minimum efficacy requirements to be considered for inclusion into the US Navy’s operational aerosol modeling. Preliminary studies without major correc-tion have shown that the inclusion of MODIS over-land data can improve model scores in some regions (Reid et al., 2009). This study expands the Navy’s over ocean data assimila-tion quality dataset (Zhang and Reid, 2006) to include a data assimilation quality Level 3 over land data product based on data collection 5 for ultimate use in NAVDAS-AOD (Zhang et al., 2008). This study is concerned with identifying the various sources of random and systematic error in retrieval of AOD, developing filters and corrections to improve data quality when possible, and characterizing residual uncer-tainty for use in aerosol data assimilation systems.
The center of the current study is an evaluation of the MODIS Collection 5 data product using 4 years of Aerosol Robotic Network (AERONET, Holben et al., 1998) Sun pho-tometer data and available ancillary data sources. Random
and systematic errors in the MODIS Collection 5 AOD re-trieval are examined in detail, with a detailed consideration of both global and regionally specific sources of error. Cor-rections are developed and evaluated for errors caused by the parameterization of the surface boundary condition and by regional microphysical bias. Based on this analysis, a data assimilation ready level 3 product and error model for oper-ational use is presented as the outcome of this study.
2 Data and methods
The methods and rationales for this analysis are similar to the over-ocean study of Zhang and Reid (2006), investigat-ing lower boundary condition, microphysical and cloud bias. However, due to differences between the ocean and land problems two important differences dictate modifications to the protocol. First, the MODIS over-land aerosol retrieval yields very little information about aerosol size, even com-pared with the limited coarse-mode/fine-mode fractionation derived by the over-ocean retrieval (Kahn et al., 2009). Sec-ond, surface conditions affecting AOD retrieval will co-vary geographically with aerosol properties. For instance, high aerosol loads over brighter surfaces (arid or barren ecosys-tems) will tend to be made up of coarser particles (dust). These differences require some simplifications to be made to the analysis, and the resulting QA/QC system.
2.1 MODIS aerosol retrievals
The MODIS data analyzed in this study was the Collection 5 MODIS Level 2 over-land aerosol product MOD04/MYD04 (Levy et al., 2007b) from 2005–2008. The over-land al-gorithm uses 0.47 µm, 0.66 µm, 1.24 µm, and 2.12 µm radi-ances. Unlike the ocean retrieval, aerosol properties in the land retrieval are specified regionally and seasonally (Levy et al., 2007a). Radiance inputs are mapped to AOD using a look-up table based on radiative transfer simulations (Levy et al., 2007a). AOD is retrieved at 0.47 µm, 0.55 µm, 0.66 µm, and 2.12 µm. A diagnostic fine mode fraction at 0.55 µm is also generated, although it lacks skill over land (Kahn et al., 2009).
ρ2.12µm)/(ρ1.240µm+ρ2.12µm), chosen for its relatively greater sensitivity to vegetation condition and lower sensi-tivity to atmospheric conditions (including aerosol particles). The second correction modifies the slope and intercept esti-mated from the first relationship by as much as ±50% ac-cording to scattering angle, based on the observations of Re-mer et al. (2001). Note that because the information used in the MODIS AOD retrieval all comes from the same viewing geometry, the phenomenon corrected by the scattering angle dependence is the relative anisotropy between the visible and near-infrared reflectances.
MODIS Collection 5 products have a ground footprint spa-tial resolution of 10×10 km at nadir, increasing to more than 20×40 km at the edge of the swath. Datasets are divided into 5-min granules covering approximately 2330 km across the satellite ground track and 2030 km along the ground track. Data used in this study are the 0.55 µm “Corrected Opti-cal Depth – Land” from the Level 2 product (hereafterτM). One year of data from one sensor is approximately 105 000 Level 2 granules.
The MODIS Level 2 aerosol product includes numerous pieces of auxiliary information about the retrieval condi-tions. In this study, the following were used: (1) the MODIS Mandatory quality assurance (QA) flag, which assigns each retrieval an estimated quality of “Bad”, ”Marginal”, ”Good” or “Very Good,” (2) the cloud fraction information, indicat-ing the fraction of pixels within the retrieval footprint with MODIS-detected cloud, (3) viewing angle and (4) the scat-tering angle for each retrieval.
For the purposes of data assimilation MODIS products from Terra and Aqua behave similarly, and in this paper joint statistics are sometimes presented. When potentially sig-nificant differences between Terra and Aqua are diagnosed, separate statics are presented and discussed. Appendix D presents discussion and analysis specifically targeting differ-ences between Terra and Aqua MODIS AOD.
Note that the MODIS retrieval algorithm permits negative values of retrieved AOD, and in certain locations this condi-tion can be quite common (e.g. forested area in South Amer-ica, see Sect. 4.3). Our statistical analysis of the MODIS Level 2 data uses these negative retrievals. The aggregated product produced after correction of the Level 2 data does not include negative AODs; if the AOD is negative after ag-gregation, it is truncated to 0.
2.2 AERONET sun photometer data
The basis for our evaluation of MODIS retrieved AOD is di-rect measurements of AOD from the Aerosol Robotic Net-work (AERONET) (Holben et al., 1998) of Sun photome-ter instruments. This study uses AERONET Level 2 quality controlled data collected throughout the entire network for 2005–2008. Quality control procedures are as described in Smirnov et al. (2000). Depending on the exact instrument used, there are a variety of wavelengths collected ranging
from 0.34–1.6 µm. AOD at the MODIS retrieval wavelength of 0.55 µm (hereafter τA) was derived from the quadratic interpolation method of O’Neill et al. (2003). Typically AERONET level 2 AOD data have uncertainties of<±0.015 (Eck et al., 1999; Schmid et al., 2003) spectral deconvolution algorithm and are used in this analysis.
MOD04 retrievals were matched to AERONET measure-ments of AOD with tolerances of ±30 min and ±30 km. Errors resulting from transport or localization conditions were found to be small at the broad statistical level (see Appendix A). Every possible match between instantaneous AERONET measurements and MODIS retrievals was in-cluded in the matched dataset. Because many AERONET stations have a high sampling rate (15 min or less), individual MODIS retrievals are often paired with multiple AERONET retrievals. For the final step of estimating instrument er-ror variance for data assimilation, as described in Sect. 7, AERONET data from each site were aggregated into six-hour bins.
The AERONET Level 2.0 algorithm also includes steps to remove cloud contamination, creating a potential sampling bias in our analysis of cloud effects in the MODIS retrieval. This is discussed further in Sect. 3.2.
2.3 MODIS albedo and snow products
The lower boundary condition is an important component of the aerosol retrieval, and the complexity and variability of the land surface pose significant challenges for accurate retrievals. This study is concerned with two potential is-sues: (1) Surface albedo characterization and in particular how it relates to the IR-visible regression, and (2) poten-tial for snow contamination. Surface properties were char-acterized for this study using the MODIS MCD43 albedo product (Schaaf et al., 2002). This product is produced as a Level 3 16-day composite product based on the MOD09 atmospherically corrected surface reflectance product (Ver-mote et al., 1997). The 16-day compositing algorithm is de-signed to systematically eliminate the influence of clouds and aerosols on the observations. The algorithm uses observa-tions from multiple viewing geometries to estimate the bi-directional reflectance function (BRDF), by fitting observa-tions to a RossThick-LiSparse model of surface albedo and BRDF (Lucht et al., 2000). The model parameters can be used to calculate black- and white-sky albedoes for the seven primary MODIS bands, as well as integrated visible, near-infrared, and shortwave albedoes. This study used the black-sky hemispheric albedoes at 0.47 µm, 0.66 µm, and 2.12 µm from the MODIS albedo product (product MCD43C3), cal-culated using the mean solar zenith angle for each location and time. The QA information included with the MODIS albedo product was used to exclude all albedo data with qual-ity other than “very good.”
goes into the MCD43 albedo product. The MCD43 product calculates albedo using only snow-free pixels, and includes a diagnostic variable indicating the fraction of 500 m pixels in each 0.05◦cell where snow was indicated. This informa-tion was used to diagnose residual snow-related bias in the MODIS AOD.
Because the footprint of MODIS aerosol retrievals has a highly variable size, shape, and orientation, no attempt was made to match MODIS AOD retrievals precisely to the Level 3 snow/albedo data. Instead, the center of each AOD retrieval was matched to the nearest 0.05◦grid cell from the MCD43C3 climate modeling grid (CMG) albedo product. For the snow analysis, a spatial and temporal window around the matched observation was used (see details in Sect. 3.3).
Since both the AOD and snow/albedo products are derived from the same MODIS observations, there is the possibility that the interaction between AOD and albedo is reciprocal. Appendix B to this paper includes an analysis to determine whether MODIS albedo data were contaminated by aerosol. Results in Appendix B show that persistent high AOD often resulted in failed albedo retrievals, but that AOD contami-nation in albedo retrievals with “very good” QA flags was negligible.
2.4 Statistical evaluation of MODIS AOD
To evaluate the utility of AOD information for use in a data assimilation grade product, standards of accuracy must be established. In terms of interaction with an aerosol transport model, both random and systematic errors will affect analysis and forecast outcomes. Producing a dataset for data assim-ilation applications involves three goals: (a) elimination of outliers, (b) elimination of systematic bias, (c) quantitative characterization of residual errors. Because of the physics of the retrieval problem, the relative strengths of the land surface, microphysics and cloud biases are AOD dependent. Nominally aerosol regimes can be broken down into: <0.2, low AOD near signal to noise thresholds; 0.2–0.6, sufficient aerosol signal in the single scattering regime; 0.6–1.4 multi-ple scattering regime; and>1.4 extreme AOD events. These categories are used as necessary in the statistical analysis.
A simple intuitive metric for analysis of the retrieved AOD values is the tolerance which bounds AOD errors. For this study, a target accuracy is defined by:
τM = τA ±
0.05+ τA
5
, (1)
and sets of retrievals are evaluated according to the fraction that fall within, above, and below this target accuracy. This is a weaker constraint than the proposed 0.05±0.15×AOD used in some studies (e.g., Levy et al., 2007b, 2010); how-ever, those studies apply spatial and temporal averaging to the MODIS and AERONET AOD data before calculation of errors. This metric provides a simple accounting for the fre-quency of positive and negative outliers, but provides little
information about the magnitude of errors. Where appro-priate, cumulative distribution functions (CDF) of errors are used for a more quantitative description.
Positive and negative errors in retrieved AOD are of-ten asymmetrical, which violates a key assumption of or-dinary least-squares regression. Linear fits of MODIS and AERONET AOD consistently have intercepts significantly different from zero. These non-zero intercepts are driven by errors in retrieved AOD in relatively clean conditions, due to problems with the surface boundary condition, cloud contamination, or other problems. Because the error bud-get of retrieved AOD varies as a function of AOD, the non-zero intercepts often artificially skew the regression slope away from the relationship indicated by the high-AOD data. Therefore, to derive a linear representation of the relation-ship between AOD values, the slope forced through zero is calculated using the following equation:
SLOPE
τ
M τA
=
P
τM ·τA
P
τA2 (2)
Slope calculations in this analysis are made using only mod-erate to high AOD (0.2< τA<1.4). Where data volume is sufficient, a separate slope calculation is made for extreme AOD (τA>1.4).
Finally, this analysis makes extensive use of the Root Mean Squared Error (RMSE), calculated as:
RMSE = s
1 n
X
n
(τA −τM)2 (3)
RMSE is sensitive to both systematic and random errors and provides an estimate of the expected error in AOD in the ab-sence of information about specific sources of errors. In non-background aerosol conditions, RMSE has a strong relation-ship with AOD (see Sect. 3.1). For this analysis, the back-ground observations (τAERONET<0.2) are used to calculate a “noise floor” for RMSE, and then a linear relationship of the form
RMSE = a τ +b (4)
is estimated for higher AOD. Prognostically, “estimated RMSE” (ε) is calculated for a MODIS observation of a given optical depth as the higher of the regressed value or the RMSE “noise floor”:
ε (τM) = max [RMSE(τA < 0.2), a τM +b] (5) When data volumes are sufficient, this approach is extended to use a separate linear relationship for very high AOD val-ues.
2.5 Aggregation and textural filtering
caused by assimilation of subgrid features the model can-not accurately resolve, and second, to reduce random error through averaging.
The method of Zhang and Reid (2006) is used to aggregate the MODIS AOD to a resolution of 1◦by 6 h. Three textu-ral checks are used to avoid assimilation of sub-grid features likely to create anomalous features in the 1◦model, and also to reduce residual cloud contamination. The first is a “buddy check” in the aggregation to exclude AOD retrievals with no adjacent retrievals. The second sets a minimum num-ber of retrievals per grid cell. Zhang and Reid (2006) im-posed a minimum of 5 retrievals per 1◦grid cell for the over-ocean data. Results from a compliance test to evaluate data loss vs. quality improvement indicated that requiring more than 3 retrievals per grid cell resulted in substantial data loss with minimal improvements to error statistics (3 AOD re-trievals = nominally 300 km2= 2.5% of the area of a 1◦ cell at the equator, in the worst case). The final textural filter uses a local variance check to eliminate all grid cells with mean τM>0.2 and coefficient of variation of AOD within the grid cell (standard deviation/mean) greater than 0.5. The effects of these textural filters are described and discussed in Sect. 7.3.
3 Results 1: global error terms for MODIS Collection 5 aerosol product
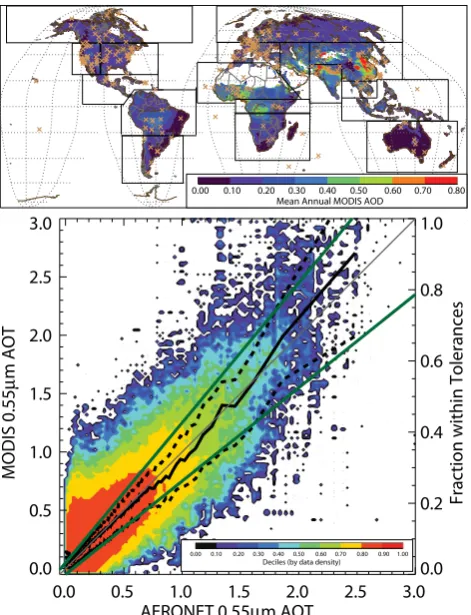
Figure 1a shows the global extent of coverage of the MODIS Collection 5 AOD retrieval over land, with the AERONET stations used in this study marked with “+” and overlaid on the annual average AOD for the years 2001–2009. Also over-laid are the boundaries defining regions for analyses that are presented in subsequent sections. This analysis uses over 3.8 million data points from more than 290 sites. Figure 1b gives the subsequent global scatter/density plot. Note that both axes of this plot actually begin at−0.05; as discussed in Sect. 2.1, negative AOD values can be returned by the MODIS retrieval, and are not truncated in our analysis of the Level 2 data. Each vertex of the black solid line rep-resents 50 000 AOD retrievals, binned in order ofτA. The black dotted curves represent the 25th and 75th percentileτM of eachτAbin. The green solid lines indicate the tolerances from Eq. (1). The slope ofτMvs.τAis near unity, although a small cloud of high biased AOD retrievals are visible for AOD<0.2 and a clear upward break is discernable for AOD greater than 1.4. Note that representativeness error should result in negative bias at high values ofτA, so the positive bias inτMat extremeτAis likely larger than it appears from this figure (also see Appendix A).
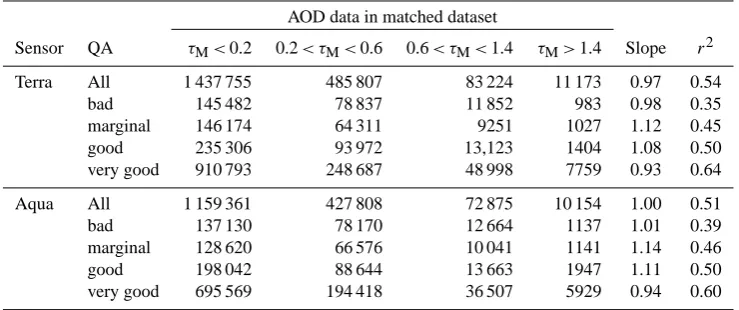
Global error statistics for MODIS retrieved AOD from this data segregated by MODIS QA flag values are given in Ta-ble 1a–c. TaTa-ble 1a gives the distribution of retrieved τM for each subset, regression slopes calculated using Eq. (2), and regression coefficientsr2. Table 1b lists the compliant
0.0 0.5 1.0 1.5 2.0 2.5 3.0
AERONET 0.55µm AOT 0.0
0.5 1.0 1.5 2.0 2.5 3.0
MODIS 0.55
µ
m AOT
0.0 0.2 0.4 0.6 0.8 1.0
Fraction within Tolerances
0.00 0.10 0.20 0.30 0.40 0.50 0.60 0.70 0.80 Mean Annual MODIS AOD
Deciles (by data density)
0.00 0.10 0.20 0.30 0.40 0.50 0.60 0.70 0.80 0.90 1.00
Fig. 1. (a) Geographic extent of MODIS AOD retrieval cover-age over land (shaded). Colored contours indicate the mean an-nual AOD retrieved from MODIS at each location, averaged us-ing data from 2001–2008. AERONET stations used in this study are marked with “x”. Solid black lines divide the land surface into regions, which are discussed in Sect. 5. (b) MODIS 0.55 µm AOD versus AERONET 0.55 µm AOD (AERONET AOD is inter-polated, see Sect. 2.2). Symbols are as follows: CONTOURS: each shaded region represents 10% of the matched MODIS-AERONET data points, organized by data density in bins of 0.05 optical depth. The contoured area includes 90% of the matched retrieval, the re-maining 10% are shown as POINTS. SOLID LINE: Each vertex
represents 50 000 paired retrievals, sorted byτA. DOTTED LINES:
indicate the 25th and 75th percentiles of each bin along the solid line. DASHED LINES: indicate the compliance metric of Eq. (1). The 1:1 line is also shown.
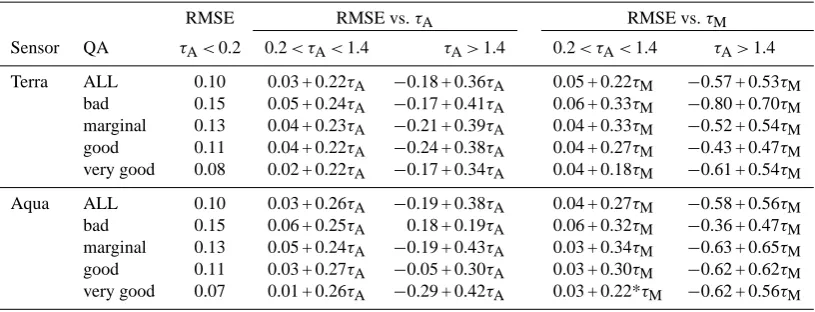
fractions relative to the criterion of Eq. (1). Table 1c gives the “noise floor” RMSE estimated using only retrievals with τA<0.2, and the diagnostic and prognostic regressions of RMS error vs. AOD. As expected, higher QA flags have bet-ter performance with compliance andr2 values steadily in-creasing with data quality.
Bad Marginal Good Very Good VG-Model
“Noise Floor” = RMSE (AAOD < 0.2) “Linear (Mid-Range)” RMSE (0.2 < MAOD < 1.4) “Linear (High-Range)” = RMSE (MAOD >1.4)
0
1
2
3
AERONET AOD
0.0
0.2
0.4
0.6
0.8
1.0
RMSE
0
1
2
3
MODIS AOD
0.0
0.2
0.4
0.6
0.8
1.0
RMSE
-2
-1
0
1
2
Fractional Error
0.0
0.2
0.4
0.6
0.8
1.0
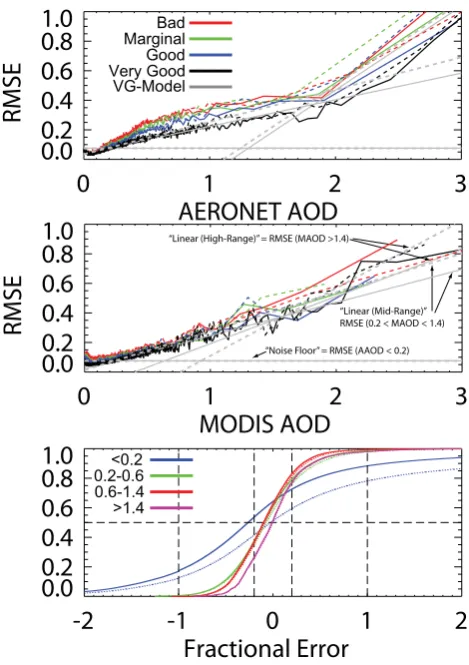
<0.2 0.2-0.6 0.6-1.4 >1.4Fig. 2. RMS error ofτMas a function of (a)τAand (b)τM. Curves
for different MODIS mandatory QA levels are indicated with differ-ent colors. Solid curves are data from MODIS-Terra; dotted curves are from MODIS-Aqua. Gray curves on the lower graph are mod-eled RMSE using the regressions for “Very Good” data from Ta-ble 1. Curves for display use 50 000 matched AOD retrievals for each vertex; for calculation of table statistics, a bin size of 10 was used. (c) Cumulative distribution function (CDF) of MODIS
frac-tional AOD error, defined as (τM−τA)/τA, stratified into ranges of
τA. Solid curves were calculated using only MODIS-Terra matched
retrievals with MODIS QA of “Very Good.” Dotted curves are MODIS-Aqua data.
is seen to be highly linear with AOD, except for a minimum at around 0.05 below which RMSE actually increases with decreasing AOD. This linear relationship of Fig. 2b is the ba-sis of a prognostic estimate of error for use in data assimila-tion. For the region of low AOD where RMSE is non-linear, a “noise floor” uncertainty is assigned using the RMSE for all cases whereτA<0.2. For a given value ofτM, the RMSE is estimated as the largest of the estimates from linear regres-sion and the “noise floor” RMSE. The gray lines in Fig. 2b illustrate the RMSE estimated by this approach forτM with “very good” QA.
The baseline RMSE reaches a high of 0.15 for the lowest QA value (“Bad”), and improves to as low as 0.08 and 0.07
for ‘Very Good’ Terra and Aqua respectively. RMS error in-creases withτAwith slopes ranging from 0.22 to 0.27, and generally decreasing with stricter QA. Retrievals with very high optical depths (AOD>1.4) appear to have different er-ror characteristics, with larger erer-rors in most cases.
Figure 2c shows cumulative distribution functions (CDFs) of fractional error, defined as (τM−τA)/τA, for QA = “very good” only. At each range, the median error indicates a small negative bias in the global data. Note that for “Very Good” data, negative errors are more common at low AODs than positive errors, in contrast with other QA flags (Table 1b). When all retrievals are included, median biases are closer to zero over all ranges (data not shown). This indicates that the “Very Good” QA flag removes more positive errors than neg-ative errors. The surplus of negneg-ative errors at low AOD will be shown to be partly related to problems with the surface boundary condition in the retrieval.
Each of the statistical categories in Table 1 indicates that τM retrieved from MODIS-Aqua are slightly higher than from MODIS-Terra. This can also be seen in the relation-ships shown in Fig. 2. This difference is generally very small, but extremely persistent. Note that higher AOD from MODIS-Aqua does not always mean poorer error statistics; at low optical depth, the “Very Good” retrievals from both sensors have a negative bias, and MODIS-Aqua has better compliance in these cases.
The compliance statistics in Table 1c indicate that the al-gorithm performs slightly better in the 0.2–0.6 AOD range compared with higher AOD ranges. In the range of 0.2–0.6 aerosol signal is good, and radiative transfer is in a near- lin-ear single scattering regime. At higher optical depths, mul-tiple scattering becomes increasingly important and leads to amplifications of aerosol microphysical biases. Scale effects also become important at high AOD, because the spatial ex-tent of high-AOD features is frequently smaller or of the same order of magnitude as the comparison here (30 km ra-dius around each AERONET site).
Table 1a. Distribution of AOD values and linear regression results for matched MODIS-AERONET dataset, stratified by MODIS QA value.
AOD data in matched dataset
Sensor QA τM<0.2 0.2< τM<0.6 0.6< τM<1.4 τM>1.4 Slope r2
Terra All 1 437 755 485 807 83 224 11 173 0.97 0.54
bad 145 482 78 837 11 852 983 0.98 0.35
marginal 146 174 64 311 9251 1027 1.12 0.45
good 235 306 93 972 13,123 1404 1.08 0.50
very good 910 793 248 687 48 998 7759 0.93 0.64
Aqua All 1 159 361 427 808 72 875 10 154 1.00 0.51
bad 137 130 78 170 12 664 1137 1.01 0.39
marginal 128 620 66 576 10 041 1141 1.14 0.46
good 198 042 88 644 13 663 1947 1.11 0.50
very good 695 569 194 418 36 507 5929 0.94 0.60
Table 1b. Compliance of AOD values to the error limits of Eq. (1) (|τM−τA|<=(0.05 + 0.20τA) for matched MODIS-AERONET dataset,
stratified by MODIS QA value.
Compliance (Below/Within/Above)
Sensor QA τM<0.2 0.2< τM<0.6 0.6< τM<1.4 τM>1.4 All
Terra ALL 20/66/12 08/52/39 08/53/37 03/50/46 17/62/20
bad 16/57/25 09/34/56 07/37/55 02/44/52 13/49/37
marginal 11/65/23 03/39/56 03/36/59 02/42/55 08/56/34
good 13/67/18 04/45/50 05/43/51 01/45/53 10/60/28
very good 24/68/07 10/63/25 11/62/26 03/53/42 21/66/12
Aqua ALL 17/68/13 06/49/43 08/44/47 01/44/53 14/62/22
bad 16/59/23 08/33/57 06/36/56 02/39/57 13/49/37
marginal 10/66/23 03/38/57 04/34/61 00/33/65 07/55/36
good 13/67/18 03/44/51 04/38/57 01/37/61 10/59/30
very good 20/71/07 08/61/29 11/52/35 01/50/47 17/68/13
3.1 Factors affecting global signal-to-noise ratio of retrieved AOD
For an atmospheric modeling application, systematic errors are often more damaging than random errors. In the case of a global model, the model resolution is typically coarser than the AOD observations, permitting extensive averaging to reduce random noise. High levels of random noise can also obscure systematic bias.
The dominant signal of aerosols for optical retrieval is the scattering of direct sunlight back to the sensor. The MODIS aerosol retrieval is based on inversion of a full radiative trans-fer simulation that includes aerosol effects on all pathways except multiple scattering (Levy et al., 2007a), but the pri-mary determinant of the signal strength for retrieval of AOD is the ratio of scattered direct sunlight to light reflected from the surface. This is a reason why retrieval of AOD over ocean is more precise than over land, and also a reason why this MODIS algorithm is unable to retrieve aerosol properties over bright surfaces.
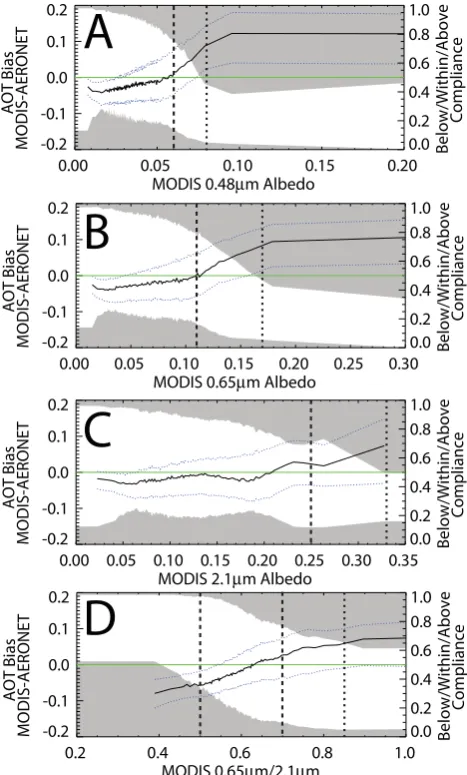
Figure 3 shows how the compliance of the MODIS re-trieved AOD varies as a function of surface albedo at 0.47, 0.66, and 2.12 µm. The gray bars at the top and bottom of the graph indicate the fraction of retrievals above and below the target accuracy. Thus, the area between the shaded regions is indicative of the compliant fraction of the data. The solid lines (each vertex is an average of 20 000 retrievals) indicate the mean AOD bias, and the dotted lines indicate the 25th and 75th percentiles of each bin. The graphs in Fig. 3 illustrate two effects. First, the increase in MODIS-AERONET bias with increasing albedo at 0.47 µm and 0.66 µm clearly points to mis-parameterization of the lower boundary condition in the retrieval. This is examined in detail in Sect. 4. Second, the increased spread of the errors at higher albedo illustrates the decrease in differential signal to noise ratio.
Table 1c. Prognostic and diagnostic regression of RMS error in MODIS AOD as a function of AOD, stratified by MODIS QA value. A
single RMS error estimate for low-AOD conditions (τA<0.2) is also shown.
RMSE RMSE vs.τA RMSE vs.τM
Sensor QA τA<0.2 0.2< τA<1.4 τA>1.4 0.2< τA<1.4 τA>1.4
Terra ALL 0.10 0.03 + 0.22τA −0.18 + 0.36τA 0.05 + 0.22τM −0.57 + 0.53τM
bad 0.15 0.05 + 0.24τA −0.17 + 0.41τA 0.06 + 0.33τM −0.80 + 0.70τM
marginal 0.13 0.04 + 0.23τA −0.21 + 0.39τA 0.04 + 0.33τM −0.52 + 0.54τM
good 0.11 0.04 + 0.22τA −0.24 + 0.38τA 0.04 + 0.27τM −0.43 + 0.47τM
very good 0.08 0.02 + 0.22τA −0.17 + 0.34τA 0.04 + 0.18τM −0.61 + 0.54τM
Aqua ALL 0.10 0.03 + 0.26τA −0.19 + 0.38τA 0.04 + 0.27τM −0.58 + 0.56τM
bad 0.15 0.06 + 0.25τA 0.18 + 0.19τA 0.06 + 0.32τM −0.36 + 0.47τM
marginal 0.13 0.05 + 0.24τA −0.19 + 0.43τA 0.03 + 0.34τM −0.63 + 0.65τM
good 0.11 0.03 + 0.27τA −0.05 + 0.30τA 0.03 + 0.30τM −0.62 + 0.62τM
very good 0.07 0.01 + 0.26τA −0.29 + 0.42τA 0.03 + 0.22*τM −0.62 + 0.56τM
from the surface to the sensor. Near nadir (scan angle<5◦), 56% of MODIS AOD retrievals are compliant, compared with 83% at the scan edge (scan angle>60◦). This means that comparisons of MODIS aerosol retrievals with narrow-swath instruments such as the Multi-Angle Scanning Ra-diometer (MISR) or the Cloud-Aerosol Lidar with Orthog-onal Polarization (CALIOP) will overestimate random error against the whole MODIS product. This discrepancy be-tween nadir and scan edge is caused by the relative contri-bution of surface reflected light to the total radiance at the sensor. Thus, it diminishes at increasing optical depth: for τA>0.6, compliance fractions are 60% and 61% at nadir and scan edge, respectively. At even higherτA, spatial mis-match between MODIS and AERONET is a larger factor; for τA>1.0, compliance is better at nadir.
A related phenomenon is shown in Fig. 4b, which depicts the bias and compliance statistics as a function of the scat-tering angle. In the global dataset the retrieval has almost no systematic bias associated with scattering angle, indicat-ing that the model used to account for anisotropy in the sur-face reflectance (Levy et al., 2007b) appears to be sufficient. But unavoidably, as scattering angle increases, shadows over vegetated surfaces diminish, the surface brightness increases, and the precision of the retrieval declines. The interaction be-tween solar geometry and scattering angle means that scatter-ing angle distributions are not stationary with latitude, which may also influence this result. At scattering angles smaller than 100◦, 84% of retrievals are compliant. At very high scattering angles, where the sun is almost directly behind the sensor, there is a sharp spike in retrieved AOD: compliance is only 41% for scattering angles above 170◦. This is caused by the “hot spot” of vegetation reflectance (Vermote and Roy, 2002), and retrievals with scattering angles over 170◦(0.5% of our matched retrieval data set) should be avoided because of this problem.
3.2 Influence of MODIS-detected clouds on retrieved AOD
Undetected clouds, subpixel or otherwise, can cause a pos-itive bias in the retrieval. Conversely, cloud shadows can result in a negative bias. Overall, however, we expect a pre-dominantly positive bias from cloud effects. The MODIS retrieval includes auxiliary information on the fraction of pixels within the retrieval footprint with MODIS-detected cloud. Only 16% of successful AOD retrievals have MODIS-detected cloud cover within the retrieval footprint. This fraction decreases with increasingly strict QA, from 26% of “Bad” retrievals to 10% of “Very Good” retrievals.
Retrievals with MODIS-detected cloud have a slight posi-tive bias relaposi-tive to the complete dataset (Fig. 4c). The differ-ence in meanτMfor retrievals with indicated clouds versus no detected clouds is +0.04, while the corresponding differ-ence inτAis less than 0.01. While this elevated AOD may in-dicate undiagnosed subpixel clouds affecting the reflectances used in the retrieval (Zhang and Reid, 2006), or may be an artifact of three-dimensional scattering not included in the re-trieval model (Varnai and Marshak, 2009), other studies (Ko-ren et al., 2007) contend that this may be the result of elevated aerosol particle concentrations in the vicinity of clouds. But, given the scale of such aerosol features, we might expect a larger response inτA. For over water cases,τAdid not show an increase in AOD with increasing cloud cover nearly as large asτM (Zhang et al., 2005), suggesting artifact may be the more dominant factor.
0.00 0.05 0.10 0.15 0.20 0.25 0.30 0.35 MODIS 2.1µm Albedo
-0.2 -0.1 0.0 0.1 0.2 AOT Bias MODIS-AERONET 0.0 0.2 0.4 0.6 0.8 1.0 Below/Within/Above Compliance
0.00 0.05 0.10 0.15 0.20 0.25 0.30 MODIS 0.65µm Albedo
-0.2 -0.1 0.0 0.1 0.2 AOT Bias MODIS-AERONET 0.0 0.2 0.4 0.6 0.8 1.0 Below/Within/Above Compliance
0.00 0.05 0.10 0.15 0.20
MODIS 0.48µm Albedo -0.2 -0.1 0.0 0.1 0.2 AOT Bias MODIS-AERONET 0.0 0.2 0.4 0.6 0.8 1.0 Below/Within/Above Compliance
A
B
C
D
0.2 0.4 0.6 0.8 1.0
MODIS 0.65µm/2.1µm -0.2 -0.1 0.0 0.1 0.2 AOT Bias MODIS-AERONET 0.0 0.2 0.4 0.6 0.8 1.0 Below/Within/Above Compliance
Fig. 3. Error inτMas a function of surface albedo at (a)0.47 µm,
(b) 0.66 µm, (c) 2.12 µm. (d) Error inτMas a function of the ratio of
MODIS albedo at 0.65 µm and 2.1 µm. The lines were constructed by sorting the albedo of matched retrievals into bins of 20 000, each of which is shown as a vertex of the solid (mean bias) and dot-ted (25th and 75th percentiles of bias) lines. The gray bars at the top and bottom of the graph represent the fraction above and be-low, respectively, the compliance tolerances of Eq. (1). All statistics were calculated using only matched data with MODIS QA of “Very Good”.
retrieved AOD may be more severe than indicated by the matched MODIS-AERONET comparison.
With the exception of the small positive bias, the error statistics for retrievals with MODIS-detected cloud are no worse than for the entire data set (data not shown). Data assimilation studies have shown that in some regions, such as SE Asia, cloud bias can be so severe that it actually de-creases model efficacy when assimilated (Reid et al., 2009). Because of the contextual bias associated with using cloud-cleared AERONET data for comparison, the extent of cloud
0.0 0.2 0.4 0.6 0.8 1.0
Fraction Cloud in Retrieval Footprint -0.2 -0.1 0.0 0.1 0.2 AOT Bias MODIS-AERONET 0.0 0.2 0.4 0.6 0.8 1.0 Below/Within/Above Compliance
-50 0 50
MODIS View Angle (Degrees from Nadir) -0.2 -0.1 0.0 0.1 0.2 AOT Bias MODIS-AERONET 0.0 0.2 0.4 0.6 0.8 1.0 Below/Within/Above Compliance
100 120 140 160 180
Scattering Angle -0.2 -0.1 0.0 0.1 0.2 AOT Bias MODIS-AERONET 0.0 0.2 0.4 0.6 0.8 1.0 Below/Within/Above Compliance
A
B
C
Fig. 4. Error inτM as a function of (a) MODIS view angle and
(b) scattering angle. Solid line indicates mean bias; each vertex is the average of 20,000 retrievals. Dotted lines indicate 25th and 75th percentiles of each bin. Gray bars at the top and bottom of the graph represent the fraction above and below, respectively, the com-pliance tolerances. All statistics were calculated using only matched
data with MODIS QA of “Very Good”. (c) Error inτMas a
func-tion of MODIS retrieved cloud fracfunc-tion. The straight dashed lines indicate the mean AOD bias, as well as the non-compliant frac-tion (low and high) for all retrievals with no indicated cloud (Cloud Fraction = 0).
contamination issues can only be revealed by data assimi-lation studies. Further research is needed to determine the extent and localization of cloud contamination, and how best to avoid cloud contamination without unduly reducing data coverage.
3.3 Diagnosis of snow contamination in MODIS AOD
observed radiance in near-infrared and thermal wavelengths. This technique was shown to be a great improvement over the snow masking used in the Collection 4 MODIS AOD re-trieval (Li et al., 2005).
Snow contamination is extremely difficult to completely eliminate because snow can cover any fraction of the retrieval footprint. For this study, the snow contamination checks in the MODIS Collection 5 algorithm (Li et al., 2005) were ex-tended using the snow flag in the MODIS 0.05◦albedo prod-uct, which indicates the fraction of 500-m pixels affected by snow during the 16-day compositing period of this product. Using this product makes it possible to extend the test for snow contamination both in time, by considering data from a period before the AOD retrieval, and in space, by looking for snow over a wider area. These spatially and temporally extended checks do not give proof of snow contamination of a given retrieval. However, as will be shown, they permit identification and removal of retrievals where the probability of snow contamination is greater.
For AERONET retrievals in Boreal North America (above 49◦N) withτA<0.2, compliance is 70%, and the mean bias in the matched dataset is +0.013, or 14%. Of the non-compliant retrievals, 70% are biased high. Note that the matched dataset includes no retrievals from this region dur-ing December through February, and only 4% of retrievals are from November through April. This relates to limita-tions in both datasets: AERONET sites in northern regions are customarily shut down during winter months to prevent damage by snow, and MODIS retrieves AOD only when the sun is less than 72◦from nadir.
Only 0.2% of matched retrievals from this region are flagged as having snow in the corresponding MODIS 16-day albedo product, but these flagged points are 59% compli-ant and have a mean bias of +0.052, and the non-complicompli-ant retrievals are 95% biased high. Thus, the snow flag in the MODIS albedo product is consistent with snow contamina-tion in the MODIS AOD, but the number of points flagged is very small, and their effect on the bulk error statistics is minimal. This indicates that this test for snow is effective but likely incomplete.
If we extend the snow test in time by checking the snow flag in the MODIS albedo product for the 32 days prior to the AOD observation, and in space by looking for snow in a 0.35×0.35◦ box around the AOD retrieval, we capture nearly 12% of the retrievals in the matched dataset, includ-ing nearly all the retrievals in March and April. The retrievals captured in this wider net have 59% compliance, a positive bias of +0.031, and 85% of non-compliant retrievals are bi-ased high. Thus, even this larger set of retrievals is con-sistent with snow contamination. When these retrievals are removed, the compliance of the remaining retrievals in Bo-real NA is 73%, 3% higher than before filtering. The mean bias is reduced to +0.009 (9%). Non-compliant retrievals are still 66% biased high. These results indicate that some snow contamination has been removed, but positive biases persist
Table 2. Statistical analysis of filters to remove snow contami-nation in MODIS AOD. Data shown were calculated using only MODIS AOD with MODIS QA of “Very Good”.
All Data
Region Bias Compliance RMSE
N. American Boreal 0.013 08/70/20 0.10 E. CONUS −0.025 22/71/05 0.07 W. CONUS 0.017 13/64/22 0.11 Europe–Mediterranean −0.010 14/75/09 0.08 Eurasian Boreal −0.016 15/77/06 0.09 East Asia Mid-Latitudes 0.028 13/64/21 0.18
Snow-Matched
Bias Compliance RMSE %data N. American Boreal 0.052 02/58/38 0.16 0.09 E. CONUS 0.012 01/83/14 0.25 0.05 W. CONUS 0.061 01/53/44 0.17 0.08 Europe–Mediterranean −0.011 03/96/00 0.01 0.05 Eurasian Boreal 0.006 01/84/13 0.03 0.07 East Asia Mid-Latitudes 0.092 00/57/42 0.24 0.13
Snow-Extended Match
Bias Compliance RMSE %data N. American Boreal 0.031 06/59/34 0.09 17.87 E. CONUS 0.026 07/70/21 0.08 7.58 W. CONUS 0.023 08/67/24 0.09 8.32 Europe–Mediterranean −0.009 13/75/10 0.07 4.05 Eurasian Boreal −0.010 14/79/05 0.07 10.35 East Asia Mid-Latitudes 0.085 01/57/40 0.14 5.20
in the data, whether related to snow contamination or other causes.
Table 2 shows statistics for retrievals excluded using the matched and extended filters based on the MODIS albedo product, for all regions that extend to mid-latitudes or above.
3.4 Basic QA filtering for subsequent testing
Based on the results in this section, the remainder of our anal-ysis at the retrieval level (Sects. 4–6) will exclude the follow-ing MODIS AOD data:
1. Data with MODIS mandatory QA other than “Very Good”;
2. Data with MODIS-indicated cloud; 3. Data with scattering angle above 170◦;
Table 3. Statistical evaluation of MODIS AOD by region, after application of basic QA filtering.
Compliance RMSE vs.τA vs.τM
Region NAOD Nsites Slope r2 τM<0.2 0.2< τM<0.6 0.6< τM<1.4 τM>1.4 All τA<0.2 0.2< τA<1.4 0.2< τA<1.4
Global 1 797 997 257 0.92 0.62 24/69/06 10/64/24 12/58/29 02/52/44 21/67/10 0.07 0.02 + 0.25τA 0.04 + 0.20τM
N. American Boreal 168 961 14 1.17 0.62 11/78/09 00/50/49 02/43/54 00/22/77 10/74/14 0.06 −0.06 + 0.51τA 0.01 + 0.31τM
E. CONUS 258 728 33 1.01 0.74 28/69/02 03/80/15 02/74/22 00/14/85 24/71/04 0.06 0.04 + 0.09τA 0.03 + 0.12τM
W. CONUS 176 530 29 1.31 0.25 16/71/11 01/30/67 01/23/74 00/00/100 13/64/21 0.10 0.02 + 0.31τA −0.01 + 0.53τM
Central America 14 146 10 0.96 0.54 58/40/01 15/66/18 06/56/37 00/19/80 44/46/08 0.09 0.07 + 0.20τA 0.05 + 0.16τM
South America 59 765 11 1.00 0.81 71/27/00 12/80/07 01/78/19 00/42/56 57/37/05 0.11 0.05 + 0.17τA 0.04 + 0.11τM
S. South America 90 946 7 1.07 0.68 30/51/18 05/28/65 00/73/25 00/61/38 27/49/22 0.09 0.09 + 0.10τA 0.15 + 0.02τM
Africa below equator 79 314 3 0.88 0.55 22/72/04 10/69/20 27/66/06 00/00/00 19/72/07 0.06 0.00 + 0.27τA 0.01 + 0.23τM
Equatorial Africa 7411 3 0.99 0.45 36/62/00 03/84/12 00/35/64 00/00/00 32/65/02 0.08 0.07 + 0.04τA 0.02 + 0.15τM
Africa above equator 102 001 19 0.69 0.68 47/47/05 48/44/07 47/49/02 10/79/09 47/46/06 0.09 0.03 + 0.31τA 0.13 + 0.18τM
Europe–Mediterranean 389 898 44 1.04 0.46 19/77/03 03/73/22 00/51/47 19/50/30 14/76/08 0.06 0.03 + 0.17τA −0.00 + 0.25τM
Eurasian Boreal 170 230 26 1.05 0.65 20/77/01 03/79/16 01/45/53 00/26/73 16/77/06 0.06 0.00 + 0.24τA 0.00 + 0.21τM
East Asia Mid-Latitudes 89 265 31 1.02 0.65 25/68/06 09/67/22 04/55/39 02/59/38 15/65/19 0.09 0.05 + 0.18τA 0.02 + 0.21τM
Peninsular SE Asia 35 094 7 0.90 0.62 65/33/00 23/68/08 09/66/24 00/63/36 38/53/07 0.11 0.07 + 0.13τA 0.06 + 0.13τM
Indian Subcontinent 18 209 7 1.04 0.71 07/91/00 04/79/15 02/74/23 02/42/55 03/77/18 0.10 0.05 + 0.11τA 0.01 + 0.16τM
Australian Continent 128 848 8 0.99 0.19 24/69/05 06/55/38 00/50/50 00/00/00 23/68/07 0.06 −0.04 + 0.52τA 0.02 + 0.25τM
4 Description of regional biases
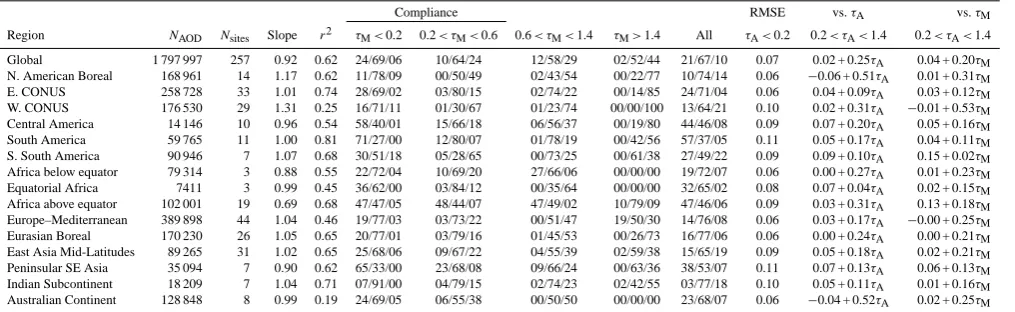
Global statistics average out considerable regional variabil-ity in the retrieval qualvariabil-ity, and are not geographically repre-sentative because they are weighted to locations with high AERONET coverage. Even at the regional level, the covari-ance of particle properties with AOD results in mixed in-dividual site efficacy as a function of AOD. Table 3 shows statistics, calculated using QA filtering as described in the previous section, for 14 different land regions. Statistics for each AERONET site for the 2005–2008 study period are pro-vided in the Supplement associated with this paper, or can be sent by request.
Higher compliance regions include northern Eurasia, Southern Europe-Mediterranean, and the Eastern Contiguous United States (E CONUS). Low compliance regions include South America, Africa above the equator, Central America, and Peninsular Southeast Asia. Just as important, the bal-ance of positive and negative non-complibal-ance shows large re-gional variability. In Northern Africa, 89% of non-compliant retrievals are biased low, while in the Indian subcontinent, 86% of non-compliant retrievals are biased high. Regional slope is also variable, ranging from a low of 0.69 for Africa above the equator to 1.17 for North American Boreal (the slope for the Western continental US is 1.31, but the regres-sion is weak, withr2= 0.25 for that region).
Just as the global mean statistics are composed of regions with different behavior, so the slopes calculated for each re-gion are the aggregate of the sites within that rere-gion, whose behavior is not always homogeneous. Our analysis is neces-sarily coarse-grained; in addition to variations between sites, aerosol properties in our selected regions will also have sea-sonal and interannual variation that we do not explicitly ad-dress (seasonal breakdowns for each site are included in the Supplement). This section provides a few key pieces of con-text from our analysis and from the literature that can aid in interpreting the statistics for each region. Regional biases will be analyzed and quantified in the next section.
4.1 North America
North America is split between a Northern Boreal Region, Eastern CONUS and Western CONUS. Owing to its back-ground nature, the northern boreal AOD is typically low, lowest of all of the regions compared (meanτA= 0.11). In-dividual site performance varies widely. For very clean background sites – e.g., Yellowknife (62◦N, 114◦W), Opal (80◦N, 86◦W) – AOD rarely exceeds 0.15, yielding no infor-mation from regressions. Sporadic high AOD events occur in the spring and summer months at some sites – e.g., Bonanza Creek (65◦N, 148◦W), Bratts Lake (50◦N, 105◦W), Pickle Lake (51◦N, 90◦W) – due to boreal biomass burning activity (Eck et al., 2009), which can driver2values to nearly 0.9. In very rare occasions, AOD can be extremely high (>8), over-whelming the AERONET sensor (O’Neill et al., 2002) and driving aerosol layer reflectivity to the AOD “Semi-infinite” regime . In addition to these real events, the boreal is also susceptible to potential snow bias which some sites – e.g., Kelowna (50◦N, 119◦W) – clearly show as strong early sea-son high biases. Regressions are dominated by burning ac-tivity, and a fairly consistent high slope bias is present among most sites. These slopes are event driven, and are dependent on the microphysical properties of smoke particles constantly evolving in size and absorption (Reid et al., 2005a,b). As a consequence, some sites show slope biases higher than 1.5 (e.g., Bratts Lake), and others close to 1.0 (e.g., Bonanza Creek). Terra and Aqua appear to perform similarly, with slope deviations between them at±0.1. For the sites affected by extreme AOD events, slope biases ranged from 1.4 to 1.9, with Aqua slopes higher than Terra by 0.2 or more in all cases.
one of the highest RMSEs. Previous studies have reported a significant bias (+0.2 or greater) over the arid regions due to shortcomings in the lower boundary condition (Drury et al., 2008). This is manifested in our statistics as extremely poor compliance and strong positive bias for above-background values ofτM, which are often retrieved in conditions where the true AOD is a low background value. Regression fits are generally weak because the AOD in the pristine desert has little range. Heavily urbanized sites such as around Southern California or the San Francisco Bay Area perform nearly as poorly. Like the boreal zone, large biomass burn-ing events can dominate individual regressions, with slopes ranging from 0.6 to more than 1.6. Remote sites with less arid landscapes – e.g., HJ Andrews (44◦N, 122◦W), Mis-soula (47◦N, 114◦W), and Fresno (37◦N, 120◦W) – have more reasonable performance, with slopes generally within
±0.1 of unity and>70% compliance.
4.2 Central America
Central America has only four sites with a significant num-ber of data points of AOD>0.2 (e.g., >500 data points): Tuxtla Gutierrez (17◦N, 93◦W), Tenosique (17◦N, 91◦W), and Mexico City (19◦N, 99◦W) in Mexico and La Par-guera (18◦N, 67◦W) in Puerto Rico. With its urban na-ture, Mexico City shows very poor scores (r2<0.30). The other two sites in Mexico show higherr2values (0.55–0.85), but variable slopes: slopes for moderate to high AOD range from 0.8 to 1.1, and slopes for extreme AOD range from 1.06 (associated correlation is very low) to 1.67 (MODIS-Aqua at Tenosique, r2= 0.66). As with other regions, estimated slopes for MODIS-Aqua are generally somewhat higher for moderate to high AOD values, and consistently much higher for extreme AOD values.
La Parguera is an excellent site for monitoring the trans-port of African dust over the Caribbean. In the matched data set, only MODIS-Aqua has sufficient range of AOD to es-tablish a robust correlation (slope = 0.94,r2= 0.63). Compli-ance for MODIS-Aqua is also much better (72% for all AOD vs 57% for MODIS-Terra).
4.3 South America
South America has four key aerosol regimes: The August– October burning in Rhondonia and Mato Grosso Brazil; February–May northern biomass burning in Columbia and Venezuela; an Argentinean dust regime; and urban super plumes from such major cities as San Paulo and Buenos Aires.
At low AOD, compliance is highly variable within the region: for AOD<0.2, compliance varies from 14% at Cuiaba-Miranda (15◦S, 56◦W) to 52% at Petrolina-SONDA (9◦S, 41◦W) and Santa Cruz – UTEPSA (18◦S, 63◦W). At low AODs, negative retrieved AOD is common. Over-all RMSE is good in South America for moderate AOD. The
massive Brazilian biomass burning signal is the primary de-terminant of validation statistics for this region. Each of the 10 sites in the biomass burning region have among the high-estr2values over the globe, yet each of the sites has a sig-nificant slope bias, and these biases vary from site to site; this leads to the overall poorr2 and RMSE values for the continent. Also, differences between Terra and Aqua de-rived AOD are highly localized, with Aqua being generally higher. The heavily impacted Ji-Parana site (11◦S, 62◦W) in central Brazil (average AOD>1.0 for all data where AOD>0.2), shows the strongest biases, with a moderate-AOD and extreme-moderate-AOD slopes of 1.13 and 1.54 for Terra, and 1.28 and 1.93 for Aqua. For other smoke receptor sites, the slopes for Terra vs. Aqua show differences on the order of 0.1, with Aqua consistently higher. The positive bias inτM is considerably stronger at high AOD; the high-AOD slope is always higher than the moderate-AOD slope (e.g., Fig. 7p where slopes are presented for data where τM>1.4). The regional mix of forest, cerrado, and pasture burning cou-pled with the rapid evolution of the smoke plume makes smoke aerosol properties highly variable (Ferek et al., 1998). Since the MODIS retrieval cannot resolve these variations in aerosol properties, the MODIS microphysical bias is highly variable.
No AERONET sites are available in Northern South America. Southern South America is prone to occasional dust emissions in an otherwise pristine environment (Gasso and Stein, 2007). Background AODs are typically low (<0.1). In such conditions over a semi-arid region, we are near the noise threshold for MODIS, which shows poor skill in general, often overestimating AODs by a factor of three. Compliance at most sites in this region is low and is driven by biases at low optical depth, whether high biases (48% of retrievals at Trelew (43◦S, 65◦W)withτM<0.2 are bi-ased high) or low biases (55% of retrievals at CEILAP-UTN (35◦S, 58◦W) withτM<0.2 are biased low).
Lastly, we examined the urban regions of San Paulo (Brazil) (24◦S, 47◦W) and La Paz (Bolivia) (17◦S, 68◦W). The La Paz site is extremely clean: in the matched MODIS-AERONET dataset, less than 3% ofτAwere above 0.2. The MODIS AOD has no skill in regression against AERONET at this site, and compliance forτM>0.2 is poor (<20%), but overall compliance is good because of the dominance of very low AOD. Sao Paulo performs moderately well in both re-gression and compliance, but results for low AOD are worse than most other stations (34% compliant forτM<0.2).
4.4 Europe, the Mediterranean, and northern Eurasia
for Aqua). Regression slopes for moderate AOD are typi-cally within +/0.1 of unity. Only a few sites (e.g., Forth Crete – 35◦N, 25◦W), have slope biases larger than 1.2. Site spe-cific Terra and Aqua slopes also correlate very well, within
±0.1 of each other for 34/44 sites. Scores are also excellent in the Eurasian Boreal, with greater than 75% compliance for 17/26 sites.
4.5 Africa
African aerosol regimes observed by MODIS can be broken down into the northern dust/smoke impacted Sahelian region, biomass burning impacted equatorial Africa, and the burn-ing and pollution region of southern Africa (No retrievals are made in the pure dust regimes of the Sahara). The Sahe-lian Africa environment strains the MODIS algorithms, with both high background albedo and variable fine/coarse parti-tion particle size. RMSEs are more than 50% for allτA<0.8. Slopes for moderate AOD vary between 0.52 and 1.20, al-though in general they are in the 0.6–0.8 range. AOD is neg-atively biased in all ranges at all sites except for Izana (28◦N, 16◦W).
The three sites in equatorial Africa – ICIPE-Mbita (0◦S, 34◦E), Nairobi (1◦S, 37◦E), and Kibale (1◦N, 30◦E), typi-cally exhibited AOD<0.2. They are typically compliant for 50–80% of retrievals with estimated slopes ranging from 0.8 to 1.1. Given the small dynamic range of data for these sites, however,r2values are<0.5. Central Africa hosts the world’s largest biomass burning features in the months of July–October. Despite the size of these features, there are very few AERONET sites in the region and it is difficult to determine if there is the same performance heterogeneity as South America. However, there is some advection into south-ern Africa.
In addition to episodic smoke events from the north, high sulfate pollution is present year around in the South African Highveld and the Johannesburg regions. For biomass burn-ing, Mongu (15◦S, 23◦W) is the only representative site of the central biomass burning region, with moderater2value (∼0.6 for both Terra and Aqua), nearly 50% RMS errors, and a slope of 0.8. Bias between MODIS and AERONET at southern African sites appears to be correlated to particle absorption (Tom Eck, NASA GSFC, personal communica-tion, 2010). In the polluted Skukuza site (25◦S, 32◦E) in the Highveldr2 values are good (>0.75), but a low bias is also persistent (slope = 0.88). The urbanized Witswatersrand University site in Johannesburg (26◦S, 28◦E) shows positive slope bias 1.32 (r2= 0.30) but still exhibits 70% compliance overall.
4.6 Indian sub-continent
Over our the study period, the number of AERONET sites around the Indian Sub-continent was not sufficient to de-termine spatial performance. The major aerosol features of
the Indo-Gangenic Plain do appear to be well represented in MODIS AOD data. At the Kanpur (27◦N, 80◦E) and Gandhi College (26◦N, 84◦E) sites correlations are good (r2>0.7), and slopes are within±0.1 of unity. Compliance is above 77% for both sites and satellites. The limited data (N∼500) at Nainital (29◦N, 79◦E) and Pantnagar (29◦N, 80◦E), right at the base of the Himalayan mounts also per-forms adequately, with some slope bias indicated (ranging from 0.95 to 1.39), andr2values of∼0.25–0.75. All other sites, including all sites outside of the Indo-Gangenic plane (rest of India, Pakistan) have very limited data points (<200) and very poor scores. It is noteworthy, however, that stud-ies with handheld Sun photometers have been conducted in western India for Aqua (Misra et al., 2008). They showed interseasonal variability and moderate r2 values (∼0.5) in MODIS scores, with in general a slope of 0.8 (but see dis-cussion of linear regression in Sect. 2.4).
4.7 East and Southeast Asia
East and Southeast Asia encompasses several of the most complex aerosol and land surface environments. Land sur-face varies from extreme arid to dense vegetation to urban, with occasional strong pollution, smoke, or dust events aloft. Values for individual siter2range from 0.38 – Taipei, Taiwan (25◦N, 122◦E) to 0.84 – Xianghe, China (40◦N, 117◦E), and slopes range from 0.75 (Taipei, Taiwan) to 1.2 – Bei-jing (40◦N, 116◦E). Regions susceptible to dust, smoke, and sulfate aerosol particles can have considerable scatter and ex-traction of exact biases is well outside the scope of this paper. Because of the environmental heterogeneity of Asia, regres-sions can be reasonable, but compliance fraction low, and visa versa. Readers are encouraged to review the individual site statistics given in the Supplement.
SE Asia also shows mixed results. For most sitesr2values are above 0.7, yet compliance is typically less than 60%. Fine mode dominates here, yet slopes ranged from 0.76 – Mukda-han (17◦N, 105◦E) to 1.52 – Bac Lieu (9◦N, 106◦E). Terra and Aqua are reasonably consistent (slope difference<0.2 for most sites).
4.8 Australia
boundary condition bias as well as significant positive errors in retrieved AOD under clean conditions.
5 Diagnosis and correction of errors related to surface boundary condition and microphysics
The site by site biases described in Sect. 4 imply that bi-ases in the MODIS aerosol products are spatially and tem-porally correlated, thus violating a common assumption of many data assimilation schemes (Dee and Da Silva, 1998; Daley and Barker, 2001). Because the RMSE includes both the variance and the bias, systematic biases in the product greatly increase the magnitude of RMSE and hence reduce product impact in the model. Further, systematic bias can re-sult in “hot” and “cold” spots in model analyses which in turn propagate in model forecasts. To the fullest extent possible, data must be debiased before assimilation. Regions which cannot be adequately debiased must be masked.
Two effects that warrant a diagnostic debiasing involve the lower boundary condition and aerosol microphysical bias. Because the lower boundary condition and aerosol micro-physical bias often co-vary, we must be careful to examine them independently. In this section we isolate lower bound-ary condition biases which are subsequently removed from the signal for evaluation of residual microphysical biases.
5.1 Lower boundary condition
Figure 3 illustrates how shortcomings in the parameteriza-tion of the lower boundary condiparameteriza-tion result in systematic biases in the MODIS aerosol products. As discussed in Sect. 2.1, the MODIS AOD retrieval uses a simple model to describe the relationship between surface reflectance in the near-infrared (2.12 µm) and visible (0.66 µm) wavelengths of MODIS. This relationship is affected by numerous environ-mental factors, not all of which are captured in the param-eterization. Viewing conditions such as the scattering an-gle are important, but reflectance is primarily determined by the properties of the surface. Further, Fig. 4b suggests that with the exception of the “hotspot” the treatment of surface anisotropy is sufficient.
Using MODIS albedo data, an empirical correction for the biases shown in Fig. 3 was estimated. Numerous correction schemes were examined, and the best results were obtained with the following form:
τA −τM = m1A0.66µm +m2A2.12µm +b, (6) where A0.66µm and A2.12µm are the MODIS black-sky albedo values at those wavelengths, andm1,m2 andb are parameters to be fit empirically.
To estimate these parameters and test the correc-tion, matched AOD retrievals where τA<0.2 were subdi-vided into estimation and validation subsets (selected by AERONET site name: “A–K” for estimation, “L–Z” for val-idation). Subsets were made geographically independent to
avoid overfitting to confounding regional variation not re-lated to surface properties. Regressing the estimation subset, we obtained a correction of the following form:
τM,corrected=τM−2.66A0.66µm+1.25A2.12µm+0.056 (7) The regression coefficient for this relationship (r2= 0.24) is of the same order as ther2forτMvs.τAfor the low-AOD estimation subset. Regression of albedo data at other wave-lengths (as well as using the 0.66 µm/2.1 µm albedo ratio) was also attempted, but the correlation was not improved (re-sults not shown). Regression re(re-sults using only data from MODIS-Terra or MODIS-Aqua were very similar (results not shown). The contribution of the surface reflectance to observed radiance and thus to AOD error decreases with in-creasing AOD. Therefore, we applied the calculated albedo correction only to retrievals withτM<0.6.
Evaluation of this correction with the geographically in-dependent validation subset showed robust reduction of dif-ferences betweenτM andτA. For 124 AERONET sites in the validation subset where the mean correction toτM was at least 0.005, the albedo correction reduced the mean AOD error in 85 sites. For those 124 sites, the mean site AOD er-ror and the estimated AOD correction were correlated with r=−0.65, indicating the importance of the surface proper-ties in the error budget at low AOD.
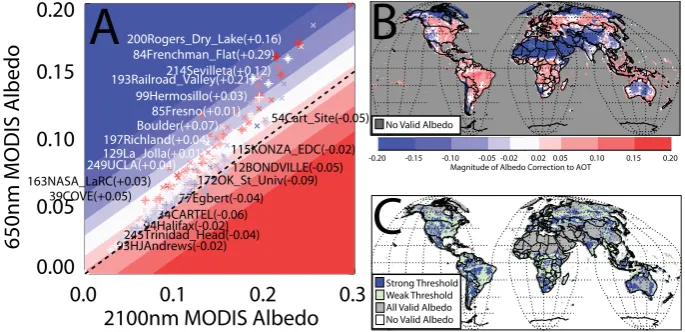
Figure 5 illustrates the nature and effects of the correction shown in Eq. (7). As an example, Fig. 5b shows the magni-tude of the correction estimated from one global data day of MCD43 albedo data from May 2008. Well known high bi-ases in desert regions are visible, especially in such regions as the desert western United States, the Andes Mountains, arid Australia and the desert belt across Africa, and the Tak-lamakan and Gobi deserts. Low biases are visible over the more forested regions over the globe. To demonstrate impact over all AERONET sites, Fig. 5a shows the overall effect of the correction on matched MODIS-AERONET site statis-tics from the complete 2005–2008 data set. Contour lines in Fig. 5a show the magnitude of the correction as a func-tion of the 0.66 µm and 2.12 µm albedo values. Symbols in-dicate specific AERONET stations, color coded to inin-dicate the mean AOD bias forτA<0.2 (opposite in sign to the cor-rection. That is, we want cold colors to counteract warm). The dashed line indicates a 2:1 ratio of near-infrared to vis-ible albedo, a standard assumption in older over-land AOD retrievals (Kaufman et al., 1997).
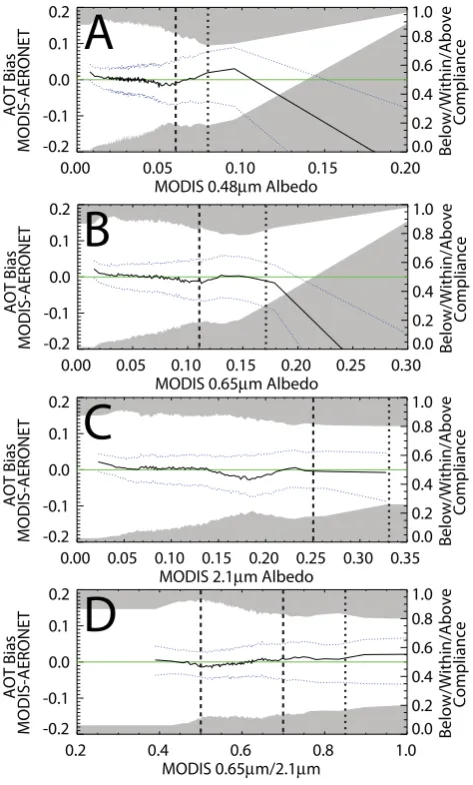
Of 224 sites where the mean absolute AOD correction was greater than 0.005, 70% had reduced absolute bias, 77% had improved compliance, and 79% had reduced RMS error. For most albedo regimes, this correction effectively debiases the albedo error term. Figure 6 presents the same series of plots as Fig. 3 after correction. These graphs show a much weaker relationship between AOD errors and surface albedo proper-ties.
Strong Threshold Weak Threshold All Valid Albedo No Valid Albedo No Valid Albedo
-0.20 -0.15 -0.10 -0.05 -0.02 0.02 0.05 0.10 0.15 0.20 Magnitude of Albedo Correction to AOT
0.0
0.1
0.2
0.3
2100nm MODIS Albedo
0.00
0.05
0.10
0.15
0.20
650nm MODIS Albedo
12BONDVILLE(-0.05)
34CARTEL(-0.06)
54Cart_Site(-0.05)
77Egbert(-0.04)
93HJAndrews(-0.02) 94Halifax(-0.02)
115KONZA_EDC(-0.02)
172OK_St_Univ(-0.09)
245Trinidad_Head(-0.04)
Boulder(+0.07)
39COVE(+0.05)
84Frenchman_Flat(+0.29)
85Fresno(+0.01) 99Hermosillo(+0.03)
129La_Jolla(+0.01)
163NASA_LaRC(+0.03)
193Railroad_Valley(+0.21)
197Richland(+0.04)
200Rogers_Dry_Lake(+0.16)
214Sevilleta(+0.12)
249UCLA(+0.04)
A
B
C
Fig. 5. Albedo correction and filtering and effects on MODIS AOD. (a) Surface albedo and AOD bias for individual sites. Symbols
indicate the mean surface albedo for each AERONET site, with colors indicating the mean bias in AOD forτA<0.2 at that site. Contours
behind indicate the estimated AOD correction based on the surface albedo (Eq. 7). The dashed line indicates the relationship Albedo (0.65 µm) = Albedo(2.1 µm)/2. The symbols are placed to indicate the mean albedo for each AERONET site for the matched
MODIS-AERONET dataset. The colors of the symbols indicate the mean bias ofτMat each site, on a scale that is the reverse of the contours.
Sites marked with “+”, are labeled with the name of the site and the mean bias ofτM for the matched data at that site. (b) Example of
the estimated albedo correction calculated using Eq. (7), using the 16-day MODIS albedo product for days 177–193 of 2008. (c) Effect on geographic coverage of albedo filtering of MODIS AOD product. The map above illustrates 3 zones based on the MODIS albedo product from days 177–193 of 2008. The dark blue area highlights regions where the surface albedo falls within the “strong” limits shown in Fig. 11. The light green area shows regions that fall outside the “strong” limits (50% or more of cases) but within the “weak” limits of Fig. 11. The gray area shows area where valid albedo data were available, but albedo fell outside the “weak” constraints of Fig. 11 (50% or more of cases). Unshaded areas had no valid albedo for the dates shown.
persist at high albedo. Exclusion of certain retrievals based on surface properties is necessary even after correction. The graphs in Figs. 3 and 6 show two cutoffs for albedo val-ues, shown as vertical lines. Based on the error regimes, it is clear that the retrieval works best in the darkest back-grounds to the left of the dashed line (0.06 µm, 0.11 µm, 0.25 µm, and 0.50 for 0.47, 0.66, 2.1 andA0.66µm/A2.12µm, respectively). This “Strict” threshold (dashed lines, to the left) reflects the surface conditions corresponding to the best retrieval performance in the uncorrected product; the more lax “Weak” threshold (dotted lines, to the right) provides sig-nificantly higher coverage while still maintaining acceptable error statistics in most regions. The geographic ramifications of these thresholds are shown in Fig. 5c, for the same data as shown in Fig. 5b: blue areas have at least 50% of albe-dos within the “Strong” thresholds, green areas have at least 50% within the “Weak” thresholds, and gray areas indicate places where albedo data are available, but fewer than 50% fall within the thresholds of Figs. 4 and 6. Note that gray areas do not indicate no usable retrievals; areas in green and gray lose more than 50% of data volume when albedo thresh-olds are applied.
The albedo filtering and correction described here, as well as the snow filtering described in Sect. 3, depend on datasets not available in a timely fashion for operational use. Ap-pendix C to this paper discusses the creation and evaluation
of an alternative approach to filtering and correction using an 8-year data record of MODIS snow and albedo data.
5.2 Residual microphysical bias
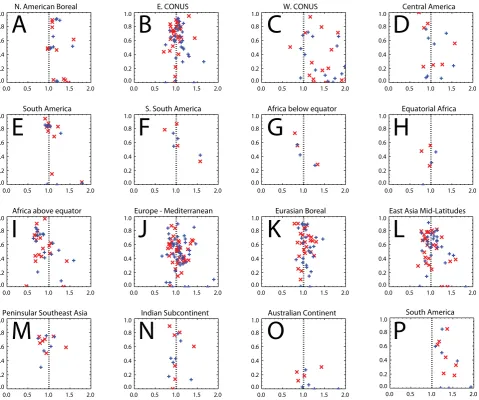
To support bias attribution, we examined each site’s AERONET derived fine/coarse partition as well as regional surface albedo properties. The noise floor statistics, included for each site in the Supplement, are often indicative of issues with the lower boundary condition. Figure 7 shows ther2 versus slope for the regression of allτM(with albedo correc-tion applied) toτA pairs for the range 0.2< τM<1.4. Terra and Aqua MODIS are in red and blue, respectively. Slopes are largely determined by the higher AOD values, which should be more sensitive to microphysical bias. Within some regions, the variability in estimated slope can be large, even for sites with strong correlations to AERONET observa-tions. This suggests spatially and temporally correlated bias in AOD at scales finer than our regional analysis can resolve. However, for many regions, the slope statistics for individ-ual sites are clustered around values significantly different from 1.0. It is these broad slope biases that we hope to quan-tify and, to the extent possible, correct.
0.2 0.4 0.6 0.8 1.0 MODIS 0.65µm/2.1µm
-0.2 -0.1 0.0 0.1 0.2
AOT Bias
MODIS-AERONET 0.0 0.2 0.4 0.6 0.8 1.0
Below/Within/Above
Compliance
0.00 0.05 0.10 0.15 0.20 0.25 0.30 0.35
MODIS 2.1µm Albedo -0.2
-0.1 0.0 0.1 0.2
AOT Bias
MODIS-AERONET 0.0 0.2 0.4 0.6 0.8 1.0
Below/Within/Above
Compliance
0.00 0.05 0.10 0.15 0.20 0.25 0.30
MODIS 0.65µm Albedo -0.2
-0.1 0.0 0.1 0.2
AOT Bias
MODIS-AERONET 0.0 0.2 0.4 0.6 0.8 1.0
Below/Within/Above
Compliance
0.00 0.05 0.10 0.15 0.20
MODIS 0.48µm Albedo -0.2
-0.1 0.0 0.1 0.2
AOT Bias
MODIS-AERONET 0.0 0.2 0.4 0.6 0.8 1.0
Below/Within/Above
Compliance
A
B
C
D
Fig. 6. Error inτM as a function of albedo, after application of
albedo correction. These figures can be directly compared with Fig. 3a–d. Vertical lines indicate thresholds of albedo used for filter-ing of AOD; the dashed lines represent the “strong” constraint, and the dotted lines the “weak” constraint. Note that the “strong” con-straint imposes both a lower and upper limit on the 0.65 µm/2.1 µm albedo ratio.
differences in MODIS efficacy. These slope biases are a re-sult of microphysical bias in the retrieval and are related to aerosol properties such as particle size distribution and sin-gle scattering albedo. We compared mean MODIS bias to the AERONET derived fine mode fraction (O’Neill et al., 2003) for Terra and Aqua separately (Fig. 8a and b, respectively). Figure 8 shows a clear microphysical bias in the retrieval, with MODIS underestimating AOD for dusty environments, and overestimating in environments where fine-mode pollu-tion is dominant. On average, these biases are on the order of ±10–20%. Two regions are highlighted in Fig. 8: Sa-helian Africa (highlighted in brown) and South America (in green). These regions represent clearly disparate regimes of
aerosol physical and optical properties, and the MODIS al-gorithm includes assumed optical properties for these regions that reflect these differences, but may not be entirely accurate (Levy et al., 2007a). In these regions, deviations from unity are quite large, and may indicate an additional misparame-terization in particle absorption. Note that some other areas where fine-mode aerosols dominate may not have the same positive bias (e.g., southern Africa).
Unlike over ocean, there is no reliable size informa-tion available from MODIS to help correct data based on fine/coarse partition on a retrieval by retrieval basis. Given the divergence of site slope performance even for adjacent sites, there is no basis to generate high resolution spatial cor-rection maps based on the AERONET data. We must there-fore attempt large scale regional corrections. We expect that RMSE will be elevated even after correction, because of the currently irresolvable residual bias associated with variation within regions. For the most part, regional corrections are on the order of ±10%, with the largest corrections in the North American boreal region and in Sahelian Africa. Given