R E S E A R C H
Open Access
Time-course microarray analysis for
identifying candidate genes involved in
obesity-associated pathological changes in
the mouse colon
Yun Jung Bae
1†, Sung-Eun Kim
2†, Seong Yeon Hong
2, Taesun Park
3,6, Sang Gyu Lee
4, Myung-Sook Choi
5,6and Mi-Kyung Sung
2,6*Abstract
Background:Obesity is known to increase the risk of colorectal cancer. However, mechanisms underlying the pathogenesis of obesity-induced colorectal cancer are not completely understood. The purposes of this study were to identify differentially expressed genes in the colon of mice with diet-induced obesity and to select candidate genes as early markers of obesity-associated abnormal cell growth in the colon.
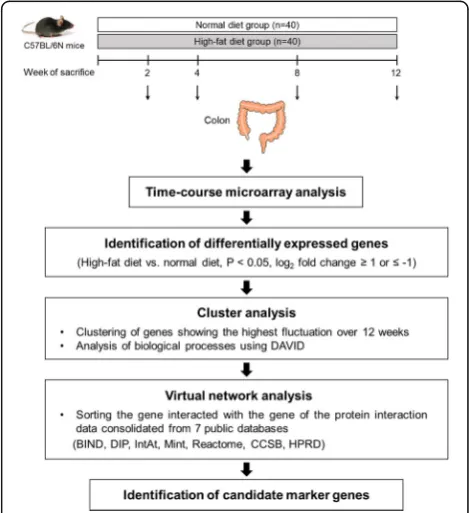
Methods:C57BL/6N mice were fed normal diet (11% fat energy) or high-fat diet (40% fat energy) and were euthanized at different time points. Genome-wide expression profiles of the colon were determined at 2, 4, 8,
and 12 weeks. Cluster analysis was performed using expression data of genes showing log2fold change of≥1
or≤−1 (twofold change), based on time-dependent expression patterns, followed by virtual network analysis.
Results:High-fat diet-fed mice showed significant increase in body weight and total visceral fat weight over 12 weeks. Time-course microarray analysis showed that 50, 47, 36, and 411 genes were differentially expressed at 2, 4, 8, and 12 weeks, respectively. Ten cluster profiles representing distinguishable patterns of genes differentially expressed over time were determined. Cluster 4, which consisted of genes showing the most
significant alterations in expression in response to high-fat diet over 12 weeks, includedApoa4(apolipoprotein
A-IV),Ppap2b(phosphatidic acid phosphatase type 2B),Cel(carboxyl ester lipase), andClps(colipase, pancreatic),
which interacted strongly with surrounding genes associated with colorectal cancer or obesity.
Conclusions:Our data indicate thatApoa4,Ppap2b,Cel, andClpsare candidate early marker genes associated with obesity-related pathological changes in the colon. Genome-wide analyses performed in the present study provide new insights on selecting novel genes that may be associated with the development of diseases of the colon.
Keywords:Obesity, Colorectal cancer, Time-course microarray analysis, Gene expression, Clustering, Virtual network analysis
* Correspondence:[email protected] †Equal contributors
2
Department of Food and Nutrition, Sookmyung Women’s University, 100 Cheongpa-ro 47-gil, Yongsan-gu, Seoul, Republic of Korea
6Food and Nutritional Genomics Research Center, Kyungpook National University, Daegu, Republic of Korea
Full list of author information is available at the end of the article
Background
Obesity is a major global health problem that is closely associated with non-communicable diseases with rapidly increasing incidence, including type 2 diabetes, hyper-tension, cardiovascular diseases, and some cancers [1]. Excess energy intake contributes to abnormal intermedi-ate conditions such as hyperinsulinemia, hyperglycemia, and dyslipidemia, leading to the development of obesity-related metabolic complications [2].
Epidemiological evidence indicates that excess body fat is associated with an increased risk of colorectal cancer (CRC) [3]. The risk of CRC increases by 7% with an in-crease in body mass index (BMI) by 2% [4]. Experimen-tal studies also indicate that diet-induced obesity causes pathological changes in the colon. The number of polyps is significantly higher, and the areas of hyperplasia in the colonic mucosa and inflammatory foci throughout the gastrointestinal tract are broader in high-fat diet (HFD)-fed mice than in control mice [5]. Mice (HFD)-fed HFD for two third of their life span and not treated with carcinogenic chemicals show substantially higher incidence and multi-plicity of colon tumor than mice fed a control diet [6]. Increased circulating concentrations of insulin and leptin are linked to abnormal hyperproliferation of colorectal tissue and inflammation possibly by controlling tran-scription factors involved in the expression of cell growth-regulating molecules [7–12]. Whole-colon prote-omic analyses of wild-type and leptin-deficient ob/ob mice suggest that 40 differently expressed proteins are associated with obesity-related pathological changes in the colon [13]. However, to our knowledge, no study has identified candidate molecules involved in obesity-associated pathological changes in the colon of HFD-fed mice. Moreover, limited information is available on mechanisms underlying the pathophysiological changes in the colon tissue of obese animals.
Interactions between nutritional factors and cellular events in the biological system are extremely compli-cated. Traditional nutrition research design involving one or two molecular targets often cannot explain phenotypic changes induced by missing responses of other important targets to nutritional stimuli. Recent de-velopments in genome-wide analyses have been used to identify biomarkers that respond to nutritional interven-tion such as HFD. Several studies indicate that diet-induced obesity changes gene expression patterns in various tissues. Expression of key adipose transcription factors that regulate adipogenesis and insulin sensitivity, including leptin, resistin, uncoupling protein-2, tumor necrosis factor-alpha (TNF-α), CCAAT/enhancer-bind-ing proteinα, peroxisome proliferator-activated receptor, sterol regulatory element-binding transcription factor 1, and hydroxysteroid 11-beta dehydrogenase 1, is changed in the gonadal fat tissue of HFD-fed animals [14, 15].
HFD also alters the expression of interferon-gamma, interleukin-4, interleukin-10, interleukin-12, and TNF-α in the liver tissue [16]. Despite a strong association be-tween obesity and pathophysiological changes in the small intestine and colon that lead to the development of ulcera-tive colitis, irritable bowel syndrome (IBD), and CRC, only few studies have examined the association between diet-induced obesity and gene expression pattern of the intes-tinal tissue [17, 18]. A recent study reported substantial changes in lipid metabolism-related gene expression in the small intestine of animals fed long-chain fatty acids of marine origin [19]. Our present study is the first to report global transcriptional changes at different time points dur-ing the development of diet-induced obesity in the colon of HFD-fed animals. In addition, we performed bioinfor-matics analyses to identify candidate early marker genes that might be involved in obesity-related pathological events such as CRC and IBD.
Methods Animals
This study was performed in accordance with the Guide for the Care and Use of Laboratory Animals developed by the Institute of Laboratory Animal Resources of the National Research Council [20] and was approved by the Institutional Animal Care and Use Committee of Yonsei University in Seoul, Republic of Korea (Permit No.: 2010-0039). Eighty 5-week-old male C57BL/6N mice (Orient, Gyeonggi-do, Korea) were housed in a temperature (21 ± 2 °C)- and humidity (50 ± 5%)-con-trolled room with a 12-h light/12-h dark cycle. The mice were fed a commercial diet (Purina, St. Louis, MO, USA) for 1 week and were randomly assigned to receive normal diet (ND, n= 40) and HFD (n= 40). HFD con-tained 200 g fat/kg (170 g lard plus 30 g corn oil) and 1% cholesterol by weight. It was formulated to provide 40% of the total energy from fat by replacing carbohy-drates with lard and corn oil; however, it contained the same amount of vitamins and minerals per kilocalorie as those in the ND. Compositions of the experimental diets are presented in Additional file 1: Table S1. The mice were fed the experimental diets and water ad libitum. Food intake of the mice was recorded daily, and their body weights were measured every 3 days. Ten mice per group were sacrificed at 2, 4, 8, and 12 weeks of feeding the experimental diets by fasting them overnight and by anesthetizing them with diethyl ether. Their colons were laid flat on a glass plate, and the colonic mucosa was scraped using a glass slide. The colon samples were stored at−80 °C until their use.
Time-course microarray analysis
Carlsbad, CA, USA), and was purified using RNeasy column (Qiagen, Valencia, CA, USA), according to the manufacturer’s protocols. RNA purity and integrity were evaluated by denaturing gel electrophoresis, OD260/
OD280ratio, and analyzed on the Agilent 2100
Bioanaly-zer (Agilent Technologies, Palo Alto, CA, USA). The RNA Integrity Number (RIN) score was generated on the Agilent software, and the average RIN score of all samples used for microarray analysis was 8.5 ± 0.9 (mean ± SD). To reduce individual variability in gene ex-pression, identical amounts of total colonic RNA were pooled from 10 mice in each experimental group and a pooled RNA sample representing the ND and HFD group at 2, 4, 8, and 12 weeks was subjected to micro-array experiment as described previously [21]. Total RNA was amplified and purified using the Illumina® TotalPrepTM-96 RNA Amplification Kit (Ambion, Austin, TX, USA) to produce biotinylated complementary RNA (cRNA), according to the manufacturer’s instruc-tions. The cRNA obtained was quantified using an ND-1000 Spectrophotometer (NanoDrop, Wilmington, DE, USA). The biotinylated cRNA was hybridized onto the Illumina Mouse WG-6 v2.0 Expression BeadChip (Illu-mina, Inc., San Diego, CA, USA) containing 45,281 probes representing 30,584 genes. After washing and staining, the BeadChip was scanned with the Illumina Bead Array Reader Confocal Scanner according to the manufacturer’s instructions. Raw data were exported and analyzed using BeadStudio v3.1.3 (Gene Expression Module v3.3.8; Illu-mina). All the data analyses and visualization of differen-tially expressed genes were conducted using ArrayAssist® (Stratagene, La Jolla, CA, USA). Values are expressed as log2fold change and were obtained by comparing the gene
expression profiles of HFD-fed mice with those of ND-fed mice. Genes showing log2fold change of≥1 or≤−1 (fold
change of ≥2 or≤−2) were selected, and functional ana-lysis was performed using PANTHER database system (www.patherdb.org). Clustering analysis was performed using genes showing similar expression trends over time. MultiExperiment Viewer program was used to evaluate K-means algorism [22]. A gene cluster showing the highest fluctuation over time was selected, and biological pro-cesses associated with these HFD-responsive genes over time were analyzed using Database for Annotation, Visualization and Integrated Discovery (DAVID, https:// david.ncifcrf.gov/) [23]. Virtual interaction network-targeted genes in the selected cluster were determined using Michigan Molecular Interactions software [24, 25]. In this network, genes that interacted with genes in the protein interaction data consolidated from seven public databases (Biomolecular Interaction Network Database [BIND], Database of Interacting Proteins [DIP], IntAct molecular interaction database [IntAct], Molecular INTer-action database [Mint], Reactome, CCSB Interactome
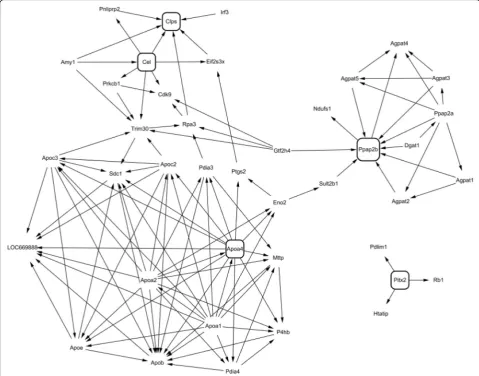
Database [CCSB], and Human Protein Reference Database [HPRD]) were sorted [26–28] (Fig. 1).
Real-time quantitative polymerase chain reaction analysis
Real-time quantitative polymerase chain reaction (qPCR) was conducted to validate microarray data of several dif-ferentially expressed genes that were selected based on the clustering and network analyses and that were asso-ciated with the biological function of interest, including CRC and obesity. Template RNA isolated from the colon tissue was reverse transcribed using Superscript™II RT-PCR System (Invitrogen, Karlsruhe, Germany), accord-ing to the manufacturer’s instructions, for performing dT 20-primed complementary DNA (cDNA) synthesis. Next, real-time qPCR was performed using an ABI PRISM 7900HT Sequence Detection System (Applied Biosystems, Foster City, CA, USA) in 384-well microtiter plates containing a final reaction volume of 10 μl. Four primer/TaqMan probe combinations were designed based on the following sequences obtained from an NCBI public database: Apoa4, Mm00431814_m1; Cel, Mm00486975_m1;Clps, Mm00517960_m1; andPpap2b, Mm00504516_m1. Amplifications were performed using the following protocol: initial template denaturation at 95 °C for 10 min, followed by 40 cycles at 95 °C for 15 s and 60 °C for 1 min. All the samples were amplified in triplicate, and data were analyzed using Sequence Detector software (Applied Biosystems).
Statistical analysis
Differences among mice in the two dietary groups were analyzed by Student’sttest, with SAS 9.4 (SAS Institute, Inc., Cary, NC, USA). Results were considered statisti-cally significant if two-tailedP values were <0.05.
Results
Time-course of changes in body weight, visceral fat pad weight, and food efficiency ratio during the development of diet-induced obesity
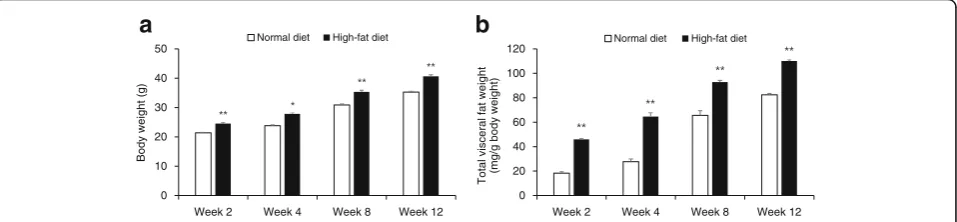
C57BL/6N mice fed HFD for 2 weeks gained signifi-cantly more weight than mice fed ND (P< 0.001; Fig. 2a). At the end of 12 weeks, HFD-fed mice gained 22.3 g weight compared with ND-fed mice that gained 15.3 g weight (P< 0.001). Total visceral fat weight of HFD-fed mice was higher than that of ND-fed mice at as early as 2 weeks of the experiment (P< 0.001; Fig. 2b). Food effi-ciency ratio also increased significantly for HFD-fed mice at all the time points compared with that for ND-fed mice (P< 0.001; Additional file 2: Table S2).
Time-course of transcriptional changes in the colon tissue during the development of diet-induced obesity
Two-dimensional hierarchical clustering showed different gene expression patterns at different time points in HFD-and ND-fed C57BL/6N mice (Additional file 3: Figure S1). The number of HFD-responsive genes at different time points in the colon of C57BL/6N mice is presented in Table 1. We found that 41, 35, 1, and 33 genes were up-regulated and 9, 12, 35, and 378 genes were downregu-lated at 2, 4, 8, and 12 weeks, respectively, in response to HFD (Table 1). Genes affected by HFD at different time points in the colon tissue of C57BL/6N mice are listed in Additional file 4: Table S3.
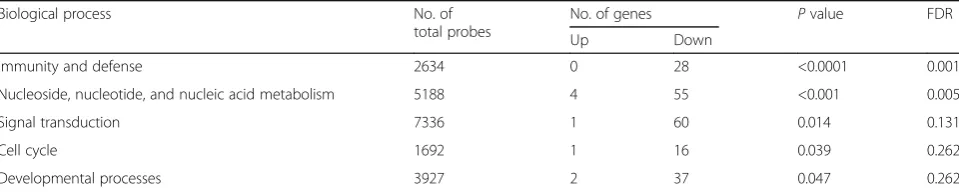
Functional analysis was performed using PANTHER classification system to identify biological processes as-sociated with HFD-responsive genes in the colon tissue of mice. The biological processes associated with HFD-responsive genes in the colon tissue of mice are pre-sented in Table 2. At week 12, HFD affected several
biological processes, including immunity and defense; nucleoside, nucleotide, and nucleic acid metabolism; signal transduction; and cell cycle (Table 2). Biological processes associated with HFD-responsive genes at dif-ferent time points in the colon tissue of C57BL/6N mice are listed in Additional file 5: Table S4.
We also identified HFD-responsive genes showing log2
fold change of≥1 or ≤−1 (corresponding to a fold change of ≥2 or ≤−2) at multiple time points (>3 times) over 12 weeks (Table3). Most HFD-responsive genes were asso-ciated with digestive enzymes such as trypsin, carboxypepti-dase, and amylase. Overall, these genes were upregulated at weeks 2 and 4 and were downregulated at week 12 in HFD-fed mice compared with those ND-fed mice (Table3). Cfd, complement factor D (adipsin), was downregulated at weeks 4, 8, and 12 in HFD-fed mice. Adipsin is suggested to activate an alternative complement pathway for inducing natural defense against infectious agents and red cell lysis and to regulate systemic energy balance [29, 30]. A previous study reported that adipsin expression in the small intestine is a potential marker of changes in normal intestinal epithe-lial differentiation [31]. Pla2g1b, pancreatic phospholipase A2, was upregulated at weeks 2 and 4 and was downregu-lated at week 12 in HFD-fed mice. Pancreatic phospholip-ase A2 catalyzes the relephospholip-ase of fatty acids from dietary phospholipids. Diet is the ultimate source of arachidonic acid present in cellular phospholipids, which serve as pre-cursors of eicosanoid signaling molecules and are involved in inflammation, cell proliferation, and colorectal carcino-genesis. Arachidonic acid is metabolized by PTGS (COX)/ LOX pathway to prostaglandins and leukotrienes, which are associated with carcinogenesis, specifically of colonic carcinogenesis [32, 33].
Cluster and network analyses for identifying candidate early marker genes associated with diet-induced obesity
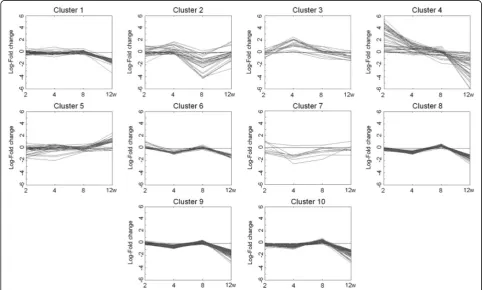
We next selected a cluster of HFD-responsive genes showing the highest fluctuation over time. Ten separate cluster profiles showing distinguishable patterns of genes expressed differentially over time were determined
a
b
0 10 20 30 40 50
Week 2 Week 4 Week 8 Week 12
Body weight (
g
)
Normal diet High-fat diet
0 20 40 60 80 100 120
Week 2 Week 4 Week 8 Week 12
Normal diet High-fat diet
Total
visceral fat weight
(m
g
/g body
weight)
(Fig. 3). The number of genes in each cluster was as fol-lows: cluster 1, 45 genes; cluster 2, 32 genes; cluster 3, 17 genes; cluster 4, 44 genes; cluster 5, 35 genes; cluster 6, 24 genes; cluster 7, 8 genes; cluster 8, 78 genes; clus-ter 9, 103 genes; and clusclus-ter 10, 76 genes. Virtual net-work analysis was performed for genes in cluster 4 that showed the most significant alterations in response to HFD over 12 weeks. The genes in cluster 4 are listed in Table 4. Gene ontology (GO) biological pathway ana-lysis showed that genes in cluster 4 were involved in proteolysis, lipid catabolic process, digestion, defense response, and acute-phase response (Table 5). Results of the virtual network analysis showed that Apoa4 (apolipoprotein A-IV),Ppap2b(phosphatidic acid phos-phatase type 2B), Cel (carboxyl ester lipase), and Clps (colipase, pancreatic) strongly interacted with sur-rounding genes (Fig. 4). Previous studies have reported that these core genes are involved in pathological changes associated with CRC or obesity [34–36]. Re-sults of microarray-based analysis of the expression of these genes were confirmed by performing real-time qPCR at each time point. Overall, the changes in the transcription profiles of Apoa4, Ppap2b, Cel, and Clps determined by real-time qPCR were consistent with the results of microarray analysis (Fig. 5). The direction of change between the two analyses was consistent for the significantly regulated genes except Ppap2b at week 4 (log2 fold change −0.13) and Cel at week 8 (log2 fold
change 0.04).
Discussion
In the present study, we determined global transcrip-tional changes at different time points during the devel-opment of diet-induced obesity in the colon of mice. We also performed bioinformatics analyses to identify candi-date genes that could be used as early markers of obesity-related pathological events. Diet-induced obesity is associated with many chronic diseases, including CRC and IBD. Epidemiological studies have reported a si-gnificant association between BMI and colon cancer (HR, 1.05; 95% CI, 1.02–1.09) [37]. Obese C57BL/6 mice develop colonic epithelial hyperplasia, and the risk of colon cancer increases by 42% after long-term (18 months) western-style diet feeding [38, 39]. A recent study indi-cated that HFD increased the number of polyps in the colon and the area of hyperplasia in the mucous mem-brane tissue of the colon [5]. We previously observed that HFD-fed mice (45% total calories from fat) developed two-times more number of colonic tumors than ND-fed mice possibly because of adipokine-mediated signaling of phosphatidylinositol 3-kinase/Akt pathway [40]. However, limited information is available on mechanisms underlying the associations between obesity and pathophysiological changes in the colon.
In the present study, genes showing differential ex-pression in response to HFD were subjected to cluster-ing and networkcluster-ing analyses. Clustercluster-ing algorithms are frequently used to group genes with similar expression profiles [41]. This facilitates the visualization of coex-pressed genes and allows the identification of genes that concurrently respond to stimuli. We clustered genes that were expressed differentially over time into 10 patterns. Of the 10 clusters, cluster 4 included genes that were the most responsive to HFD. Many of these genes were upregulated after the initiation of HFD and were down-regulated gradually as the mice became obese. We pos-tulated that these genes could be used as early markers of the initiation of metabolic changes in the colon.
We found that genes in cluster 4 were involved in prote-olysis, lipid catabolic process, digestion, defense response, and acute-phase response. These results indicate that HFD
Table 2The biological processes associated with high-fat diet-responsive genes at week 12 in the colon tissue of C57BL/6N mice
Biological process No. of
total probes
No. of genes Pvalue FDR
Up Down
Immunity and defense 2634 0 28 <0.0001 0.001
Nucleoside, nucleotide, and nucleic acid metabolism 5188 4 55 <0.001 0.005
Signal transduction 7336 1 60 0.014 0.131
Cell cycle 1692 1 16 0.039 0.262
Developmental processes 3927 2 37 0.047 0.262
FDRfalse discovery rate using a Benjamini and Hochberg multiple testing correction,P valuemodified Fisher’s exactPvalue calculated by PANTHER database system
Table 1The number of differentially expressed genes affected by the high-fat diet at different time points in the colon tissue of C57BL/6N mice
Weeks Upregulated Downregulated Total
2 41 9 50
4 35 12 47
8 1 35 36
12 33 378 411
Fig. 3Clustering analysis of genes expressed differentially in response to high-fat diet over 12 weeks in the colon tissue of C57BL/6N mice
Table 3Genes expressed differentially in response to high-fat diet at multiple time points in the colon tissue of C57BL/6N mice
Symbol Accession Definition Log2fold change
Week 2 Week 4 Week 8 Week 12
AI747448 NM_001033199.2 Expressed sequence AI747448 (AI747448), mRNA. 1.14 −2.62 −1.88
Amy2 NM_009669.1 Amylase 2, pancreatic (Amy2), mRNA. 3.92 1.91 −4.93
Apoa4 NM_007468.2 Apolipoprotein A-IV (Apoa4), mRNA. 1.06 −1.20 −1.13
Cel NM_009885.1 Carboxyl ester lipase (Cel), mRNA. 3.99 1.26 −3.88
Cfd NM_013459.1 Complement factor D (adipsin) (Cfd), mRNA. −1.93 −1.17 −1.19
Cpa2 NM_001024698.2 Carboxypeptidase A2, pancreatic (Cpa2), mRNA. 2.95 1.01 −1.91
Cpb1 NM_029706.1 Carboxypeptidase B1 (tissue) (Cpb1), mRNA. 4.35 1.31 −4.14
Ctrb1 NM_025583.1 Chymotrypsinogen B1 (Ctrb1), mRNA. 4.08 1.64 −2.84
Ctrl NM_023182.2 Chymotrypsin-like (Ctrl), mRNA. 4.04 1.01 −3.52
Ela2a NM_007919.2 Elastase 2A (Ela2a), mRNA. 5.52 1.08 −6.00
Ela3b NM_026419.1 4.62 1.22 −4.12
LOC100040233 XM_001474605.1 Predicted: similar to trypsinogen 15 (LOC100040233), mRNA. 3.23 1.27 −2.06
Pla2g1b NM_011107.1 Phospholipase A2, group IB, pancreas (Pla2g1b), mRNA. 3.79 1.34 −2.86
Rnase1 NM_011271.2 Ribonuclease, RNase A family, 1 (pancreatic) (Rnase1), mRNA. 4.27 1.29 −3.58
Try10 NM_001038996.1 Trypsin 10 (Try10), mRNA. 3.73 1.55 −2.84
Try4 NM_011646.5 Trypsin 4 (Try4), mRNA. 4.72 1.34 −3.67
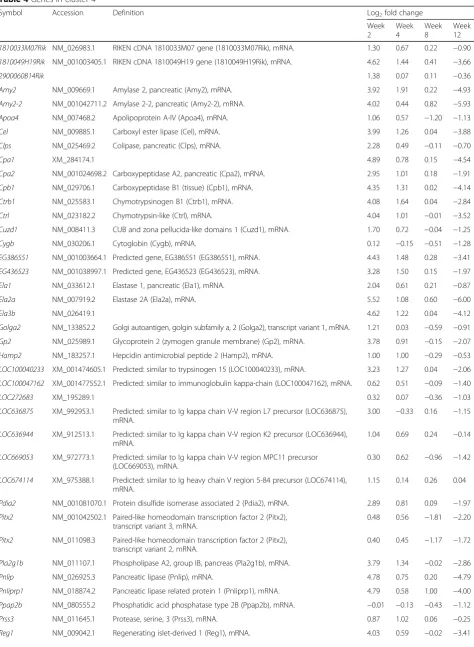
Table 4Genes in cluster 4
Symbol Accession Definition Log2fold change
Week 2
Week 4
Week 8
Week 12
1810033M07Rik NM_026983.1 RIKEN cDNA 1810033M07 gene (1810033M07Rik), mRNA. 1.30 0.67 0.22 −0.90
1810049H19Rik NM_001003405.1 RIKEN cDNA 1810049H19 gene (1810049H19Rik), mRNA. 4.62 1.44 0.41 −3.66
2900060B14Rik 1.38 0.07 0.11 −0.36
Amy2 NM_009669.1 Amylase 2, pancreatic (Amy2), mRNA. 3.92 1.91 0.22 −4.93
Amy2-2 NM_001042711.2 Amylase 2-2, pancreatic (Amy2-2), mRNA. 4.02 0.44 0.82 −5.93
Apoa4 NM_007468.2 Apolipoprotein A-IV (Apoa4), mRNA. 1.06 0.57 −1.20 −1.13
Cel NM_009885.1 Carboxyl ester lipase (Cel), mRNA. 3.99 1.26 0.04 −3.88
Clps NM_025469.2 Colipase, pancreatic (Clps), mRNA. 2.28 0.49 −0.11 −0.70
Cpa1 XM_284174.1 4.89 0.78 0.15 −4.54
Cpa2 NM_001024698.2 Carboxypeptidase A2, pancreatic (Cpa2), mRNA. 2.95 1.01 0.18 −1.91
Cpb1 NM_029706.1 Carboxypeptidase B1 (tissue) (Cpb1), mRNA. 4.35 1.31 0.02 −4.14
Ctrb1 NM_025583.1 Chymotrypsinogen B1 (Ctrb1), mRNA. 4.08 1.64 0.04 −2.84
Ctrl NM_023182.2 Chymotrypsin-like (Ctrl), mRNA. 4.04 1.01 −0.01 −3.52
Cuzd1 NM_008411.3 CUB and zona pellucida-like domains 1 (Cuzd1), mRNA. 1.70 0.72 −0.04 −1.25
Cygb NM_030206.1 Cytoglobin (Cygb), mRNA. 0.12 −0.15 −0.51 −1.28
EG386551 NM_001003664.1 Predicted gene, EG386551 (EG386551), mRNA. 4.43 1.48 0.28 −3.41
EG436523 NM_001038997.1 Predicted gene, EG436523 (EG436523), mRNA. 3.28 1.50 0.15 −1.97
Ela1 NM_033612.1 Elastase 1, pancreatic (Ela1), mRNA. 2.04 0.61 0.21 −0.87
Ela2a NM_007919.2 Elastase 2A (Ela2a), mRNA. 5.52 1.08 0.60 −6.00
Ela3b NM_026419.1 4.62 1.22 0.04 −4.12
Golga2 NM_133852.2 Golgi autoantigen, golgin subfamily a, 2 (Golga2), transcript variant 1, mRNA. 1.21 0.03 −0.59 −0.91
Gp2 NM_025989.1 Glycoprotein 2 (zymogen granule membrane) (Gp2), mRNA. 3.78 0.91 −0.15 −2.07
Hamp2 NM_183257.1 Hepcidin antimicrobial peptide 2 (Hamp2), mRNA. 1.00 1.00 −0.29 −0.53
LOC100040233 XM_001474605.1 Predicted: similar to trypsinogen 15 (LOC100040233), mRNA. 3.23 1.27 0.04 −2.06
LOC100047162 XM_001477552.1 Predicted: similar to immunoglobulin kappa-chain (LOC100047162), mRNA. 0.62 0.51 −0.09 −1.40
LOC272683 XM_195289.1 0.32 0.07 −0.36 −1.03
LOC636875 XM_992953.1 Predicted: similar to Ig kappa chain V-V region L7 precursor (LOC636875), mRNA.
3.00 −0.33 0.16 −1.15
LOC636944 XM_912513.1 Predicted: similar to Ig kappa chain V-V region K2 precursor (LOC636944), mRNA.
1.04 0.69 0.24 −0.14
LOC669053 XM_972773.1 Predicted: similar to Ig kappa chain V-V region MPC11 precursor (LOC669053), mRNA.
0.30 0.62 −0.96 −1.42
LOC674114 XM_975388.1 Predicted: similar to Ig heavy chain V region 5-84 precursor (LOC674114), mRNA.
1.15 0.14 0.26 0.04
Pdia2 NM_001081070.1 Protein disulfide isomerase associated 2 (Pdia2), mRNA. 2.89 0.81 0.09 −1.97
Pitx2 NM_001042502.1 Paired-like homeodomain transcription factor 2 (Pitx2), transcript variant 3, mRNA.
0.48 0.56 −1.81 −2.20
Pitx2 NM_011098.3 Paired-like homeodomain transcription factor 2 (Pitx2), transcript variant 2, mRNA.
0.40 0.45 −1.17 −1.72
Pla2g1b NM_011107.1 Phospholipase A2, group IB, pancreas (Pla2g1b), mRNA. 3.79 1.34 −0.02 −2.86
Pnlip NM_026925.3 Pancreatic lipase (Pnlip), mRNA. 4.78 0.75 0.20 −4.79
Pnliprp1 NM_018874.2 Pancreatic lipase related protein 1 (Pnliprp1), mRNA. 4.79 0.58 1.00 −4.00
Ppap2b NM_080555.2 Phosphatidic acid phosphatase type 2B (Ppap2b), mRNA. −0.01 −0.13 −0.43 −1.12
Prss3 NM_011645.1 Protease, serine, 3 (Prss3), mRNA. 0.87 1.02 0.06 −0.25
upregulated the expression of genes involved in lipid catab-olism and that these genes were downregulated over time possibly due to interactions with other compensatory and/ or adaptive mechanisms. Extracellular proteolysis is critical for tumor growth [42]. Trypsin activates protease-activated receptor-2 (PAR-2) and increases COX-2 expression through PAR-2 in Caco-2 cells [43]. These proteolytic activ-ities may promote tumor cell growth and invasion, suggest-ing that HFD increases the risk of tumor development by facilitating proteolytic activity. Oxidative stress and gene– environment interactions play a significant role in the de-velopment of colon cancer [44]. Oxidative stress results from an imbalance in the production of reactive oxygen species and cellular antioxidant defense system. In the present study, genes associated with defense response tended to be downregulated over time during HFD admin-istration and before colon cancer initiation. This result sug-gests that continuous HFD administration affects defense mechanisms, which in turn may increase the risk of CRC.
For further analysis, genes in cluster 4 were subjected to network analysis by using BIND, DIP, IntAct, Mint, Reac-tome, CCSB, and HPRD protein–protein interaction data-bases. Among the genes in cluster 4, four genes showing the most significant relationship with surrounding genes were selected and their expression was verified. Previous studies indicate that these four genes are associated with pathological changes in the colon or with obesity. APOA4 is an intestinally and cerebrally synthesized antiatherogenic
plasma apolipoprotein that functions as a satiety factor and anti-inflammatory protein. Intestinal APOA4 synthesis is stimulated by fat intake and is attenuated by intravenous leptin infusion, indicating a close association between fat and energy intake [45].Apoa4expression is altered along with that of other genes involved in epithelial junctional integrity in the intestinal mucosa of patients with IBD [46]. APOA4 stabilizes adherent junctions by interacting withα-catenin and may be involved in the maintenance of junctional integrity. Epithelial tight junctions form a barrier to prevent the movement of pathogens, toxins, and allergens from the intestinal lumen into the tissue, and disruption of these tight junctions may play an important role in the pathogenesis of gastrointestinal diseases [47, 48].
Lipid phosphate phosphatase 3 (LPP3) encoded by Ppap2b is an integral membrane glycoprotein that cata-lyzes the dephosphorylation of several bioactive lipid mediators, including lysophosphatidic acid, sphingosine 1-phosphate, and phosphatidic acid. Moreover, LPP3 functions as a cell-associated integrin ligand [49, 50]. A recent study reported that LPP3 does not promote tumor formation but amplifies β-catenin signaling and cyclin-D1 activity to potentiate the growth of SW480 colon carcinoma [51]. Aberrant activation of PI3K/Akt/ mTOR and MAPK/ERK pathways may induce colon tumor growth and progression by increasing β-catenin and cyclin-D1 expression [52, 53].
Table 4Genes in cluster 4(Continued)
Rnase1 NM_011271.2 Ribonuclease, RNase A family, 1 (pancreatic) (Rnase1), mRNA. 4.27 1.29 0.22 −3.58
Saa3 NM_011315.3 Serum amyloid A 3 (Saa3), mRNA. 0.24 −0.16 −0.46 −1.40
Serpina3n NM_009252.2 Serine (or cysteine) peptidase inhibitor, clade A, member 3N (Serpina3n), mRNA.
0.19 −0.38 −0.35 −1.02
Tff2 NM_009363.3 Trefoil factor 2 (spasmolytic protein 1) (Tff2), mRNA. 2.84 0.81 0.15 −2.18
Try10 NM_001038996.1 Trypsin 10 (Try10), mRNA. 3.73 1.55 0.09 −2.84
Try4 NM_011646.5 Trypsin 4 (Try4), mRNA. 4.72 1.34 0.15 −3.67
Log2fold change of≥1 or≤−1 corresponds to a fold change of≥2 or≤−2, respectively, based on a comparison between high-fat diet-and normal diet-fed mice at each time point (P< 0.05)
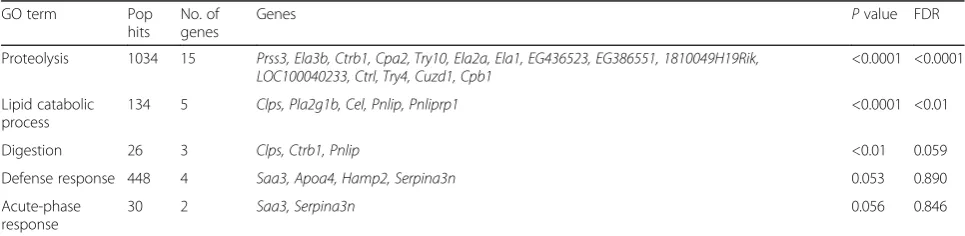
Table 5Gene ontology biological pathway analysis of genes in cluster 4
GO term Pop
hits
No. of genes
Genes Pvalue FDR
Proteolysis 1034 15 Prss3, Ela3b, Ctrb1, Cpa2, Try10, Ela2a, Ela1, EG436523, EG386551, 1810049H19Rik, LOC100040233, Ctrl, Try4, Cuzd1, Cpb1
<0.0001 <0.0001
Lipid catabolic process
134 5 Clps, Pla2g1b, Cel, Pnlip, Pnliprp1 <0.0001 <0.01
Digestion 26 3 Clps, Ctrb1, Pnlip <0.01 0.059
Defense response 448 4 Saa3, Apoa4, Hamp2, Serpina3n 0.053 0.890
Acute-phase response
30 2 Saa3, Serpina3n 0.056 0.846
Carboxyl ester lipase (CEL) encoded by Cel is a 74-kDa lipolytic enzyme that hydrolyzes cholesteryl esters, triacylglycerol, phospholipids, and lysophospholipids [54, 55]. This enzyme is synthesized in acinar cells of the pancreas and is stored in zymogen granules. Upon food ingestion, CEL is released into the intestinal lumen where it constitutes 1–5% of total proteins in the pan-creatic juice [56]. CEL plays a significant role in catalyz-ing the absorption of cholesteryl esters from the intestinal lumen and in promoting the formation of large chylomicron [57, 58]. A recent study reported thatCel -knockout mice developed a mild diabetic phenotype after the administration of 60% HFD [59]. Since insulin resistance is a risk factor of colon cancer, differential ex-pression of Celin obese animals may be responsible for the association of obesity with the pathophysiological changes in the colon.
Clps encodes colipase that is secreted from the exo-crine pancreas into the gastrointestinal tract [60]. Coli-pase may interact with pancreatic triglyceride liColi-pase to
facilitate the digestion of dietary fats. HFD-fed Clps−/− mice develop hyperphagia, and procolipase performs essential functions by regulating body weight set point [61]. Also, Clps genetic variability is associated with insulin secretory function in non-diabetic humans, suggesting that Clps is a novel candidate gene associ-ated with the development of type 2 diabetes [36]. Regulation of insulin secretion is important for meta-bolic homeostasis in various tissues, including the liver, adipose tissue, and colon [62]. Therefore, Clps expression would be a potential early marker of the development of obesity, insulin resistance, and/or colon cancer.
Conclusions
In conclusion, our data indicate that a few genes primar-ily involved in lipid metabolism play a functional role in diet-induced pathological changes in the colon. Genome-wide analyses performed in the present study provide new insights on selecting novel genes that may
be associated with the development of diseases of the colon. Further studies assessing the functions of these selected genes are necessary to verify them as novel bio-markers for the prevention, early detection, and treat-ment of obesity-induced CRC.
Additional files
Additional file 1: Table S1.Composition of the experimental diets.
Additional file 2: Table S2.Food intake and food efficiency ratio of C57BL/6N mice fed normal or high-fat diet for 12 weeks. Data are expressed as mean ± SEM (n= 10/group). Asterisks indicate significant differences between mice in the two diet groups according to Student’s ttest (*P< 0.001).
Additional file 3: Figure S1.Two-dimensional hierarchical clustering analysis of fold changes in gene expression during the development of diet-induced obesity inanormal diet- andbhigh-fat diet-fed C57BL/6N mice. A color gradient fromgreen to redindicates low- and high-fold change, respectively.
Additional file 4: Table S3.Genes affected by high-fat diet at different time points in the colon tissue of C57BL/6N mice. Log2fold change of
≥1 or≤−1 corresponds to a fold change of≥2 or≤−2, respectively, based on a comparison between high-fat diet- and normal diet-fed mice at each time point (P< 0.05).
Additional file 5: Table S4.Biological processes associated with high-fat diet-responsive genes at different time points in the colon tissue of C57BL/6N mice.
Abbreviations
Apoa 4:Apolipoprotein A-IV;Cel: Carboxyl ester lipase;Clps: Colipase, pancreatic; CRC: Colorectal cancer; HFD: High-fat diet; IBD: Irritable bowel
syndrome; ND: Normal diet;Ppap2b: Phosphatidic acid phosphatase type 2B; qPCR: Quantitative polymerase chain reaction
Acknowledgements Not applicable.
Funding
This research was supported by the SRC program (Center for Food & Nutritional Genomics: No.2015R1A5A6001906) and the Mid-Career Research Program (No.2015R1A2A2A01004607) of the National Research Foundation of Korea (NRF) funded by the Ministry of Education, Science, and Technology.
Availability of data and materials
The dataset supporting the conclusions of this article is included within the article and its Additional files 1, 2, 3, 4, and 5.
Authors’contributions
M-KS, M-SC, and TP conceived and designed the experiments. SYH contributed to the animal experiment. SGL performed the bioinformatics analyses. YJB and S-EK contributed to the analysis and interpretation of data and drafted the manuscript. M-KS critically revised the manuscript. All authors have read and approved the final manuscript.
Competing interests
The authors declare that they have no competing interests.
Consent for publication Not applicable.
Ethics approval
This study was approved by the Institutional Animal Care and Use Committee of Yonsei University in Seoul, Republic of Korea (Permit #: 2011-0061). All institutional and national guidelines for the care and use of laboratory animals were followed.
Week 2 Week 4 Week 8 Week 12
Microarray 3.99 1.26 0.04 -3.88
Real-time qPCR 6.52 2.02 -0.98 -6.80
-8 -6 -4 -2 0 2 4 6 8 log 2 fold change
6.52 ± 0.17 2.02 ± 0.13 -0.98 ± 0.32 -6.80 ± 0.21
Week 2 Week 4 Week 8 Week 12
Microarray 2.28 0.49 -0.11 -0.70
Real-time qPCR 2.16 1.02 -2.53 -0.48
-4 -3 -2 -1 0 1 2 3 log 2 fold change
2.16 ± 0.11 1.02 ± 0.08 -2.53 ± 0.56 -0.48 ± 0.24
Week 2 Week 4 Week 8 Week 12
Microarray -0.01 -0.13 -0.43 -1.12
Real-time qPCR 0.00 1.59 -1.91 -1.25
-3.0 -2.0 -1.0 0.0 1.0 2.0 3.0 log 2 fold change
0.00 ± 0.05 1.59 ± 0.69 -1.91 ± 0.55 -1.25 ± 0.02
Week 2 Week 4 Week 8 Week 12
Microarray 1.06 0.57 -1.20 -1.13
Real-time qPCR 1.47 0.74 -3.97 -3.61
-6 -5 -4 -3 -2 -1 0 1 2 log 2 fold change
1.47 ± 0.01 0.74 ± 0.02 -3.97 ± 0.80 -3.61 ± 0.19
a
Apoa4
c
Cel
d
Clpsb
Ppap2b
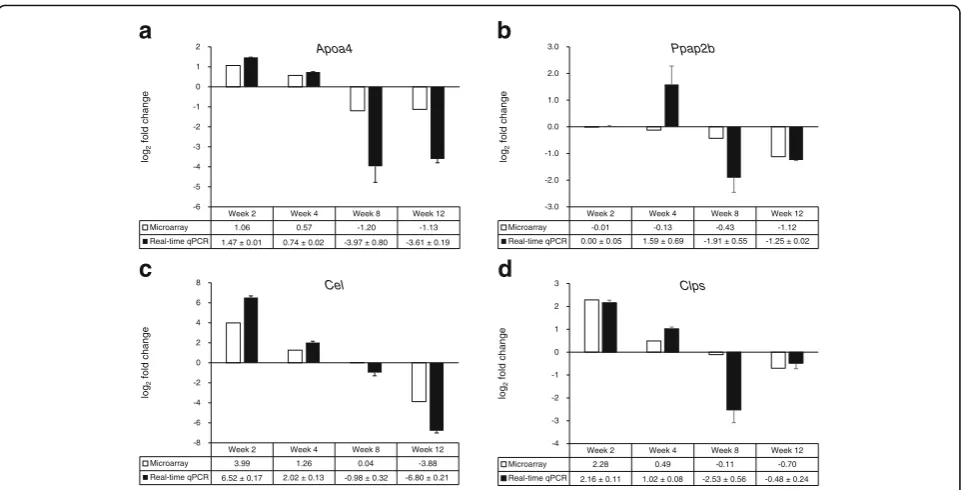
Fig. 5Comparison of log2fold changes in gene expression detected by performing microarray and quantitative reverse transcription-PCR
ana-lyses. Microarray data are presented as log2-transformed mean fold changes (high-fat diet vs. normal diet) in gene expression at each time point.
The real-time qPCR data are shown as log2-transformed mean fold changes ± SEM of the RNA samples pooled from 10 mice per group (n= 3).
Author details
1Division of Food Science and Culinary Arts, Shinhan University, Gyeonggi-do, Republic of Korea.2Department of Food and Nutrition, Sookmyung Women’s University, 100 Cheongpa-ro 47-gil, Yongsan-gu, Seoul, Republic of Korea.3Department of Food and Nutrition, Yonsei University, Seoul, Republic of Korea.4School of Life Science and Biotechnology, Kyungpook National University, Daegu, Republic of Korea.5Department of Food Science and Nutrition, Kyungpook National University, Daegu, Republic of Korea.6Food and Nutritional Genomics Research Center, Kyungpook National University, Daegu, Republic of Korea.
Received: 3 August 2016 Accepted: 7 November 2016
References
1. Masaki T, Yoshimatsu H. Obesity, adipocytokines and cancer. Transl Oncogenomics. 2008;3:45–52.
2. Popkin BM, Kim S, Rusev ER, Du S, Zizza C. Measuring the full economic costs of diet, physical activity and obesity-related chronic diseases. Obes Rev. 2006;7:271–93.
3. World Cancer Research Fund/American Institute for Cancer Research. Food, nutrition, and physical activity, and the prevention of cancer: a global perspective. Washington: American Institute for Cancer Research; 2007. 4. Calle EE, Kaaks R. Overweight, obesity and cancer: epidemiological evidence
and proposed mechanisms. Nat Rev Cancer. 2004;4:579–91.
5. Aslam MN, Paruchuri T, Bhagavathula N, Varani J. A mineral-rich red algae extract inhibits polyp formation and inflammation in the gastrointestinal tract of mice on a high-fat diet. Integr Cancer Ther. 2010;9:93–9. 6. Yang K, Kurihara N, Fan K, Newmark H, Rigas B, Bancroft L, Corner G, Livote
E, Lesser M, Edelmann W, et al. Dietary induction of colonic tumors in a mouse model of sporadic colon cancer. Cancer Res. 2008;68:7803–10. 7. Sitaraman S, Liu X, Charrier L, Gu LH, Ziegler TR, Gewirtz A, Merlin D. Colonic
leptin: source of a novel proinflammatory cytokine involved in IBD. FASEB J. 2004;18:696–8.
8. Stattin P, Lukanova A, Biessy C, Soderberg S, Palmqvist R, Kaaks R, Olsson T, Jellum E. Obesity and colon cancer: does leptin provide a link? Int J Cancer. 2004;109:149–52.
9. Karmiris K, Koutroubakis IE, Xidakis C, Polychronaki M, Voudouri T, Kouroumalis EA. Circulating levels of leptin, adiponectin, resistin, and ghrelin in inflammatory bowel disease. Inflamm Bowel Dis. 2006;12:100–5. 10. Koda M, Sulkowska M, Kanczuga-Koda L, Surmacz E, Sulkowski S.
Overexpression of the obesity hormone leptin in human colorectal cancer. J Clin Pathol. 2007;60:902–6.
11. Becker S, Dossus L, Kaaks R. Obesity related hyperinsulinaemia and hyperglycaemia and cancer development. Arch Physiol Biochem. 2009;115:86–96.
12. Huang XF, Chen JZ. Obesity, the PI3K/Akt signal pathway and colon cancer. Obes Rev. 2009;10:610–6.
13. Padidar S, Farquharson AJ, Williams LM, Hoggard N, Reid MD, Duncan GJ, Drew JE: Impact of obesity and leptin on protein expression profiles in mouse colon. Dig Dis Sci. 2011;56:1028–36.
14. Kim YJ, Park T. Genes are differentially expressed in the epididymal fat of rats rendered obese by a high-fat diet. Nutr Res. 2008;28:414–22. 15. Miller RS, Becker KG, Prabhu V, Cooke DW. Adipocyte gene expression is
altered in formerly obese mice and as a function of diet composition. J Nutr. 2008;138:1033–8.
16. Syn WK, Yang L, Chiang DJ, Qian Y, Jung Y, Karaca G, Choi SS, Witek RP, Omenetti A, Pereira TA, Diehl AM. Genetic differences in oxidative stress and inflammatory responses to diet-induced obesity do not alter liver fibrosis in mice. Liver Int. 2009;29:1262–72.
17. Renehan AG, Roberts DL, Dive C. Obesity and cancer: pathophysiological and biological mechanisms. Arch Physiol Biochem. 2008;114:71–83. 18. Giouleme O, Diamantidis MD, Katsaros MG. Is diabetes a causal agent for
colorectal cancer? Pathophysiological and molecular mechanisms. World J Gastroenterol. 2011;17:444–8.
19. van Schothorst EM, Flachs P, Franssen-van Hal NL, Kuda O, Bunschoten A, Molthoff J, Vink C, Hooiveld GJ, Kopecky J, Keijer J. Induction of lipid oxidation by polyunsaturated fatty acids of marine origin in small intestine of mice fed a high-fat diet. BMC Genomics. 2009;10:110.
20. Institute of Laboratory Animal Resources. Guide for the care and use of laboratory animals. Washington: National Academies Press; 1996.
21. Do GM, Kwon EY, Kim E, Kim HS, Choi MS. Hepatic transcription response to high-fat treatment in mice: microarray comparison of individual vs. pooled RNA samples. Biotechnol J. 2010;5:970–3.
22. Saeed AI, Sharov V, White J, Li J, Liang W, Bhagabati N, Braisted J, Klapa M, Currier T, Thiagarajan M, et al. TM4: a free, open-source system for microarray data management and analysis. Biotechniques. 2003;34:374–8. 23. da Huang W, Sherman BT, Lempicki RA. Systematic and integrative analysis
of large gene lists using DAVID bioinformatics resources. Nat Protoc. 2009;4:44–57.
24. Gao J, Ade AS, Tarcea VG, Weymouth TE, Mirel BR, Jagadish HV, States DJ. Integrating and annotating the interactome using the MiMI plugin for cytoscape. Bioinformatics. 2009;25:137–8.
25. Tarcea VG, Weymouth T, Ade A, Bookvich A, Gao J, Mahavisno V, Wright Z, Chapman A, Jayapandian M, Ozgur A, et al. Michigan molecular interactions r2: from interacting proteins to pathways. Nucleic Acids Res. 2009;37:D642–6. 26. Joshi-Tope G, Gillespie M, Vastrik I, D’Eustachio P, Schmidt E, de Bono B,
Jassal B, Gopinath GR, Wu GR, Matthews L, et al. Reactome: a
knowledgebase of biological pathways. Nucleic Acids Res. 2005;33:D428–32. 27. Rual JF, Venkatesan K, Hao T, Hirozane-Kishikawa T, Dricot A, Li N, Berriz GF, Gibbons FD, Dreze M, Ayivi-Guedehoussou N, et al. Towards a proteome-scale map of the human protein-protein interaction network. Nature. 2005; 437:1173–8.
28. Lehne B, Schlitt T. Protein-protein interaction databases: keeping up with growing interactomes. Hum Genomics. 2009;3:291–7.
29. White RT, Damm D, Hancock N, Rosen BS, Lowell BB, Usher P, Flier JS, Spiegelman BM. Human adipsin is identical to complement factor D and is expressed at high levels in adipose tissue. J Biol Chem. 1992;267:9210–3. 30. Choy LN, Rosen BS, Spiegelman BM. Adipsin and an endogenous pathway
of complement from adipose cells. J Biol Chem. 1992;267:12736–41. 31. Searfoss GH, Jordan WH, Calligaro DO, Galbreath EJ, Schirtzinger LM,
Berridge BR, Gao H, Higgins MA, May PC, Ryan TP. Adipsin, a biomarker of gastrointestinal toxicity mediated by a functional gamma-secretase inhibitor. J Biol Chem. 2003;278:46107–16.
32. Greenhough A, Smartt HJ, Moore AE, Roberts HR, Williams AC, Paraskeva C, Kaidi A. The COX-2/PGE2 pathway: key roles in the hallmarks of cancer and adaptation to the tumour microenvironment. Carcinogenesis. 2009;30:377–86. 33. Menna C, Olivieri F, Catalano A, Procopio A. Lipoxygenase inhibitors for
cancer prevention: promises and risks. Curr Pharm Des. 2010;16:725–33. 34. Adeyemo A, Luke A, Cooper R, Wu X, Tayo B, Zhu X, Rotimi C, Bouzekri N,
Ward R. A genome-wide scan for body mass index among Nigerian families. Obes Res. 2003;11:266–73.
35. Gilham D, Labonte ED, Rojas JC, Jandacek RJ, Howles PN, Hui DY. Carboxyl ester lipase deficiency exacerbates dietary lipid absorption abnormalities and resistance to diet-induced obesity in pancreatic triglyceride lipase knockout mice. J Biol Chem. 2007;282:24642–9.
36. Weyrich P, Albet S, Lammers R, Machicao F, Fritsche A, Stefan N, Haring HU. Genetic variability of procolipase associates with altered insulin secretion in non-diabetic Caucasians. Exp Clin Endocrinol Diabetes. 2009;117:83–7. 37. Andreotti G, Hou L, Beane Freeman LE, Mahajan R, Koutros S, Coble J, Lubin
J, Blair A, Hoppin JA, Alavanja M. Body mass index, agricultural pesticide use, and cancer incidence in the Agricultural Health Study cohort. Cancer Causes Control. 2010;21:1759–75.
38. Newmark HL, Lipkin M, Maheshwari N. Colonic hyperplasia and
hyperproliferation induced by a nutritional stress diet with four components of Western-style diet. J Natl Cancer Inst. 1990;82:491–6.
39. Newmark HL, Yang K, Lipkin M, Kopelovich L, Liu Y, Fan K, Shinozaki H. A Western-style diet induces benign and malignant neoplasms in the colon of normal C57Bl/6 mice. Carcinogenesis. 2001;22:1871–5.
40. Park SY, Kim JS, Seo YR, Sung MK: Effects of diet-induced obesity on colitis-associated colon tumor formation in A/J mice. Int J Obes (Lond). 2012;36:273–80. 41. Svrakic NM, Nesic O, Dasu MR, Herndon D, Perez-Polo JR. Statistical
approach to DNA chip analysis. Recent Prog Horm Res. 2003;58:75–93. 42. Seiki M, Yana I. Roles of pericellular proteolysis by membrane type-1
matrix metalloproteinase in cancer invasion and angiogenesis. Cancer Sci. 2003;94:569–74.
43. Hirota CL, Moreau F, Iablokov V, Dicay M, Renaux B, Hollenberg MD, MacNaughton WK. Epidermal growth factor receptor transactivation is required for proteinase-activated receptor-2-induced COX-2 expression in intestinal epithelial cells. Am J Physiol Gastrointest Liver Physiol. 2012;303:G111–9. 44. Acharya A, Das I, Chandhok D, Saha T. Redox regulation in cancer: a
45. Tso P, Liu M. Apolipoprotein A-IV, food intake, and obesity. Physiol Behav. 2004;83:631–43.
46. Orso E, Moehle C, Boettcher A, Szakszon K, Werner T, Langmann T, Liebisch G, Buechler C, Ritter M, Kronenberg F, et al. The satiety factor apolipoprotein A-IV modulates intestinal epithelial permeability through its interaction with alpha-catenin: implications for inflammatory bowel diseases. Horm Metab Res. 2007;39:601–11.
47. Huo Q, Kinugasa T, Wang L, Huang J, Zhao J, Shibaguchi H, Kuroki M, Tanaka T, Yamashita Y, Nabeshima K, et al. Claudin-1 protein is a major factor involved in the tumorigenesis of colorectal cancer. Anticancer Res. 2009;29:851–7.
48. Kinugasa T, Akagi Y, Yoshida T, Ryu Y, Shiratuchi I, Ishibashi N, Shirouzu K. Increased claudin-1 protein expression contributes to tumorigenesis in ulcerative colitis-associated colorectal cancer. Anticancer Res. 2010;30:3181–6. 49. Sciorra VA, Morris AJ. Roles for lipid phosphate phosphatases in regulation
of cellular signaling. Biochim Biophys Acta. 2002;1582:45–51. 50. Humtsoe JO, Bowling Jr RA, Feng S, Wary KK. Murine lipid phosphate
phosphohydrolase-3 acts as a cell-associated integrin ligand. Biochem Biophys Res Commun. 2005;335:906–19.
51. Chatterjee I, Humtsoe JO, Kohler EE, Sorio C, Wary KK. Lipid phosphate phosphatase-3 regulates tumor growth via beta-catenin and CYCLIN-D1 signaling. Mol Cancer. 2011;10:51.
52. Kanwar SS, Yu Y, Nautiyal J, Patel BB, Majumdar AP. The Wnt/beta-catenin pathway regulates growth and maintenance of colonospheres. Mol Cancer. 2010;9:212.
53. Zhao JH, Luo Y, Jiang YG, He DL, Wu CT. Knockdown of beta-Catenin through shRNA cause a reversal of EMT and metastatic phenotypes induced by HIF-1alpha. Cancer Invest. 2011;29:377–82.
54. Wang CS, Hartsuck JA. Bile salt-activated lipase. A multiple function lipolytic enzyme. Biochim Biophys Acta. 1993;1166:1–19.
55. Hui DY. Molecular biology of enzymes involved with cholesterol ester hydrolysis in mammalian tissues. Biochim Biophys Acta. 1996;1303:1–14. 56. Wang CS, Kloer HU. Kinetic properties of human pancreatic
carboxylesterase. Biochim Biophys Acta. 1983;754:142–9.
57. Howles PN, Carter CP, Hui DY. Dietary free and esterified cholesterol absorption in cholesterol esterase (bile salt-stimulated lipase) gene-targeted mice. J Biol Chem. 1996;271:7196–202.
58. Kirby RJ, Zheng S, Tso P, Howles PN, Hui DY. Bile salt-stimulated carboxyl ester lipase influences lipoprotein assembly and secretion in intestine: a process mediated via ceramide hydrolysis. J Biol Chem. 2002;277:4104–9. 59. Vesterhus M, Raeder H, Kurpad AJ, Kawamori D, Molven A, Kulkarni RN, Kahn
CR, Njolstad PR. Pancreatic function in carboxyl-ester lipase knockout mice. Pancreatology. 2010;10:467–76.
60. Borgstrom BE-AC. Pancreatic Colipase. Amsterdam: Elsevier; 1984. 61. D’Agostino D, Cordle RA, Kullman J, Erlanson-Albertsson C, Muglia LJ, Lowe
ME. Decreased postnatal survival and altered body weight regulation in procolipase-deficient mice. J Biol Chem. 2002;277:7170–7.
62. Wu Y, Yakar S, Zhao L, Hennighausen L, LeRoith D. Circulating insulin-like growth factor-I levels regulate colon cancer growth and metastasis. Cancer Res. 2002;62:1030–5.
• We accept pre-submission inquiries
• Our selector tool helps you to find the most relevant journal • We provide round the clock customer support
• Convenient online submission • Thorough peer review
• Inclusion in PubMed and all major indexing services • Maximum visibility for your research
Submit your manuscript at www.biomedcentral.com/submit