R E S E A R C H
Open Access
Analysis of epigenetic changes in survivors of
preterm birth reveals the effect of gestational age
and evidence for a long term legacy
Mark N Cruickshank
1,2,3, Alicia Oshlack
2,4, Christiane Theda
1,5,6, Peter G Davis
2,5,6, David Martino
7,
Penelope Sheehan
6, Yun Dai
1, Richard Saffery
2,7, Lex W Doyle
2,5,6and Jeffrey M Craig
1,2*Abstract
Background:Preterm birth confers a high risk of adverse long term health outcomes for survivors, yet the underlying molecular mechanisms are unclear. We hypothesized that effects of preterm birth can be mediated through measurable epigenomic changes throughout development. We therefore used a longitudinal birth cohort to measure the epigenetic mark of DNA methylation at birth and 18 years comparing survivors of extremely preterm birth with infants born at term. Methods:Using 12 extreme preterm birth cases and 12 matched, term controls, we extracted DNA from archived neonatal blood spots and blood collected in a similar way at 18 years of age. DNA methylation was measured at 347,789 autosomal locations throughout the genome using Infinium HM450 arrays. Representative methylation differences were confirmed by Sequenom MassArray EpiTYPER.
Results:At birth we found 1,555 sites with significant differences in methylation between term and preterm babies. At 18 years of age, these differences had largely resolved, suggesting that DNA methylation differences at birth are mainly driven by factors relating to gestational age, such as cell composition and/or maturity. Using matched longitudinal samples, we found evidence for an epigenetic legacy associated with preterm birth, identifying persistent methylation differences at ten genomic loci. Longitudinal comparisons of DNA methylation at birth and 18 years uncovered a significant overlap between sites that were differentially-methylated at birth and those that changed with age. However, we note that overlapping sites may either differ in the same (300/1,555) or opposite (431/1,555) direction during gestation and aging respectively.
Conclusions:We present evidence for widespread methylation differences between extreme preterm and term infants at birth that are largely resolved by 18 years of age. These results are consistent with methylation changes associated with blood cell development, cellular composition, immune induction and age at these time points. Finally, we identified ten probes significantly associated with preterm individuals and with greater than 5% methylation discordance at birth and 18 years that may reflect a long term epigenetic legacy of preterm birth.
Background
Preterm birth, defined as birth earlier than 37 weeks of gestation, is a major cause of neonatal death. Moreover, preterm birth imposes substantial health burdens on survivors; for example, children born preterm are four to five times more likely to develop brain and cardiovascular
disorders compared with infants born at term [1,2]. As a group, preterm survivors are at increased risk for chronic illnesses later in life relating to respiratory [3,4], visual [5], cardiovascular [6], hearing [7,8] and intellectual/ behavioral [9,10] impairment. The molecular mechanisms that might confer increased risk on these complex traits are incompletely understood.
Preterm birth imposes stress on infants due to premature removal from the intrauterine environment. Environmental factors relevant to preterm birth, such as nutrition, temperature change, toxins, and hypoxia/hyperoxia (that is, stressors) can alter gene expression in the short and/or
* Correspondence:[email protected]
1
Early Life Epigenetics Group, Murdoch Childrens Research Institute (MCRI), Royal Children’s Hospital, Flemington Road, Parkville, Victoria 3052, Australia 2
Department of Paediatrics, University of Melbourne, Royal Children’s Hospital, Flemington Road, Parkville, Victoria 3052, Australia Full list of author information is available at the end of the article
long term [11,12]. In mice, maternal nutritional status
in utero [13-15], or maternal care during post-natal development [16-18] are associated with stable epigenetic alterations in the offspring (such as DNA methylation and histone post-translational modifications) accompanied by metabolic or behavioral alterations. Other studies have shown that long-term effects of gestational hypoxia in a mouse model may be independent of lasting epigenetic alterations, but dependent on gene-environment inter-actions [19]. These persistent, environmentally induced phenotypic alterations have been attributed to aberrant organ development following transiently disrupted cell signaling [19]. Thus, mechanisms mediating long-term phenotypic variation in response to early environment remain controversial.
Genomic regions subject to DNA methylation change have been identified during gestation [20-22], neonatal development [23] and the entire lifespan [24-28]. The aim of this exploratory study was to assess genome-wide DNA methylation profiles of extremely preterm survivors com-pared with term controls at both birth and at 18 years of age, using a longitudinal case-control study design.
Methods Ethics approval
The study was approved by the Human Research Ethics Committees of the Royal Women’s Hospital and the Royal Children’s Hospital (Melbourne) and conformed to the Helsinki Declaration.
Subjects
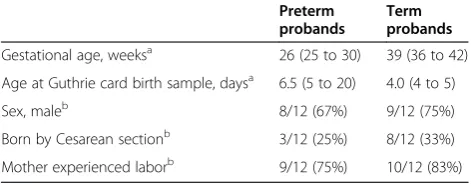
The subjects of this study were 12 preterm infants born at less than 31 weeks of gestational age and 12 term controls. All were born at the Royal Women’s Hospital, Melbourne in 1991 or 1992, and enrolled in a longitudinal study from birth. They were derived from a list of 18 pairs of subjects who consented (parents and subjects) to participate in the study and provide neonatal Guthrie cards (GCs) and 18-year dried blood spots. Subjects were matched for sex, ethnicity (all Caucasian), and singleton birth status. Gestational age (GA), sex, and delivery modes of subjects are shown in Table 1.
DNA extraction and bisulfite conversion from dried blood spots
Six to ten 3 mm punches taken from dried blood spots were placed in a 1.5 ml tube with 100 μl water with a single tungsten carbide bead (3 mm; catalog number 69997; Qiagen, Victoria, Australia). Samples were macer-ated with a TissueLyser II (Qiagen) (time: 5 × 30 seconds, frequency: 30 Hz). Beads were removed, and samples were further processed using the QIAamp DNA Mini Kit (Qiagen), in accordance with the manufacturer’s instruc-tions, but with the following modifications. The macerated sample was incubated with 190 μl of extraction buffer (ATL; SDS-containing proprietary formula extraction buffer; Qiagen) for 10 minutes at 85°C for 10 minutes. Supernatant was collected and the ATL extraction of the homogenate was repeated twice. The resulting extract was pooled and further processed by proteinase K digestion (60μl; 10 mg/ml at 56°C for 1 hour), then incubated with 600 μl buffer AL for 10 minutes at 70°C, followed by addition of 600 μl 100% ethanol. After mixing by inver-sion, samples were loaded onto a single QIAamp column by repeat centrifugation. Following washing, DNA was collected by incubating twice with 100 μl buffer AE (10 mM Tris-HCl, 0.5 mM EDTA, pH 9.0) for 10 minutes, and once with 50μl buffer AE for 10 minutes. The com-bined eluates were placed in a Speedvac at 45°C for 8 hours. The dry pellet was resuspended in 40 μl TE (10 mM Tris-HCl, 1 mM EDTA, pH 8.0) and quantified by spectrophotometry (Nanodrop, Wilmington, DE, USA) yielding a median of 1.7 μg DNA. Residual homogenates from a subset of samples were subjected to the same extraction process twice, yielding an additional 1.6 μg DNA. DNA samples (1μg) were bisulfite-converted using the MethylEasy Xceed bisulphite conversion kit (Human Genetic Signatures, North Ryde, Australia), in accordance with the manufacturer’s instructions. Conversion efficiency was confirmed by bisulfite-specific PCR [29].
Infinium methylation analysis
We used the Illumina Infinium HumanMethylation 450 (HM450) BeadChip platform, which interrogates more than 485,000 CpG dinucleotides, with probes targeted to CpG islands (CGIs), and their adjacent shores (2 kb regions flanking CGIs) and shelves (2 kb regions flanking shores); non-coding RNA; gene promoters, enhancers, and inter-genic regions; and regions associated with epigenetic repro-gramming of fibroblasts to inducible pluripotent stem cells (reprogramming-specific differentially methylated region; rDMR) [30,31]. Bisulfite treated DNA was hybridized to HM450 BeadArrays, with both birth and 18-year samples from three preterm and three term probands (total of twelve samples) selected per array in a scrambled order by ServiceXS (Amsterdam, The Netherlands).
Table 1 Demographic, clinical and sample characteristics of the study cohort
Preterm probands
Term probands
Gestational age, weeksa 26 (25 to 30) 39 (36 to 42)
Age at Guthrie card birth sample, daysa 6.5 (5 to 20) 4.0 (4 to 5)
Sex, maleb 8/12 (67%) 9/12 (75%)
Born by Cesarean sectionb 3/12 (25%) 8/12 (33%)
Mother experienced laborb 9/12 (75%) 10/12 (83%)
a
Median (range).
b
Raw intensity data (IDAT) files were imported into the R environment (version 2.14.1) [32] using theminfi package [33]. Data quality was assessed with plots derived from various control probes on the array. Probes from the X and Y chromosomes (n = 11,648) were removed. Probes were excluded if they failed in one or more samples based on a detection P-value of greater than 0.01 (n = 96,632). This method will remove any probes that might correspond to degraded regions of the genome from long-term stor-age of the samples at room temperature. One term birth sample with mean detection P> 0.05 was excluded from analysis. The data were pre-processed using the Illumina method (bg.correct =‘FALSE’, normalize =‘controls’) and subset-quantile within-array normalization (SWAN) was performed [34]. Probes targeting CpG dinucleotides con-taining a known single nucleotide polymorphism (SNP) and HM450 control probes were excluded from analyses (n = 23,365). The resulting dataset comprised 347,789 autosomal probes from 11 term and 12 preterm birth samples, and 12 term and preterm 18-year samples. The log2ratio of methylated probe intensity to unmethylated
probe intensity was calculated inminfi, denoted as M-values used for statistical analyses, and converted to β values ranging from 0 to 1 (0 to 100% methylation) [35,36]. The HM450 data are available from Gene Expression Omnibus (GEO) with an accession number of GSE51180.
Statistical analysis
The data underwent unsupervised hierarchical clustering analysis and multi-dimensional scaling (MDS) using lumi [35]. Heatmaps and dendrograms were drawn withgplots
[37]. Differential methylation analysis was performed on M-values using the limma package [38] setting the false discovery rate (FDR) cut-off point at less than 0.05 using the Benjamini-Hochberg procedure [39]. Correlation of methylation values at birth and 18 years across individuals was assessed using theduplicateCorrelationfunction [40]. For differential analysis, a linear model was fitted with age, case-control status (preterm or term), and predictive factors correcting for sex and array effects. Differentially methylated genes were determined if any probe associated with the gene was called‘differentially methylated’. Gene ontology enrichment was performed using the DAVID bioinformatics tool under the default settings [41,42] and pathway analysis using Ingenuity Pathways Analysis (IPA) software (Ingenuity Systems, Redwood City, CA, USA). Differentially methylated probes (DMPs) were classified as gene-related, CGI-related [43], DMRs [44], or regulatory regions (promoters, enhancers, and DNAse hypersensitivity sites). Enrichment and gene set tests were populated with probe IDs using annotations provided in the Illumina HM450 manifest (version 1.2). Gene lists were consolidated by replacing multiple isoforms (for example,Protocadherin
genes) with a single RefSeq entry, or including multiple
RefSeq entries associated with a single probe where bidir-ectional gene loci (for example,ABI3andGNGT2) or host gene/non-coding RNA genes (for example, ITPR1 and
EGOT) were identified. The limma function decideTests
was used to identify directional correlations (method = ‘sep-arate’; adjustment method =‘BH’; andP= 0.05) and visual-ized withheatDiagram. Genomic location enrichment was determined by calculating the ratios of observed/expected (O/E) probes in each category, and classified as over-represented (O/E ratio >1) or under-over-represented (O/E ratio <1), with significance assigned using hypergeometric means tests (statistics package:phyperfunction, one-sided lower tail for under-representation or one-sided upper tail for over-representation). Significance of birth/DMP and age/DMP overlap was assessed using Fisher’s exact test for count data (statistics package:fisher.test).
Sequenom MassArray target validation
Target validation was performed using the Sequenom MassArray EpiTYPER (Sequenom, San Diego, USA), performed as previously described [21,29]. Amplicons were designed using the Sequenom EpiDesigner [45] and MassArray [46], and testedin silico using methBlast [47] software. Oligonucleotide sequences were prepared (see Additional file 1: Table S1) such that forward primer sequences contain a 10 bp tag (AGGAAGAGAG) at their 5′ends, and reverse primer sequences contain a 31 bp tag (CAGTAATACGACTCACTATAGGGAGAAGGCT) at their 5′ ends. Amplification was performed using 1μl bisulfite-converted DNA with the FastStart kit (Roche, Mannheim, Germany) in 15 μl reactions with thermocy-cling conditions as follows: 94°C for 2 minutes; 5 cycles of 94°C for 30 seconds, 60°C for 30 seconds, and 72°C for 30 seconds; 35 cycles of 94°C for 30 seconds, 62°C for 30 seconds, and 72°C for 30 seconds; and final elongation at 72°C for 6 minutes. Data processing was carried out in triplicate using the median methylation level at specific CpG sites. Raw data obtained from MassArray EpiTYP-ING were cleaned systematically using an R-script to re-move samples that failed to generate data for more than 70% of the CpG sites tested. In addition, technical repli-cates showing 10% or greater absolute difference from the median value were removed, and only samples with at least two successful technical replicates were analyzed.
Results
An improved method of DNA extraction from Guthrie cards
3 mm blood spots. Greater amounts of DNA were recov-ered than previously reported [49-52], and were similar using blood spots stored desiccated at room temperature for 1 or 18 years (data not shown).
Exploratory analysis of components of epigenetic variation
The characteristics of our study cohort and sample collec-tion are summarized in Table 1. MDS identified age (birth versus 18 years) as the predominant source of variation within the dataset (see Additional file 2: Figure S1). We noted increased inter-individual variability between birth samples held in long-term storage (see Additional file 2: Figure S1; also data not shown). However, the similarity of β-value distributions of birth and 18-year samples (see Additional file 2: Figure S2) and the probe intensity of control probes (data not shown) indicated similar performance of these samples on the HM450 platform. To explore other components of variation, we tested asso-ciations of sex, delivery mode (spontaneous or iatrogenic; vaginal or lower uterine cesarean section; and labor or induced) and array. Sex and array were identified as significant factors, and were used as explanatory variables in linear models for subsequent analyses. Probes associ-ated with sex included several autosomal loci homologous to X or Y chromosomes (data not shown), probably reflecting cross-hybridization, as previously reported [53].
Identification of gestational age-associated differential methylation at birth
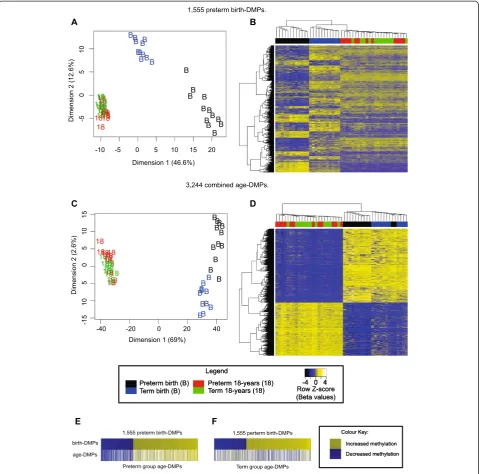
We tested for differential methylation between preterm and term birth samples and identified 1,555 DMPs (birth DMPs; FDR < 0.05) (Figure 1A,B; see Additional file 3: Table S2). Cross-platform validation was performed using Sequenom EipiTYPER assays targeting CpG sites near DMPs, because the methylation profiles of CpG sites in close proximity are highly correlated [54]. Specifically, we tested DNA methylation within the first intron of the
VWF gene as a representative enhancer site birth DMP, which is known to regulate gene expression [55] (two probes, Pearsonr2= 1.000,P< 0.012; r2= 0.954,P= 0.023 across all samples) (see Additional file 2: Figure S3). In agreement with two previous studies of DNA methylation associated with GA, we observed birth DMPs at gene loci encoding the transcription factor nuclear factor I/X (NFIX,[20]), oxytocin (OXT), and arginine vasopressin (AVP) [22].
Gene ontology classes associated with birth DMPs showed a bias towards biological processes involved in GTPase signaling (for example, PLEKHG5, RASA3, and
AGAP1), transcription (for example,LEF1,DNMT3A, and
NCOR2), embryonic morphogenesis for example,WNT3A,
NODAL, and SHANK3), cell growth and proliferation (for example,RUNX1,BMP1,andDOT1L), and nervous
system (for example, FGF1, GABBR1, and GDNF) and hematological (for example, AIRE, IL12A, and PBX1) development (see Additional file 4: Table S3; DAVID ontology). Pathway analysis showed over-representation of antigen presentation pathway genes (see Additional file 4: Table S3; IPA ‘Pathway’). Analysis of upstream regulators of genes associated with birth DMPs found a significant overlap with genes regulated by the transcrip-tion factor CREB1 and the Ca2+/calmodulin-dependent protein kinase complex, CaMKII (P< 10-4) (see Additional file 4: Table S3; IPA‘Upstream’).
Age-related changes in DNA methylation overlap with birth DMPs
We next sought to identify probes that differ between whole blood from infants and 18-year-olds. We compared all birth samples with all 18-year samples, independent of preterm status (birth, n = 23; 18 years, n = 24). Inter-estingly, we found no overall evidence for a correlation within individuals between the two time points (consensus correlation;r=−0.0343). We identified 116,603 age-associ-ated DMPs (‘age DMPs’, adjustedP< 0.05) including 3,244 probes with mean DNA methylation (β) change greater than 0.2 (Figure 1C,D; see Additional file 5: Table S4).
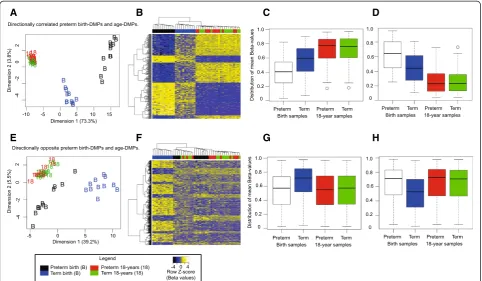
Because age DMPs clustered the birth samples according to preterm/term status (Figure 1C), we tested the hy-pothesis that epigenetic change is continuous from mid-gestation to 18 years of age; that is, that birth DMPs and age DMPs would share common probes. To account for methylation changes occurring during gestation, we performed analyses using birth and 18-year samples from the term group (birth, n = 11; 18 years, n = 12) and preterm group (birth, n = 12; 18 years, n = 12) separately. Comparing birth DMPs with age DMPs as defined from preterm subjects (n = 56,515 probes), we found a continuum of change comprising 934 of 1,555 (60%; P< 2.2 × 10⁻¹⁶, odds ratio (OR) = 7.76) sites of methylation difference that were also differentially methylated in the same direction by 18 years of age, and 34 of 1,555 (2%; P< 2.2 × 10⁻¹⁶, OR = 0.11) sites that had changed in the opposite direction by 18 years age (Figure 1E). By contrast, comparing birth DMPs with age DMPs defined from term subjects (n = 63,127), we identified 300 of 1,555 (19%;P< 2.2 × 10⁻¹⁶, OR = 1.08) probes that were directionally corre-lated, and 431 of 1,555 (28%; P< 2.2 × 10⁻¹⁶, OR = 1.73) probes that were differentially methylated in the opposite direction at 18 years (Figure 1F).
as a separate group in cluster analysis (Figure 2E,F) and in plots of the distribution of meanβ-values (Figure 2G,H).
We found that birth DMPs and age DMPs showed simi-lar ontology and pathway enrichments (see Additional
file 6: Table S5). These included GTPase signaling, tran-scription and embryonic morphogenesis, nervous system and hematological system development, and the antigen presentation pathway. Transcription factors were identified
Figure 1Preterm-associated differentially methylated probes (DMPs) at birth overlap with age-associated DMPs. (A)Multi-dimensional scaling (MDS) and(B)heatmap plots of 1,555 significant preterm birth DMPs (comparing preterm birth samples with term birth samples).(C)
MDS and(D)heatmap plots of 3,244 combined age DMPs withβ> 0.2 (comparing all birth samples with all samples obtained at 18 years).(E,F)
Heat diagrams displaying all birth DMPs (upper rows) with probes colored by the direction of methylation change from preterm to term, either increasing (yellow shading) or decreasing (blue shading). Comparison of overlap of birth DMPs and age DMPs determined using either(E)
as predominant upstream regulators of genes associated with age DMPs, with a significant overlap of genes reg-ulated by NLRC5, NKX2-3, and FOXC1 (P< 10-4) (see Additional file 6: Table S5). Upstream pathway analysis of genes that showed a continuum of methylation change from preterm birth to 18 years (directionally correlated probes) showed enrichment for genes regulated by the transcription factors NLRC5, CIITA, and PML (P< 10-4) (see Additional file 7: Table S6), whereas genes that showed methylation change in the opposing direction were over-represented by genes regulated by the transcription factors MTA1, JUN, and TP53 (P< 10-4) (see Additional file 8: Table S7).
To determine whether age DMPs and birth DMPs were enriched at similar genomic regions (for example, gene-associated regions, regions with proximity to CGI) or regulatory functions (for example, promoters, enhancers), we performed an enrichment analysis of birth DMPs with contextual data supplied with the HM450 arrays. Birth DMPs and age DMPs also showed similar genomic context biases (Figure 3A). We found that promoters (birth DMPs: 0.4-fold,P= 5.8 × 1041; age DMPs: 0.4-fold,P= 1.7 × 10-75) and CGIs (birth DMPs: 0.5-fold,P= 5.0 × 10-55; age DMPs:
0.5-fold, P= 1.2 × 10-97) were both under-represented. By contrast, enhancers were over-represented (birth DMPs: 1.7-fold,P= 5.6 × 10-37; age DMPs: 1.9-fold,P= 2.6 × 10-111), as to a lesser extent were gene bodies (birth DMPs: 1.2-fold, P= 1.2 × 10⁻⁶; age DMPs: 1.2-fold, P= 3.2 × 10⁻¹³). We also tested enrichment at rDMRs, and observed sig-nificant enrichment (birth DMPs: 2.3-fold,P= 4.0 × 10⁻¹²; age DMPs: 3.4-fold,P= 7.0 × 10-66).
To test if such concordance was related to probe vari-ability or potential statistical/array artifacts, we compared genomic context enrichment with two probe sets identi-fied using 18-year DNA methylation profiles. We used the top 1,500 most variable methylated probes (VMPs) across all 18-year samples and the top 1,500 probes ranked by odds of differential methylation, comparing 18-year DMPs for both preterm and term groups. We found that these sets of probes showed unique genomic context distributions compared with age DMPs and birth DMPs, suggesting a biological rather than tech-nical basis for genomic context profiles (Figure 3A,B). Notably, top-ranked 18-year DMPs showed the opposite genomic context profiles compared with birth DMPs and age DMPs.
A B C D
E F G H
Evidence for a long-term legacy of prematurity
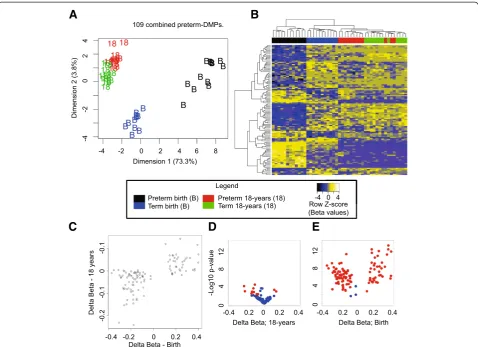
Testing for differential methylation between term and preterm individuals in 18 year samples failed to detect any significant probes after correction for multiple testing. To further examine the possibility of a persistent effect of preterm birth at both time points, we compared all preterm and term samples in the two groups (birth and 18-year samples combined for each group) and found 109 combined preterm DMPs at a genome-wide level of significance (adjusted P< 0.05) (see Additional file 9: Table S8). Using MDS and hierarchical clustering, we found that this probe set separated sample groups almost perfectly by age and preterm/term status (Figure 4A,B). Interestingly, eight of these probes were not called as significant using only the birth samples. Six of these eight probes showed a mean βdifference of greater than 0.1 between the preterm and term groups at both time points, and are located at thePCSK9,TRIM71,SLC44A4,
GPC6, and NFYA gene bodies and one intergenic site. Of the 109 combined preterm DMPs, 11 showed a mean difference ofβ> 0.05 at both time points (Figure 4C,D), including two intergenic probes targeting CpG sites
270 bp apart within a CGI shore and a site within the
TINAGL13′UTR. Intriguingly, the two intergenic persist-ent sites of methylation difference flank a binding site for the early growth response 1 (EGR1) transcription factor identified previously in erythroid cells (see Additional file 2: Figure S3) [56].
Sequenom EpiTYPER confirmed differential methylation of regions flanking the EGR1-binding site (P< 0.05) (see Additional file 2: Figure S4) and theTINAGLDMP (P< 0.05) (see Additional file 2: Figure S5). However, Sequenom did not detect significant differential methyla-tion at a putative persistent DMP located at theMAP3K8
gene (see Additional file 4: Table S3). We speculate that this may be due to the probe region containing two annotated deletion/insertion genetic variants of un-known allele frequency (rs67613960 and rs71525594) that may have confounded methylation measures [53,57]. Thus, among the 109 significant combined preterm DMPs, we found a total of 10 putative persistent preterm DMPs, defined as sites showing mean methylation dif-ference ofβ> 0.05 at both time points. Taken together, these results raise the possibility that a minority of
A
B
Figure 3Genomic and sequence context of differentially methylated probes (DMPs).Enrichment or depletion of DMPs displayed as the log10of the observed/expected frequencies for each category with significance from hypergeometric test results displayed as *P< 10
-5
, **P< 10-10, and ***P< 10-20.(A)Genomic enrichment distribution of 1,555 birth DMPs (black) and 3,244 age DMPs (white) showed similar profiles.
genomic regions carry a long-term epigenetic legacy of preterm birth.
Discussion
In this exploratory study, we examined DNA methylation profiles associated with very preterm birth (<31 weeks of gestation) using longitudinally collected blood sampled from newborns and 18-year-olds, both stored as dried blood spots. We identified methylation differences in birth samples at several gene loci previously reported to co-vary with gestational age. These results demonstrate the utility of archived birth blood spot DNA for methylation profiling, in accordance with other recent studies [48,49,52].
We found widespread differences in DNA methylation at birth in preterm infants compared to with term controls. In agreement with previous studies [23,28,58], our data revealed methylation changes in blood associated with age. Some of these methylation differences are likely to
reflect cell composition or functional differences in blood between preterm and term neonates, and between birth and at 18 years of age. For example, preterm-associated methylation differences at birth coincide with hematological changes that are correlated with gestational age, such as leukocyte [59,60] and nucleated reticulocyte [61] content. Further, gestational and age-related methylation changes may also reflect maturation of blood cells, including innate cytokine and adaptive immune induction [62-64]. Methyla-tion change driven by these effects is evidenced by over-representation of birth DMPs and age DMPs in gene networks involved in hematological system development (see Additional file 4: Table S3; see Additional file 6: Table S5; see Additional file 7: Table S6).
Blood cell composition is well established as a predictive factor for inter-individual methylation variation in whole blood [65,66]. However, this variable does not readily ex-plain the significant overlap in differentially methylated
A
B
C
D
E
Figure 4Differentially methylated probes (DMPs) associated with preterm birth identified using birth and 18-year blood spots. (A)
Multi-dimensional scaling (MDS) and(B)heatmap plots show 109 combined preterm DMPs (comparing preterm with term, combining birth and 18-year samples for both groups).(C)Scatterplot displaying mean methylation differences (δβ) of birth (x-axis) and 18-year (y-axis) samples. Volcano plots showingδβ(x-axis) versus nominalP-values (−log10scale) of combined preterm DMPs, with red points denoting probes with
CpGs between preterm and term subjects at birth and also between birth and 18 years of age. We found 159 sites that showed increased methylation and 141 that showed decreased methylation from preterm to term birth and subsequently up to adulthood, suggesting a continuum of methylation change from mid-gestation to young adulthood for some regions of the genome (Figure 2). Genes associated with these sites were over-represented by direct targets of the upstream transcription factors NLRC5 and CIITA, master regulators of the MHC I-dependent [67-69] and MHC II-dependent [70,71] immune responses, respectively. These observations are consistent with gestational and post-natal changes to the immune system, during which time MHC responses are initiated [72]. We also found that genes associated with a continuum of methylation change were over-represented in embry-onic development/morphogenesis and nervous system development, consistent with previous reports [73,74]. Teschendorff and co-workers have previously reported a correlation between age-associated loss of methylation and blood composition, but not with age-associated increases in methylation [58]. However, our data cannot disentangle cell-type effects. Other contributing factors may include developmental processes such as age-related changes to the progenitor cell pool [75-77], as suggested previously [28], or age-related shifts in blood cell signaling and metabolism [78].
We identified 431 CpG sites that changed in the opposite direction from preterm to term birth compared with birth to 18 years of age (Figure 2). Previous studies in human prefrontal cortex illustrate non-linear and directional changes in DNA methylation [27] and gene expression [79] during aging, suggesting that such changes are part of normal development. Our data defining CpG methylation sites that change direction during gestation and subsequently during post-natal life may reflect a distinctive methylation signature in the blood of term neonates. We speculate that these observations may reflect cell composition or functional differences in blood cells that are evidently unique to neonates born at full term [62,80,81].
We found very similar genomic contexts enriched in birth DMPs and age DMPs. Both showed over-represen-tation of rDMRs and under-represenover-represen-tation of CGIs and promoter regions. These results are consistent with findings from cross-sectional studies in adult mice [82] and humans [25,74], and with longitudinal studies of early post-natal life [23,83,84]. Taken together, these data indicate that similar regions of the genome are preferentially subject to epigenetic change during the second half of gestation, and during post-natal life in blood, and that these sites overlap rDMRs associated within vitropluripotency reprogram-ming. Although our genomic context enrichment data on differential methylation at 18 years used nominally
significant methylation differences, our results suggest that inter-individual differences in methylation are more likely to occur in regions of the genome not associated with aging. These findings also suggest that gestation-related and age-gestation-related changes are unlikely to relate to ‘epigenetic noise’[85]. However, we cannot determine if these observations reflect inter-individual blood com-position differences, inter-individual DNA methylation variation, or associations with preterm birth.
At 18 years of age, most methylation differences identi-fied in preterm babies are resolved, as evidenced by the lack of genome-wide significance in differential methylation at this time point. This is consistent with our conclusion that developmental changes and cell composition are the main components of methylation variation associated with birth DMPs and age DMPs. However, comparing preterm and term group analysis of birth and 18-year samples identified 109 statistically significant DMPs. Interestingly, eight of these CpG sites were not significantly differentially methylated at birth, suggesting that a larger sample size may indeed detect a long-term epigenetic legacy of pre-term birth at a single time point. We observed persistently altered CpG methylation at PCSK9,TRIM71, SLC44A4, GPC6, and NFYA gene loci and at two intergenic CpG sites flanking a binding site for the EGR1 transcription factor. Taken together, these observations raise the possi-bility that persistent DNA methylation differences reflect a long-term legacy of preterm birth.
Limitations of the study include confounding factors related to inter-individual variation in blood composition, which may restrict power to detect birth DMPs and age DMPs. Our exploratory study requires replication in a larger cohort. This is particularly important to confirm the persistent epigenetic legacy of preterm birth identified in this report. Use of term-equivalent samples from preterm subjects would be useful in this context. Furthermore, statistical methods for deconvoluting mixed cell types [66] or adjustment for age [86] have not been described in context of gestation or neonatal development. Therefore, further studies addressing methylation differences in sorted cells during gestation, at full-term birth, and later in life may provide empirical data necessary to account for these confounders, as suggested previously by Houseman and colleagues [87].
Conclusions
of change. Finally, we found a minority of genomic sites that show persistent methylation differences between terms and preterms at both time points. These results suggest that a significant, long-term legacy of preterm birth might be observed using a larger sample size. Further work is re-quired to examine if preterm birth-associated methylation differences co-vary with long-term health outcomes, early medical interventions, and/or genetic polymorphisms.
Additional files
Additional file 1: Table S1.Oligonucleotide sequences of bisulfite-specific PCR and Sequenom MassArray primers.
Additional file 2: Figure S1.Multi-dimensional scaling plot of sample relations based on all 347,789 probes. The relationship between DNA methylation of samples is shown with the four groups of samples color coded as follows: term birth, blue; preterm birth, black; term birth at 18 years, green; preterm at 18 years, red.Figure S2.DNA methylationβdensity plot of birth and 18-year longitudinal samples. Bimodal distribution of DNA methylationβ-values in birth and 18-year samples.Figure S3.Sequenom and Infinium HM450 comparison of birthdifferentially methylated probes (DMPs) targeting theVWFgene body enhancer.(A)Methylation data from HM450 probe targets (red) and nearest analysable Sequenom EpiTYPER CpG unit (blue) from a single amplicon encompassing both HM450 probe targets.(B)Partial Sequenom amplicon sequence annotation displayed with CpGs/CpG units highlighted in the same colors.Figure S4.
Genomic landmark and Sequenom analysis of long-term DMPs flanking tandem EGR1 consensus sites.(A)Methylation data from HM450 probe targets (red) and nearest analysable Sequenom EpiTYPER CpG unit (blue) from two separate amplicons each encompassing one HM450 probe target.
(B)Partial Sequenom amplicon sequence annotation displayed with CpGs/ CpG units from each amplicon highlighted in the same colors except for amplicon 7b CpG14 which is coincident with HM450 cg18598117.(C)
Location of Infinium HM450 probes in relation to genomic landmarks including EGR1 chromatin immunoprecipitation sequencing (ChIP-seq) data, RNA sequencing (RNA-seq) reads and DNA methylation from human frontal cortex specimens derived from the UCSC browser.Figure S5.
Sequenom analysis of long-term DMP atTINAGL13′UTR.(A)Methylation data from HM450 probe targets (red) and nearest analysable Sequenom EpiTYPER CpG unit (blue) from a Sequenom amplicon encompassing the target of probe cg06730678 (red).(B)Partial Sequenom amplicon sequence annotation displayed with CpGs/CpG units highlighted in the same colors.
Additional file 3: Table S2.Birth differentially methylated probes.
Additional file 4: Table S3.Gene ontologies from DAVID and Ingenuity Pathways Analysis (IPA) analysis using gene lists associated with birth differentially methylated probes (DMPs).
Additional file 5: Table S4.Birth to 18 years (age) differentially methylated probes withβ> 0.2.
Additional file 6: Table S5.Gene ontologies from DAVID and Ingenuity Pathways Analysis (IPA) analysis using gene lists associated with age differentially methylated probes (DMPs).
Additional file 7: Table S6.Gene ontologies from DAVID and Ingenuity Pathways Analysis (IPA) analysis using gene lists associated with directionally correlated birth and age differentially methylated probes (DMPs).
Additional file 8: Table S7.Gene ontologies from DAVID and Ingenuity Pathways Analysis (IPA) analysis using gene lists associated with directionally opposed birth and age differentially methylated probes (DMPs).
Additional file 9: Table S8.Combined preterm birth differentially methylated probes (DMPs): 109 significant combined preterm birth DMPs with adjustedP< 0.05 using birth and 18 year samples. False discovery rate (FDR)-adjusted and nominal birth and 18-yearP-values are shown.
Abbreviations
CGI:CpG island; DMP: Differentially methylated probe; DMR: Differentially methylated region; ES: Embryonic stem; FDR: False discovery rate; GA: Gestational age; GC: Guthrie card; GEO: Gene Expression Omnibus; IDAT: Intensity data; IPA: Ingenuity Pathways Analysis; MDS: Multi-dimensional scaling; O/E: Observed/expected; rDMR: Reprogramming-specific differentially methylated region; SNP: Single nucleotide polymorphism; SWAN: Subset-quantile within-array normalization; UTR: Untranslated region; VMP: Variable methylation probe.
Competing interests
The authors declare that they have no competing interests.
Authors’contributions
MNC, AO, CT, PGD, PS, RS, LWD, and JMC were responsible for study design. MNC performed sample preparation and data analysis, and drafted the manuscript. AO oversaw analysis and interpretation of data, and DM performed additional analysis. CT, PGD, PS and LWD provided interpretation in the context of obstetrics and neonatology. LWD provided funding. YD performed locus-specific methylation analysis. JMC assisted in drafting the manuscript. All authors critically revised the manuscript and have read and approved the manuscript for publication.
Acknowledgements
We thank Melissa Southey and Helen Tsimiklis, Department of Pathology, University of Melbourne, for advice on GC extraction and the use of their equipment. We thank Patrick Molloy for providing statistical methodology and analysis for differential variance, and Eric Joo, Lavinia Gordon, Peter Kay, and Ursula Kees for helpful discussions. This work was supported by the National Health and Medical Research Council (project grant 491246 to LWD, PJA, SJ Wood, C Robertson, S Hope, D Hacking, and J Cheong; Centre for Clinical Research Excellence 546519 to LWD; Senior Research Fellowship to RS), the MCRI (JMC and MNC), and the Victorian Government’s Operational Infrastructure Support Program.
Author details
1Early Life Epigenetics Group, Murdoch Childrens Research Institute (MCRI),
Royal Children’s Hospital, Flemington Road, Parkville, Victoria 3052, Australia. 2Department of Paediatrics, University of Melbourne, Royal Children’s
Hospital, Flemington Road, Parkville, Victoria 3052, Australia.3Present address: Telethon Institute for Child Health Research, University of Western Australia, 100 Roberts Road, Subiaco, WA 6008, Australia.4Bioinformatics Group, MCRI, Royal Children’s Hospital, Flemington Road, Parkville, Victoria 3052, Australia. 5Neonatal Services, Royal Women’s Hospital, Parkville, Victoria 3052, Australia. 6Department of Obstetrics and Gynaecology, University of Melbourne, Royal
Women’s Hospital, Parkville, Victoria 3052, Australia.7Cancer and Developmental Epigenetics Group, MCRI, Royal Children’s Hospital, Flemington Road, Parkville, Victoria 3052, Australia.
Received: 12 February 2013 Accepted: 26 September 2013 Published: 18 October 2013
References
1. Aylward GP:Methodological issues in outcome studies of at-risk infants.
J Pediatr Psychol2002,27:37–45.
2. Behrman RE, Butler AC:Preterm Birth: Causes, Consequences and Prevention.
Washington DC: The National Academies Press; 2007.
3. Kwinta P, Pietrzyk JJ:Preterm birth and respiratory disease in later life.
Expert Rev Respir Med2010,4:593–604.
4. Hille ET, Weisglas-Kuperus N, van Goudoever JB, Jacobusse GW, Ens-Dokkum MH, de Groot L, Wit JM, Geven WB, Kok JH, de Kleine MJ,et al:Functional outcomes and participation in young adulthood for very preterm and very low birth weight infants: the Dutch Project on Preterm and Small for Gestational Age Infants at 19 years of age.Pediatrics2007,120:e587–e595. 5. Geldof CJ, van Wassenaer AG, de Kieviet JF, Kok JH, Oosterlaan J:Visual
perception and visual-motor integration in very preterm and/or very low birth weight children: a meta-analysis.Res Dev Disabil2012,33:726–736. 6. Kerkhof GF, Breukhoven PE, Leunissen RW, Willemsen RH, Hokken-Koelega AC:Does Preterm Birth Influence Cardiovascular Risk in Early Adulthood?
7. Amatuzzi M, Liberman MC, Northrop C:Selective inner hair cell loss in prematurity: a temporal bone study of infants from a neonatal intensive care unit.J Assoc Res Otolaryngol2011,12:595–604.
8. McMahon E, Wintermark P, Lahav A:Auditory brain development in premature infants: the importance of early experience.Ann N Y Acad Sci
2012,1252:17–24.
9. Jongbloed-Pereboom M, Janssen AJ, Steenbergen B, Nijhuis-van der Sanden MW:Motor learning and working memory in children born preterm: a systematic review.Neurosci Biobehav Rev2012,36:1314–1330.
10. Aarnoudse-Moens CS, Weisglas-Kuperus N, van Goudoever JB, Oosterlaan J:
Meta-analysis of neurobehavioral outcomes in very preterm and/or very low birth weight children.Pediatrics2009,124:717–728.
11. Feil R, Fraga MF:Epigenetics and the environment: emerging patterns and implications.Nat Rev Genet2011,13:97–109.
12. Jaenisch R, Bird A:Epigenetic regulation of gene expression: how the genome integrates intrinsic and environmental signals.Nature Genet
2003,33:245–254.
13. Cropley JE, Suter CM, Beckman KB, Martin DI:Germ-line epigenetic modification of the murine A vy allele by nutritional supplementation.
Proc Natl Acad Sci USA2006,103:17308–17312.
14. Dolinoy DC:The agouti mouse model: an epigenetic biosensor for nutritional and environmental alterations on the fetal epigenome.
Nutr Rev2008,66:S7–S11.
15. Li CC, Cropley JE, Cowley MJ, Preiss T, Martin DI, Suter CM:A sustained dietary change increases epigenetic variation in isogenic mice.PLoS Genet2011,7:e1001380.
16. Weaver IC, Cervoni N, Champagne FA, D'Alessio AC, Sharma S, Seckl JR, Dymov S, Szyf M, Meaney MJ:Epigenetic programming by maternal behavior.Nat Neurosci2004,7:847–854.
17. Murgatroyd C, Patchev AV, Wu Y, Micale V, Bockmuhl Y, Fischer D, Holsboer F, Wotjak CT, Almeida OF, Spengler D:Dynamic DNA methylation programs persistent adverse effects of early-life stress.Nat Neurosci2009,
12:1559–1566.
18. Zhang TY, Labonte B, Wen XL, Turecki G, Meaney MJ:Epigenetic Mechanisms for the Early Environmental Regulation of Hippocampal Glucocorticoid Receptor Gene Expression in Rodents and Humans.
Neuropsychopharmacol2012,38:111–123.
19. Sparrow DB, Chapman G, Smith AJ, Mattar MZ, Major JA, O'Reilly VC, Saga Y, Zackai EH, Dormans JP, Alman BA,et al:A mechanism for gene-environment interaction in the etiology of congenital scoliosis.Cell2012,149:295–306. 20. Lee H, Jaffe AE, Feinberg JI, Tryggvadottir R, Brown S, Montano C, Aryee MJ,
Irizarry RA, Herbstman J, Witter FR,et al:DNA methylation shows genome-wide association of NFIX, RAPGEF2 and MSRB3 with gestational age at birth.Int J Epidemiol2012,41:188–199. 21. Novakovic B, Yuen RK, Gordon L, Penaherrera MS, Sharkey A, Moffett A,
Craig JM, Robinson WP, Saffery R:Evidence for widespread changes in promoter methylation profile in human placenta in response to increasing gestational age and environmental/stochastic factors.
BMC Genomics2011,12:529.
22. Schroeder JW, Conneely KN, Cubells JC, Kilaru V, Newport DJ, Knight BT, Stowe ZN, Brennan PA, Krushkal J, Tylavsky FA,et al:Neonatal DNA methylation patterns associate with gestational age.Epigenetics2011,
6:1498–1504.
23. Martino D, Maksimovic J, Joo JH, Prescott SL, Saffery R:Genome-scale profiling reveals a subset of genes regulated by DNA methylation that program somatic T-cell phenotypes in humans.Genes Immun2012,
13:388–398.
24. Christensen BC, Houseman EA, Marsit CJ, Zheng S, Wrensch MR, Wiemels JL, Nelson HH, Karagas MR, Padbury JF, Bueno R,et al:Aging and
environmental exposures alter tissue-specific DNA methylation dependent upon CpG island context.PLoS Genet2009,5:e1000602. 25. Heyn H, Li N, Ferreira HJ, Moran S, Pisano DG, Gomez A, Diez J,
Sanchez-Mut JV, Setien F, Carmona FJ,et al:Distinct DNA methylomes of newborns and centenarians.Proc Natl Acad Sci USA2012,109:10522–10527. 26. Meissner A, Mikkelsen TS, Gu H, Wernig M, Hanna J, Sivachenko A, Zhang X,
Bernstein BE, Nusbaum C, Jaffe DB,et al:Genome-scale DNA methylation maps of pluripotent and differentiated cells.Nature2008,454:766–770. 27. Numata S, Ye T, Hyde TM, Guitart-Navarro X, Tao R, Wininger M, Colantuoni
C, Weinberger DR, Kleinman JE, Lipska BK:DNA methylation signatures in development and aging of the human prefrontal cortex.Am J Hum Genet
2012,90:260–272.
28. Rakyan VK, Down TA, Maslau S, Andrew T, Yang TP, Beyan H, Whittaker P, McCann OT, Finer S, Valdes AM,et al:Human aging-associated DNA hyper-methylation occurs preferentially at bivalent chromatin domains.
Genome Res2010,20:434–439.
29. Ollikainen M, Smith KR, Joo EJ, Ng HK, Andronikos R, Novakovic B, Abdul Aziz NK, Carlin JB, Morley R, Saffery R, Craig JM:DNA methylation analysis of multiple tissues from newborn twins reveals both genetic and intrauterine components to variation in the human neonatal epigenome.Hum Mol Genet2010,19:4176–4188.
30. Bibikova M, Barnes B, Tsan C, Ho V, Klotzle B, Le JM, Delano D, Zhang L, Schroth GP, Gunderson KL,et al:High density DNA methylation array with single CpG site resolution.Genomics2011,98:288–295.
31. Sandoval J, Heyn H, Moran S, Serra-Musach J, Pujana MA, Bibikova M, Esteller M:Validation of a DNA methylation microarray for 450,000 CpG sites in the human genome.Epigenetics2011,6:692–702.
32. R_Development_Core_Team:R: A Language and Environment for Statistical Computing.Vienna, Austria: R Foundation for Statistical Computing; 2009.
33. Hansen KD, Aryee MJ:minfi: Analyze Illumina's 450k methylation arrays.
2012, [http://bioconductor.org/packages/release/bioc/html/minfi.html] 34. Maksimovic J, Gordon L, Oshlack A:SWAN: Subset quantile Within-Array
Normalization for Illumina Infinium HumanMethylation450 BeadChips.
Genome Biol2012,13:R44.
35. Du P, Kibbe WA, Lin SM:lumi: a pipeline for processing Illumina microarray.Bioinformatics2008,24:1547–1548.
36. Du P, Zhang X, Huang CC, Jafari N, Kibbe WA, Hou L, Lin SM:Comparison of Beta-value and M-value methods for quantifying methylation levels by microarray analysis.BMC Bioinformatics2011,11:587.
37. Docherty SJ, Davis OS, Haworth CM, Plomin R, Mill J:DNA methylation profiling using bisulfite-based epityping of pooled genomic DNA.
Methods2010,52:255–258.
38. Smyth GK:Limma: linear models for microarray data.InBioinformatics and Computational Biology Solutions using R and Bioconductor.Edited by Gentleman R, Carey V, Dudoit S, Huber W, Irizarry R. New York: Springer; 2005:397–420.
39. Benjamini Y, Hochberg Y:Controlling the false discovery rate: a practical and powerful approach to multiple testing.J R Stat Soc1995,57:289–300. 40. Smyth GK, Michaud J, Scott HS:Use of within-array replicate spots for
assessing differential expression in microarray experiments.Bioinformatics
2005,21:2067–2075.
41. da Huang W, Sherman BT, Lempicki RA:Systematic and integrative analysis of large gene lists using DAVID bioinformatics resources.
Nat Protoc2009,4:44–57.
42. da Huang W, Sherman BT, Lempicki RA:Bioinformatics enrichment tools: paths toward the comprehensive functional analysis of large gene lists.
Nucleic Acids Res2009,37:1–13.
43. Irizarry RA, Ladd-Acosta C, Wen B, Wu Z, Montano C, Onyango P, Cui H, Gabo K, Rongione M, Webster M,et al:The human colon cancer methy-lome shows similar hypo- and hypermethylation at conserved tissue-specific CpG island shores.Nat Genet2009,41:178–186.
44. Doi A, Park IH, Wen B, Murakami P, Aryee MJ, Irizarry R, Herb B, Ladd-Acosta C, Rho J, Loewer S,et al:Differential methylation of tissue- and cancer-specific CpG island shores distinguishes human induced pluripotent stem cells, embryonic stem cells and fibroblasts.Nat Genet2009,
41:1350–1353.
45. SEQUENOM Inc:SEQUENOM EpiDesigner beta.[http://www.epidesigner.com/] 46. Thompson RF, Suzuki M, Lau KW, Greally JM:A pipeline for the
quantitative analysis of CG dinucleotide methylation using mass spectrometry.Bioinformatics2009,25:2164–2170.
47. Pattyn F, Hoebeeck J, Robbrecht P, Michels E, De Paepe A, Bottu G, Coornaert D, Herzog R, Speleman F, Vandesompele J:methBLAST and methPrimerDB: web-tools for PCR based methylation analysis.BMC Bioinformatics2006,7:496.
48. Joo JE, Wong EM, Baglietto L, Jung CH, Tsimiklis H, Park DJ, Wong NC, English DR, Hopper JL, Severi G,et al:The use of DNA from archival dried blood spots with the Infinium HumanMethylation450 array.BMC Biotechnol2013,13:23.
50. Hardin J, Finnell RH, Wong D, Hogan ME, Horovitz J, Shu J, Shaw GM:
Whole genome microarray analysis, from neonatal blood cards.
BMC Genet2009,10:38.
51. Wong N, Morley R, Saffery R, Craig J:Archived Guthrie blood spots as a novel source for quantitative DNA methylation analysis.Biotechniques
2008,45:423–424. 426, 428 passim.
52. Aberg KA, Xie LY, Nerella S, Copeland WE, Costello EJ, van den Oord EJ:
High quality methylome-wide investigations through next-generation sequencing of DNA from a single archived dry blood spot.Epigenetics
2013,8:542–547.
53. Chen YA, Lemire M, Choufani S, Butcher DT, Grafodatskaya D, Zanke BW, Gallinger S, Hudson TJ, Weksberg R:Discovery of cross-reactive probes and polymorphic CpGs in the Illumina Infinium HumanMethylation450 microarray.Epigenetics2013,8:203–209.
54. Koestler DC, Christensen BC, Marsit CJ, Kelsey KT, Houseman EA:Recursively partitioned mixture model clustering of DNA methylation data using biologically informed correlation structures.Stat Appl Genet Mol Biol2013,
12:225–240.
55. Yuan L, Janes L, Beeler D, Spokes KC, Smith J, Li D, Jaminet SC, Oettgen P, Aird WC:Role of RNA splicing in mediating lineage-specific expression of the von Willebrand factor gene in the endothelium.Blood2013,
121:4404–4412.
56. Rosenbloom KR, Dreszer TR, Long JC, Malladi VS, Sloan CA, Raney BJ, Cline MS, Karolchik D, Barber GP, Clawson H,et al:ENCODE whole-genome data in the UCSC Genome Browser: update 2012.Nucleic Acids Res2012,
40:D912–917.
57. Chen YA, Choufani S, Ferreira JC, Grafodatskaya D, Butcher DT, Weksberg R:
Sequence overlap between autosomal and sex-linked probes on the Illumina HumanMethylation27 microarray.Genomics2011,97:214–222. 58. Teschendorff AE, Menon U, Gentry-Maharaj A, Ramus SJ, Weisenberger DJ,
Shen H, Campan M, Noushmehr H, Bell CG, Maxwell AP,et al:Age-dependent DNA methylation of genes that are suppressed in stem cells is a hallmark of cancer.Genome Res2010,20:440–446.
59. Correa-Rocha R, Perez A, Lorente R, Ferrando-Martinez S, Leal M, Gurbindo D, Munoz-Fernandez MA:Preterm neonates show marked leukopenia and lymphopenia that are associated with increased regulatory T-cell values and diminished IL-7.Pediatr Res2012,71:590–597.
60. Walker JC, Smolders MA, Gemen EF, Antonius TA, Leuvenink J, de Vries E:
Development of lymphocyte subpopulations in preterm infants.
Scand J Immunol2011,73:53–58.
61. Maconi M, Formisano D, Cavalca L, Rolfo A, Cardaropoli S, Danise P:
Reticulocyte count and reticulocyte maturation profile in human umbilical cord blood from healthy newborns.Lab Hematol2010,16:3–7. 62. Adkins B, Leclerc C, Marshall-Clarke S:Neonatal adaptive immunity comes
of age.Nat Rev Immunol2004,4:553–564.
63. Sharma AA, Jen R, Butler A, Lavoie PM:The developing human preterm neonatal immune system: a case for more research in this area.
Clin Immunol2012,145:61–68.
64. Strunk T, Richmond P, Simmer K, Currie A, Levy O, Burgner D:Neonatal immune responses to coagulase-negative staphylococci.Curr Opin Infect Dis2007,20:370–375.
65. Lam LL, Emberly E, Fraser HB, Neumann SM, Chen E, Miller GE, Kobor MS:
Factors underlying variable DNA methylation in a human community cohort.Proc Natl Acad Sci USA2012,109:17253–17260.
66. Koestler DC, Christensen B, Karagas MR, Marsit CJ, Langevin SM, Kelsey KT, Wiencke JK, Houseman EA:Blood-based profiles of DNA methylation predict the underlying distribution of cell types: a validation analysis.
Epigenetics2013,8:816–826.
67. Kobayashi KS, van den Elsen PJ:NLRC5: a key regulator of MHC class I-dependent immune responses.Nat Rev Immunol2012,12:813–820. 68. Neerincx A, Rodriguez GM, Steimle V, Kufer TA:NLRC5 controls basal MHC
class I gene expression in an MHC enhanceosome-dependent manner.
J Immunol2012,188:4940–4950.
69. Meissner TB, Li A, Biswas A, Lee KH, Liu YJ, Bayir E, Iliopoulos D, van den Elsen PJ, Kobayashi KS:NLR family member NLRC5 is a transcriptional regulator of MHC class I genes.Proc Natl Acad Sci USA2010,107:13794–13799. 70. Ni Z, Abou El Hassan M, Xu Z, Yu T, Bremner R:The chromatin-remodeling
enzyme BRG1 coordinates CIITA induction through many interdependent distal enhancers.Nat Immunol2008,9:785–793.
71. Wright KL, Ting JP:Epigenetic regulation of MHC-II and CIITA genes.
Trends Immunol2006,27:405–412.
72. Mehta NT, Truax AD, Boyd NH, Greer SF:Early epigenetic events regulate the adaptive immune response gene CIITA.Epigenetics2011,6:516–525. 73. Horvath S, Zhang Y, Langfelder P, Kahn RS, Boks MP, van Eijk K, van den
Berg LH, Ophoff RA:Aging effects on DNA methylation modules in human brain and blood tissue.Genome Biol2012,13:R97.
74. Yuen RK, Neumann SM, Fok AK, Penaherrera MS, McFadden DE, Robinson WP, Kobor MS:Extensive epigenetic reprogramming in human somatic tissues between fetus and adult.Epigenetics Chromatin2011,4:7. 75. Catlin SN, Busque L, Gale RE, Guttorp P, Abkowitz JL:The replication rate of
human hematopoietic stem cells in vivo.Blood2011,117:4460–4466. 76. Beerman I, Bhattacharya D, Zandi S, Sigvardsson M, Weissman IL, Bryder D,
Rossi DJ:Functionally distinct hematopoietic stem cells modulate hematopoietic lineage potential during aging by a mechanism of clonal expansion.Proc Natl Acad Sci USA2010,107:5465–5470.
77. Cho RH, Sieburg HB, Muller-Sieburg CE:A new mechanism for the aging of hematopoietic stem cells: aging changes the clonal composition of the stem cell compartment but not individual stem cells.Blood2008,
111(12):5553–5561.
78. Pucciarelli S, Moreschini B, Micozzi D, De Fronzo GS, Carpi FM, Polzonetti V, Vincenzetti S, Mignini F, Napolioni V:Spermidine and spermine are enriched in whole blood of nona/centenarians.Rejuvenation Res2012,
15:590–595.
79. Somel M, Guo S, Fu N, Yan Z, Hu HY, Xu Y, Yuan Y, Ning Z, Hu Y, Menzel C,
et al:MicroRNA, mRNA, and protein expression link development and aging in human and macaque brain.Genome Res2010,20:1207–1218. 80. Cuenca AG, Wynn JL, Moldawer LL, Levy O:Role of innate immunity in
neonatal infection.Am J Perinatol2013,30:105–112.
81. Levy O:Innate immunity of the newborn: basic mechanisms and clinical correlates.Nat Rev Immunol2007,7:379–390.
82. Maegawa S, Hinkal G, Kim HS, Shen L, Zhang L, Zhang J, Zhang N, Liang S, Donehower LA, Issa JP:Widespread and tissue specific age-related DNA methylation changes in mice.Genome Res2011,20:332–340.
83. Martino D, Loke YJ, Gordon L, Ollikainen M, Cruickshank MN, Saffery R, Craig JM:Longitudinal, genome-scale analysis of DNA methylation in twins from birth to 18 months of age reveals rapid epigenetic change in early life and pair-specific effects of discordance.Genome Biol2013,14:R42. 84. Martino DJ, Tulic MK, Gordon L, Hodder M, Richman T, Metcalfe J, Prescott
SL, Saffery R:Evidence for age-related and individual-specific changes in DNA methylation profile of mononuclear cells during early immune development in humans.Epigenetics2011,6:1085–1094.
85. Pujadas E, Feinberg AP:Regulated noise in the epigenetic landscape of development and disease.Cell2012,148:1123–1131.
86. Chen Z, Liu Q, Nadarajah S:A new statistical approach to detecting differentially methylated loci for case control Illumina array methylation data.Bioinformatics2012,28:1109–1113.
87. Houseman EA, Accomando WP, Koestler DC, Christensen BC, Marsit CJ, Nelson HH, Wiencke JK, Kelsey KT:DNA methylation arrays as surrogate measures of cell mixture distribution.BMC Bioinformatics2012,13:86.
doi:10.1186/gm500
Cite this article as:Cruickshanket al.:Analysis of epigenetic changes in survivors of preterm birth reveals the effect of gestational age and evidence for a long term legacy.Genome Medicine20135:96.
Submit your next manuscript to BioMed Central and take full advantage of:
• Convenient online submission
• Thorough peer review
• No space constraints or color figure charges
• Immediate publication on acceptance
• Inclusion in PubMed, CAS, Scopus and Google Scholar
• Research which is freely available for redistribution