R E S E A R C H
Open Access
Identifying gene-gene interactions that are
highly associated with Body Mass Index
using Quantitative Multifactor
Dimensionality Reduction (QMDR)
Rishika De
1, Shefali S. Verma
2, Fotios Drenos
3, Emily R. Holzinger
2, Michael V. Holmes
4, Molly A. Hall
2,
David R. Crosslin
5, David S. Carrell
6, Hakon Hakonarson
7, Gail Jarvik
5,8, Eric Larson
6, Jennifer A. Pacheco
9,
Laura J. Rasmussen-Torvik
10, Carrie B. Moore
2,11, Folkert W. Asselbergs
12,13,14, Jason H. Moore
15, Marylyn D. Ritchie
2*,
Brendan J. Keating
7,16*and Diane Gilbert-Diamond
17,18** Correspondence:
[email protected];bkeating@mail. med.upenn.edu; [email protected] 2Center for Systems Genomics, Department of Biochemistry and Molecular Biology, 512 Wartik Laboratory, The Pennsylvania State University, University Park, PA 16802, USA
7The Joseph Stokes Jr. Research Institute, The Children’s Hospital of Philadelphia, Office 1016 Abramson Building, Room 1216E, 3615 Civic Center Blvd, Philadelphia, PA 19104, USA
17Institute for Quantitative Biomedical Sciences at Dartmouth, Hanover, NH, USA
Full list of author information is available at the end of the article
Abstract
Background:Despite heritability estimates of 40–70 % for obesity, less than 2 % of its variation is explained by Body Mass Index (BMI) associated loci that have been identified so far.Epistasis, or gene-gene interactions are a plausible source to explain portions of the missing heritability of BMI.
Methods:Using genotypic data from 18,686 individuals across five study cohorts– ARIC, CARDIA, FHS, CHS, MESA–we filtered SNPs (Single Nucleotide Polymorphisms) using two parallel approaches. SNPs were filtered either on the strength of their main effects of association with BMI, or on the number of knowledge sources supporting a specific SNP-SNP interaction in the context of BMI. Filtered SNPs were specifically analyzed for interactions that are highly associated with BMI using QMDR (Quantitative Multifactor Dimensionality Reduction). QMDR is a nonparametric, genetic model-free method that detects non-linear interactions associated with a quantitative trait.
Results:We identified seven novel, epistatic models with a Bonferroni corrected p-value of association < 0.1. Prior experimental evidence helps explain the plausible biological interactions highlighted within our results and their relationship with obesity. We identified interactions between genes involved in mitochondrial
dysfunction (POLG2), cholesterol metabolism (SOAT2), lipid metabolism (CYP11B2), cell adhesion (EZR), cell proliferation (MAP2K5),and insulin resistance (IGF1R). Moreover, we found an 8.8 % increase in the variance in BMI explained by these seven SNP-SNP interactions, beyond what is explained by the main effects of an indexFTOSNP and the SNPs within these interactions. We also replicated one of these interactions and 58 proxy SNP-SNP models representing it in an independent dataset from the eMERGE study.
Conclusion:This study highlights a novel approach for discovering gene-gene interactions by combining methods such as QMDR with traditional statistics.
Keywords:Obesity, Epistasis, Gene-gene interaction, Multifactor dimensionality reduction, GWAS
© 2015 De et al.Open AccessThis article is distributed under the terms of the Creative Commons Attribution 4.0 International License (http://creativecommons.org/licenses/by/4.0/), which permits unrestricted use, distribution, and reproduction in any medium, provided you give appropriate credit to the original author(s) and the source, provide a link to the Creative Commons license, and indicate if changes were made. The Creative Commons Public Domain Dedication waiver (http://creativecommons.org/ publicdomain/zero/1.0/) applies to the data made available in this article, unless otherwise stated.
Background
Obesity is a major risk factor for various diseases such as - heart disease, type 2 diabetes and even certain types of cancer [1, 2]. Approximately, one-third of the adult population in the U.S. is categorized to be obese [3]. Globally, obesity has the potential to affect 1.12 billion individuals by 2030 [4]. In the U.S. alone, the economic burden associated with obesity has been estimated to be around $147 billion/year in healthcare costs and loss of productivity of affected individuals [5]. Moreover, obesity no longer affects only industrialized nations, but it is also making its mark in developing nations, especially among children [3, 6].
Although the current epidemic proportions of obesity can be largely attributed to our lifestyle and food choices, there is also a strong genetic component of obesity. Twin and adoption studies have provided heritability estimates of 40–70 % for obesity [7, 8]. Such studies have also found that obesity tends to cluster within families, and that monozygotic twins show greater concordance in Body Mass Index (BMI) and adiposity metrics versus dizygotic twins. Technological advancements in genomics and highly characterized genome-wide reference maps in major populations allow researchers to query a million or more genetic variants by designing genome-wide association studies (GWAS), [9–11] and so far, researchers have identified BMI-related signals in 32 loci that are associated with the trait at a genome-wide level [1]. However, these primary associa-tions have been able to explain only about 2 % of the variation observed in BMI [1].
The limited success of GWAS has often been attributed to the linear framework employed by these studies. Although, single locus analysis strategies have had success in certain diseases such as age-related macular degeneration and breast cancer [12–15], many complex diseases are likely the result of interactions between genetic loci–epistasis
[9, 11, 16]. The ubiquitous nature of epistasis has been discussed previously, and it has highlighted the importance of designing our studies to embrace the genomic and environ-mental context of Single Nucleotide Polymorphisms (SNPs), by specifically searching for non-linear interactions between genetic loci [17, 18].
In this study we aimed to identify interactions between SNPs that are associated with BMI using data from 18,686 individuals across five highly characterized National Heart, Lung and Blood Institute (NHLBI) study cohorts. Individuals were genotyped using the gene-centric ITMAT-Broad-CARe (IBC) array containing approximately 50,000 SNPs.
Methods Participants
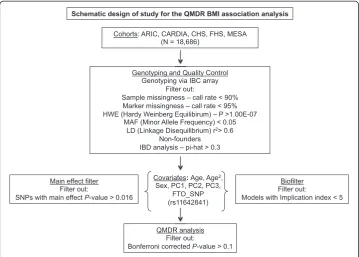
Figure 1 illustrates the overall study design. Genotype and phenotype information were initially combined for a total of 18,686 individuals of European descent from the follow-ing studies: Atherosclerosis Risk in Communities (ARIC) [19]; Coronary Artery Risk Development in Young Adults (CARDIA) [20]; Cardiovascular Health Study (CHS) [21]; Framingham Heart Study (FHS) [22]; and Multi-Ethnic Study of Atherosclerosis (MESA) [23] (Additional file 1: Table S1).
Genotyping and quality control
cardiovascular, metabolic and inflammatory phenotypes [24]. The array contains 47,451 SNPs. Samples with a call rate less than 90 % were excluded. Additionally, SNPs with a call rate less than 95 %, with an exact test of Hardy-Weinberg equilibrium p-value greater than 1.00E–07 or a minor allele frequency (MAF) < 0.05 were also excluded. SNPs were further tested for linkage disequilibrium (LD) – a SNP was removed from each pair of SNPs that had an LD (r2)≥0.6. This reduced our dataset to 17,268 individ-uals and 28,453 SNPs. Non-founder individindivid-uals were also removed from the study population. To check for relatedness between individuals, markers were used for an Identity-by-descent (IBD) analysis using PLINK [25]. For pairs of individuals with a pi-hat (π^) value greater than 0.3, one individual was removed. Complete phenotype data was also required for inclusion of an individual in the analysis. This resulted in a final dataset of 15,737 individuals and 28,453 SNPs. To decrease both the computation time and the multiple testing burden two filtering strategies were employed [26]. These are described in more detail below.
Marker selection
Main effect filter
As an additional filtering step, SNPs were tested for their independent association with the continuous BMI outcome using linear regression. Upon visual inspection of the distribution ofP-values, a cut-off value ofP< 0.016 was chosen, as there was a distinct separation between SNPs exhibiting a stronger main effect and the rest of the SNPs at this cut-off. This resulted in a final list of 498 markers for further analysis [27].
Fig. 1Schematic design of the QMDR (Quantitative Multifactor Dimensionality Reduction) analysis for identifying SNP-SNP interaction models associated with BMI. Genotyping was performed using the IBC (ITMAT-Broad-CARe) array. The workflow also includes the initial quality control procedures, subsequent association analyses, and covariate adjustment steps performed
Biofilter
As a parallel filtering procedure, SNPs were also analyzed using Biofilter [28]. Biofilter is a knowledge-based approach that enables the analysis of multi-SNP interactions in a large dataset. The software identifies multi-SNP models that exhibit marginal effects on a phenotype, but are also biologically plausible. It combines information from multiple public knowledge sources such as Gene Ontology (GO), Kyoto Encyclopedia of Genes and Genomes (KEGG), Database of Interacting Proteins (DIP) and the Protein Families Database (Pfam) [29]. These sources provide information regarding pairs of genes that may be putative sources of epistasis and relate genes to one another through their mutual participation in biological processes, signaling pathways, protein-protein inter-actions as well as via the structural similarity between protein motifs. Biofilter measures the strength of the knowledge-based support for a given multi-SNP model with an implication index. The implication index is the sum of the number of supporting data sources for each of the genes in a given gene-gene relationship. For our analysis, models with an implication index of five or greater were retained, result-ing in a list of 1815 markers (22,644 SNP-SNP models). The selected implication index cut-off was slightly more stringent than those used in previous studies [30].
Statistical analyses
Covariate adjustment
Baseline BMI values were regressed on age, age2, sex, the first three principal components of race computed using EIGENSTRAT software [31] and the index SNP rs11642841 in the FTO region. SNPs in the FTOlocus are some of the strongest genetic associations identified for obesity risk [32]. Hence, adjustments were made for a SNP in theFTOlocus to increase our ability to identify SNP-SNP models that were not primarily driven by the strong main effect of this gene. The residual BMIs from this regression model were then used as the continuous outcome variable in the QMDR analysis.
Association analysis–QMDR
SNPs obtained from the two parallel filtering procedures described above, were tested for association with the continuous BMI outcome using Quantitative Multifactor Dimensionality Reduction (QMDR) [33]. QMDR is an extension of the two-class MDR algorithm that can detect and characterize epistatic SNP-SNP interactions in the con-text of a quantitative trait [34].
value is larger than the overall mean of the phenotypic trait within the dataset. Other-wise, it is considered low-level. Next, QMDR combines the ‘high-level’ and ‘low-level’
genotypes into respective groups, and compares the phenotypic outcomes between these two groups using aT-test.
QMDR also uses a 10-fold cross-validation procedure similar to the original MDR algorithm. The dataset is divided into 10 portions –9 portions are used as a training dataset, and the remaining portion is used as a testing dataset. Next, the training t-statistic is calculated for eachk-way interaction in the training dataset. Thek-way model with the best training score is then used to predict the case–control status in the testing dataset. Ultimately, the bestk-order interaction model is chosen based upon the training t-statistic and the highest testing t-statistic is used to select the best overall model for the dataset.
In the current analyses, we utilized QMDR to specifically test filtered SNPs for all pos-sible two-way (SNP-SNP) interaction models that are associated with the continuous BMI outcome based on their training T-statistic scores. Amongst these models, we selected the 100 best overall SNP-SNP models based on their respective testing T-statistic scores.
Permutation testing to assess statistical significance
Permutation procedures were performed to determine a cut-off threshold for an α= 0.05 significance level. A 1,000 permutations were performed, and in each permuted dataset the 100 best two-way SNP models were selected based on their T-statistic training and testing values. The null distribution of the 100 best SNP models and T-statistic values obtained from all permutations was utilized to cal-culate P-values for SNP-SNP models. P-values were also corrected for multiple testing using standard Bonferroni corrections.
Assessing the non-additive nature of identified pairwise interactions
A 1,000 permuted datasets were created using the explicit test of epistasis, by shuffling genotypic data for each SNP [35]. However, genotype frequencies were maintained so that independent main effects were preserved while non-linear interactions were randomized. Linear regression was used to model the identified statistically significant SNP-SNP interactions in relation to BMI within the original and permuted datasets. In-teractions between SNPs were coded as Cartesian products within the regression model. The nine possible two-locus genotypes were coded from 0–8 (Additional file 2: Figure S1). The null distribution was created using the F-statistic values for the regres-sion models from the 1000 permuted datasets. This was used to calculate the ‘explicit epistasis’P-value associated with the original pairwise interactions that were identified.
Assessing the added variance in BMI explained by identified pairwise interactions Linear regression models were used to assess the added variance of the quantitative BMI trait explained by the statistically significant SNP-SNP interactions identified in our analyses. The reduced regression model was built by including the main effect of the index SNP rs11642841 in theFTO region, and the main effects of all SNPs within our identified interactions. The full regression model included the identified pairwise interactions in addition to the terms from the reduced model. Adjusted R2values were
used to assess the variance explained by both models. Additionally, a likelihood ratio test was used to compare both models.
Biological evidence for identified pairwise interactions
To identify known biological evidence supporting the statistically significant pairwise interactions, we mapped each SNP to a corresponding gene using information from dbSNP (build 139) and SCANdb (http://www.scandb.org). We also searched for evidence of functional relationships between interacting genes using the Integrated Multi-Species Prediction (IMP) web server [36]. IMP integrates information from a large number of sources including experimentally verified data from gene expression studies, IntAct, MINT, MIPS, and BioGRID databases in order to provide a predictive probability that two genes work together within a given biological process.
Replication analyses
SNP-SNP models that reached a Bonferroni-corrected P-value < 0.1 were selected for replication in the eMERGE I-660 dataset [37]. This dataset was imputed using data from the 1000 Genomes Project. Detailed information regarding the replication dataset is presented in Additional file 3: Table S2. SNPs that are in high LD with the SNPs within these interactions were identified using SNAP [38]. These SNPs were then used to generate a list of ‘proxy’ SNP-SNP models that represented the original interaction models. Both the original and proxy SNP-SNP models were tested for replication in the independent dataset. The same QMDR analysis procedure described earlier was used to specifically test for these models in the eMERGE dataset. Additional file 4: Table S3 shows the number of LD expanded models that were generated and tested for each of the original SNP-SNP interactions.
Results Main effect filter
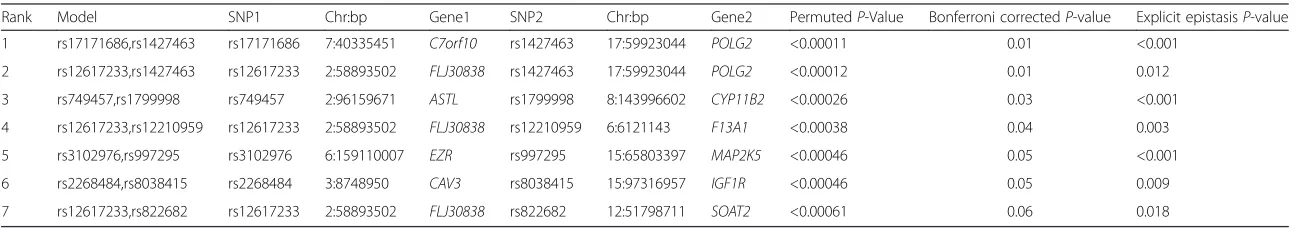
Using the set of SNPs that emerged from the main effect filter, QMDR analysis identified seven novel SNP-SNP interaction models that were associated with BMI (Bonferroni corrected P-value <0.1) (Table 1). These SNP-SNP models also reflect strong epistatic relationships. P-values associated with the non-additive nature of these interactions are also presented in Table 1. We also queried the biological and functional context of these interactions using IMP. However, since both FLJ30838
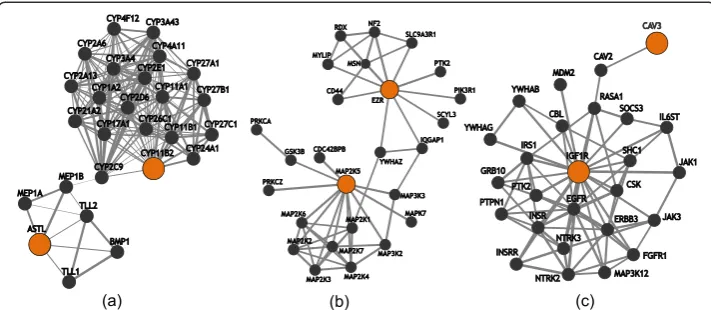
and C7orf10 are of unknown function, we gained most insight regarding interac-tions 3, 5 and 6 (Table 1). ASTL and CYP11B2 were found to interact via two genes – MEP1B and CYP2C9 (Fig. 2a). A functional partner of EZR was found to interact with MAP2K5 through other participants in the MAPK signaling pathway (Fig. 2b). Lastly, a member of the IGF1R protein complex was found to interact with CAV3 (Fig. 2c).
Biofilter
Table 1Results for QMDR association analysis for continuous BMI outcome
Rank Model SNP1 Chr:bp Gene1 SNP2 Chr:bp Gene2 PermutedP-Value Bonferroni correctedP-value Explicit epistasisP-value
1 rs17171686,rs1427463 rs17171686 7:40335451 C7orf10 rs1427463 17:59923044 POLG2 <0.00011 0.01 <0.001
2 rs12617233,rs1427463 rs12617233 2:58893502 FLJ30838 rs1427463 17:59923044 POLG2 <0.00012 0.01 0.012
3 rs749457,rs1799998 rs749457 2:96159671 ASTL rs1799998 8:143996602 CYP11B2 <0.00026 0.03 <0.001
4 rs12617233,rs12210959 rs12617233 2:58893502 FLJ30838 rs12210959 6:6121143 F13A1 <0.00038 0.04 0.003
5 rs3102976,rs997295 rs3102976 6:159110007 EZR rs997295 15:65803397 MAP2K5 <0.00046 0.05 <0.001
6 rs2268484,rs8038415 rs2268484 3:8748950 CAV3 rs8038415 15:97316957 IGF1R <0.00046 0.05 0.009
7 rs12617233,rs822682 rs12617233 2:58893502 FLJ30838 rs822682 12:51798711 SOAT2 <0.00061 0.06 0.018
Seven signals reached a Bonferroni correctedP-value < 0.1. SNPs have been mapped to their corresponding genes using dbSNP (build 139) and SCANdb. SNP1 and SNP2 indicate the individual SNPs within a given SNP-SNP interaction model identified by QMDR. Chromosomal location of SNPs is noted in the following format - Chromosome: Base pair.P-values were calculated from a distribution built from 1000 permutations.
P-values were also corrected using the Bonferroni method. Explicit epistasisP-values were calculated from a distribution built from 1000 permutations using the‘explicit test of epistasis’
De
et
al.
BioData
Mining
(2015) 8:41
Page
7
of
Added variance in BMI explained
The reduced regression model including the main effect of the FTO index SNP and main effects of all SNPs within our identified interactions, had an adjusted R2value of 0.008207. The full regression model including the main effects in the reduced model and the statistically significant SNP-SNP interactions identified, had an ad-justed R2 value of 0.008932. Comparison of the two models showed a statistically significant increase in the variance explained (Likelihood ratio test P-value = 0.01).
Replication analyses
After the use of an identical QMDR analysis procedure, we replicated the main effect filtered SNP-SNP interaction between rs749457 inASTLand rs1799998 inCYP11B2. We also replicated 58 proxy SNP-SNP models representing this interaction in the eMERGE dataset at a permutationP-value threshold of 0.05 (Additional file 5: Table S4).
Discussion
In this study, we analyzed the genetic and phenotypic information for a total of 15,737 individuals combined from five cohorts. SNPs were either filtered based on the strength of their independent effects or on the number of independent sources of biological knowledge supporting them. Filtered SNPs were then specifically tested for SNP-SNP interactions.
Historically, GWA studies have employed a linear modeling framework that tests single SNPs one at a time, for its association with a given phenotype. Hirschhorn et al. have shown that positive results from studies employing such an approach typically cannot be replicated across independent studies [39]. This has highlighted the need for embracing the complexity of a genotype-phenotype relationship by focusing on gene-gene interac-tions [40]. However, detecting gene-gene interacinterac-tions in a GWAS presents a considerable
computational and statistical challenge. Moore and Ritchie describe the need for design-ing new computational methods for detectdesign-ing high-order non-linear interactions since traditional approaches such as logistic regression have limited power when modeling such interactions in high-dimensional data [41, 42]. They also stress upon the importance of filtering methods for the selection of SNPs to be included in an analysis. The exhaustive search of all possible combinations of thousands of SNPs is computationally very expensive. Our approach addresses both of these challenges. QMDR is a non-parametric method that does not assume any genetic model. Most importantly, QMDR greatly reduces the degrees of freedom required for modeling interactions. We also address the SNP-selection problem by applying two parallel filtering approaches, thereby effectively reducing our search space for detecting meaningful interactions.
We identified seven novel interactions that are highly associated with BMI. These seven interactions were also explicitly tested for the presence of epistasis. All the identi-fied interactions exhibited an epistatic component. Moreover, we evaluated the increase in explained phenotypic variance by the identified SNP-SNP interactions. The index
FTOSNP rs11642841 is in strong LD (r2> 0.8) with theFTOSNP rs1558902 previously identified by Speliotes et al. to explain the largest proportion of the variance in BMI [1]. We found an 8.8 % increase in the variance in BMI explained by our identified SNP-SNP interactions, beyond what is explained by the main effects of the indexFTO
SNP and the SNPs within our interactions.
We found a significant association between rs749457 in ASTL and rs1799998 in
CYP11B2 related to BMI. This SNP-SNP interaction and 58 LD expanded models representing it were replicated in the eMERGE dataset. The variant rs1799998 has been associated with insulin resistance, diabetes, and metabolic syndrome in humans, but it has not been shown to have an independent association with BMI [43–45]. Little is known regarding the function ofASTLin humans, a specific protease that uses metals in catalytic processes [46]; however, there is moderate support connecting ASTL to a functional partner of CYP11B2(Fig. 2a). ASTLshares a strong sequence similarity and a common genetic ancestor with MEP1A. Both MEP1A and MEP1B are subunits of meprins and MEP1B shares a transcription factor binding site with and is part of the same gene expression signature as CYP2C9. Both CYP2C9and CYP11B2are function-ally related by their roles in lipid metabolism [36]. CYP11B2is specifically involved in mineralocorticoid biosynthesis [47, 48]. Incidentally, the mineralocorticoid receptor has been shown to play an important role in the positive control of adipogenesis and thus, in the development of obesity [49].
In two interactions, rs1427463 in POLG2 interacts with rs17171686 in C7orf10 and rs12617233 in FLJ30838respectively. Although, little is known regarding the functions of C7orf10 and FLJ3083, POLG2’s function may provide some insight into this interaction. POLG2 is largely involved in metabolic pathways and the transcriptional activation of mitochondrial biogenesis [47, 48]. An increase in mitochondrial biogenesis has been shown to prevent the development of obesity in mice [50]. Conversely, mice with reduced expression of genes involved in mitochondrial respiration eventually de-velop obesity [51]. Consequently, the involvement of mitochondrial dynamics in obesity has gained a lot of support [52].
The SNP rs12617233 inFLJ30838also interacts with the SNPs rs12210959 inF13A1, and rs822682 in SOAT2 respectively. F13A1 encodes for the A subunit of the
coagulation factor XIII and is involved in fibrin clot formation [53]. Several SNPs on this gene were found to be highly associated with BMI in a study utilizing gene expression data from monozygotic twins to deeply interrogate GWAS data [54]. Interestingly, the SNP identified in our study is independent of theF13A1signals identified by Naukkarinen et al. While several studies in obese individuals and rodent models of obesity have also reported increased levels of coagulation factors [55, 56], the exact mechanism of action is unknown. SOAT2is a major regulator of cholesterol metabolism and absorption in the small intestine and liver of mice on a high-cholesterol and high-fat diet [57] and impaired cholesterol absorption has been linked to high BMI and obesity [58, 59] through a yet unknown mechanism.
We also observed an interaction between rs997295 in MAP2K5 and rs3102976 in
EZR related to BMI. MAP2K5 is a part of the MAPK signaling pathway involved in growth factor stimulated cell proliferation. EZR, or ezrin, encodes a cytoplasmic per-ipheral membrane protein that links the plasma membrane and the actin cytoskeleton. Consequently, ezrin plays an important role in cell adhesion, migration, organization, and regulation of the actin cytoskeleton. Prior experimental evidence supports the physical and functional connection between these two genes (Fig. 2b) [36]. One can imagine the strong need for regulating the actin cytoskeleton during dynamic processes such as adipogenesis.
Lastly, we observed an interaction between rs2268484 in CAV3 and rs8038415 in
IGF1R related to BMI.CAV3encodes for a muscle-specific form of the caveolin family of proteins. Researchers have found that CAV3-knockout mice develop insulin resist-ance in their skeletal muscles [60] and that adenovirus-mediated gene transfer ofCAV3
increases glycogen synthesis in the liver as well as improves insulin signaling in diabetic obese mice [61]. IGF1R codes for the receptor of insulin-like growth factor 1, IGF1. IGF1 regulates pancreaticβ-cell mass and thus plays a crucial role in insulin signaling. Hence, impaired IGF1 signaling may alter insulin secretion by β-cells and negatively impact the hypothalamus –a region of the brain associated with food intake– ultim-ately causing weight gain [62]. Interestingly, a member of the IGF1Rprotein complex assembly (RAS1) is known to interact with a functional partner of CAV3 in a number of processes such as signal transduction, endocytosis and focal adhesion (Fig. 2c) [36].
Four of the seven interactions that we identified include SNPs that have previously been identified as independent signals associated with BMI [27]. These SNPs are–rs12617233 in FLJ30838 and rs997295 in MAP2K5 – within interactions 2, 4, 5 and 7 (Table 1).
FLJ30838 is a long intergenic non-coding RNA (lincRNA) of unknown function. It was found to interact with rs1427463 in POLG2, rs12210959 in F13A1, and rs822682 in
SOAT2. Incidentally, none of these other SNPs have been implicated in obesity before. The rs1427463 variant has been associated with height previously in an African ancestry population, which obviously factors into BMI calculations [63].
This study identifies gene-gene interactions that are potentially associated with obesity. Prior experimental evidence suggests the plausible biological relevance of several of the identified loci. However, we also identified a few loci of unknown function. Unfortunately, the inferences that can be drawn from our results are limited by a functional annotation bias –well-studied genes are assigned many annotations while understudied genes often lack annotations. One could speculate that the genes involved in these interactions are multi-functional, thereby connecting various biological processes and pathways. Future work focusing on network-based analyses can help elucidate the additional heritability of BMI that is explained at the biological pathway level. Ultimately, further biological valida-tions will be necessary to determine whether the identified interacvalida-tions influence the development of obesity. Finally, additional studies are required to better understand gene-environment interactions, to get a more complete understanding of the complex genetic architecture of obesity.
Conclusions
Main effects analyses have explained little of the genetic heritability of obesity. The use of methods such as QMDR in conjunction with traditional statistical analyses can unravel this complex network by identifying gene-gene interactions that play key roles in the etiology of obesity. Our QMDR analysis of genotypic data from 5 study cohorts identified novel interactions between genetic variants that are highly associated with BMI. Future studies are necessary to verify the observed associations.
Additional files
Additional file 1: Table S1. Information for cohorts providing individual level data. Information regarding the geographic location, and numbers of individuals included from each cohort. (PDF 40 kb)
Additional file 2: Figure S1. Example of Cartesian product coding. An illustrative example of cartesian product coding used for interactions between SNPs within regression models to test non-additive nature of identified pairwise interactions. (PDF 46 kb)
Additional file 3: Table S2. Information of eMERGE cohorts providing individual level data for replication analyses. Information regarding the geographic location, and numbers of individuals included from each cohort. (XLSX 39 kb)
Additional file 4: Table S3. Details of LD expanded models. Number of LD-expanded (proxy) SNP-SNP models generated for each original discovered SNP-SNP model. (XLSX 34 kb)
Additional file 5: Table S4. Results from QMDR association analysis of main effect filtered SNP-SNP models replicated in eMERGE dataset. Shown here are models that reached a permutation P-value < 0.05 in the replication dataset. SNPs have been mapped to their corresponding genes using dbSNP (build 139). SNP1 and SNP2 indicate the individual SNPs within a given SNP-SNP interaction model. P-values were calculated from a distribution built from 1000 permutations. (XLSX 53 kb)
Additional file 6: Additional Acknowledgements.Acknowledgements and detailed descriptions of the five studies that provided the data for the analyses in this paper. (PDF 68 kb)
Abbreviations
BMI:Body Mass Index; GWAS: Genome Wide Association Study; QMDR: Quantitative Multifactor Dimensionality Reduction; SNP: Single nucleotide polymorphism; MAF: Minor allele frequency; LD: Linkage disequilibrium.
Competing interests
The authors declare that they have no competing interests.
Authors’contributions
RD performed analyses using QMDR, explicit epistasis, regression, and drafted the manuscript. SSV pre-processed data and carried out replication analyses. Study data and analyses were provided by FD, EH, MVH, MAH, DRC, DSC, HH, GJ, EL, JAP, LJR, CBM, FWA. BJK, MDR, DGD conceived of the study, and participated in its design and coordination. MVH, FWA, BJK, MDR, DGD participated in the drafting and finalization of the manuscript. All authors read and approved the final manuscript.
Acknowledgements
This work was supported by National Institutes of Health grants–NLM R01 grants (LM010098, LM011360, LM009012), and GMS P20 grants (GM103506, GM103534 and GM104416). The IBC array data (also known as 'Cardiochip' or 'CVDSNP55v1_A' from the National Heart, Lung and Blood Institute (NHLBI) Candidate Gene Association Resource (CARe) was downloaded with appropriate permissions from the Database of Genotypes and Phenotypes (dbGaP) (www.ncbi.nlm.nih.gov/gap). CARe acknowledges the support of the National Heart, Lung and Blood Institute and the contributions of the research institutions, study investigators, field staff, and study participants in creating this resource for biomedical research (NHLBI contract number HHSN268200960009C). FWA is supported by a Dekker scholarship - Junior Staff Member 2014 T001–Netherlands Heart Foundation. The eMERGE Network was initiated and funded by NHGRI through the following grants: U01HG006828 (Cincinnati Children’s Hospital Medical Center/Boston Children’s Hospital); U01HG006830 (Children’s Hospital of Philadelphia); U01HG006389 (Essentia Institute of Rural Health, Marshfield Clinic Research Foundation and Pennsylvania State University); U01HG006382 (Geisinger Clinic); U01HG006375 (Group Health Cooperative/University of Washington); U01HG006379 (Mayo Clinic); U01HG006380 (Icahn School of Medicine at Mount Sinai); U01HG006388 (Northwestern University); U01HG006378 (Vanderbilt University Medical Center); U01HG006385 (Vanderbilt University Medical Center serving as the Coordinating Center), and U01HG004438 (CIDR) and U01HG004424 (the Broad Institute) serving as Genotyping Centers. Acknowledgements for the five studies that provided the data for the analyses in this paper are expressed in the additional file 6.
Author details 1
Computational Genetics Laboratory, Department of Genetics, Geisel School of Medicine at Dartmouth,
Dartmouth-Hitchcock Medical Center, 706 Rubin Building, HB7937, One Medical Center Dr, Lebanon, NH 03756, USA. 2
Center for Systems Genomics, Department of Biochemistry and Molecular Biology, 512 Wartik Laboratory, The Pennsylvania State University, University Park, PA 16802, USA.3Centre for Cardiovascular Genetics, Institute of Cardiovascular Science, Faculty of Population Health Sciences, University College London, 5 University Street, London WC1E 6JF, UK.4Division of Transplant Surgery, Perelman School of Medicine, University of Pennsylvania, 3400 Spruce Street, 2 Dulles Pvln, Philadelphia, PA 19104, USA.5Department of Genome Sciences, University of Washington, 3720 15th Ave NE, Seattle, WA 98195-5065, USA.6Group Health Research Institute, Metropolitan Park East, 1730 Minor Avenue, Suite 1600, Seattle, WA 98101-1448, USA.7The Joseph Stokes Jr. Research Institute, The Children’s Hospital of Philadelphia, Office 1016 Abramson Building, Room 1216E, 3615 Civic Center Blvd, Philadelphia, PA 19104, USA. 8
Division of Medical Genetics, Department of Medicine, University of Washington, Health Sciences Building, K-253B, Medical Genetics, Box 357720, Seattle, WA 98195-7720, USA.9Center for Genetic Medicine, Northwestern University Feinberg School of Medicine, 303 E. Superior Street, Lurie 7-125, Chicago, IL 60611, USA.10Department of Preventive Medicine, Northwestern University, Feinberg School of Medicine, 680 N Lake Shore Drive, Suite 1400, Chicago, IL 60611, USA.11Center for Human Genetics Research, Vanderbilt University School of Medicine, 519 Light Hall, Nashville, TN 37232, USA.12Department of Cardiology, Division Heart and Lungs, University Medical Center Utrecht, Room E03.511, P.O. Box 855003508 GA Utrecht, The Netherlands.13Institute of Cardiovascular Science, University College London, London, UK.14Durrer Center for Cardiogenetic Research, ICIN-Netherlands Heart Institute, Utrecht, The Netherlands.15Institute for Biomedical Informatics, The Perelman School of Medicine, University of Pennsylvania, 1418 Blockley Hall, 423 Guardian Drive, Philadelphia, PA 19104-6021, USA.16University Medical Center Utrecht, Utrecht, The Netherlands.17Institute for Quantitative Biomedical Sciences at Dartmouth, Hanover, NH, USA.18Department of Epidemiology, Geisel School of Medicine at Dartmouth, One Medical Center Drive, 7927 Rubin Building, Lebanon, NH 03756, USA.
Received: 12 June 2015 Accepted: 4 December 2015
References
1. Speliotes EK, Willer CJ, Berndt SI, Monda KL, Thorleifsson G, Jackson AU, et al. Association analyses of 249,796 individuals reveal 18 new loci associated with body mass index. Nat Genet. 2010;42:937–48. 2. Calle EE, Kaaks R. Overweight, obesity and cancer: epidemiological evidence and proposed mechanisms. Nat Rev
Cancer. 2004;4:579–91.
3. Ogden CL, Carroll MD, Kit BK, Flegal KM. Prevalence of childhood and adult obesity in the United States, 2011–2012. JAMA. 2014;311:806–14.
4. Kelly T, Yang W, Chen C-S, Reynolds K, He J. Global burden of obesity in 2005 and projections to 2030. Int J Obes (Lond). 2008;32:1431–7.
5. Scuteri A, Sanna S, Chen W-M, Uda M, Albai G, Strait J, et al. Genome-wide association scan shows genetic variants in the FTO gene are associated with obesity-related traits. PLoS Genet. 2007;3:e115.
6. Zhao J, Bradfield JP, Zhang H, Sleiman PM, Kim CE, Glessner JT, et al. Role of BMI-associated loci identified in GWAS meta-analyses in the context of common childhood obesity in European Americans. Obesity. 2011;19:2436–9.
7. Stunkard AJ, Foch TT, Hrubec Z. A twin study of human obesity. JAMA J Am Med Assoc. 1986;256:51–4. 8. Maes HH, Neale MC, Eaves LJ. Genetic and environmental factors in relative body weight and human adiposity.
Behav Genet. 1997;27:325–51.
9. Eichler EE, Flint J, Gibson G, Kong A, Leal SM, Moore JH, et al. Missing heritability and strategies for finding the underlying causes of complex disease. Nat Rev Genet. 2010;11:446–50.
10. Moore JH, Asselbergs FW, Williams SM. Bioinformatics challenges for genome-wide association studies. Bioinformatics. 2010;26:445–55.
11. Manolio TA, Collins FS, Cox NJ, Goldstein DB, Hindorff LA, Hunter DJ, et al. Finding the missing heritability of complex diseases. Nature. 2009;461:747–53.
13. Klein RJ, Zeiss C, Chew EY, Tsai J-Y, Sackler RS, Haynes C, et al. Complement factor H polymorphism in age-related macular degeneration. Science. 2005;308:385–9.
14. Haines JL, Hauser M a, Schmidt S, Scott WK, Olson LM, Gallins P, et al. Complement factor H variant increases the risk of age-related macular degeneration. Science. 2005;308:419–21.
15. Easton DF, Pooley KA, Dunning AM, Pharoah PDP, Ballinger DG, Struewing JP, et al. Genome-wide association study identifies novel breast cancer susceptibility loci. Nature. 2009;447:1087–93. 16. Zaitlen N, Kraft P. Heritability in the genome-wide association era. Hum Genet. 2012;131:1655–64.
17. Moore JH. The ubiquitous nature of epistasis in determining susceptibility to common human diseases. Hum Hered. 2003;56:73–82.
18. Mackay TFC. Epistasis and quantitative traits: using model organisms to study gene-gene interactions. Nat Rev Genet. 2014;15:22–33.
19. Hill C, Gerardo D, James F, Tyroler HA, Chambless LE, Romm J, et al. The Atherosclerosis Risk in Communities (ARIC) Study: design and objectives. Am J Epidemiol. 1989;129:687–702.
20. Friedman GD, Cutter GR, Donahue RP, Hughes GH, Hulley SB, Jacobs DR, et al. CARDIA: study design, recruitment, and some characteristics of the examined subjects. J Clin Epidemiol. 1988;41:1105–16. 21. Fried LP, Borhani NO, Enright P, Furberg CD, Gardin JM, Kronmal RA, et al. The Cardiovascular Health
Study: design and rationale. Ann Epidemiol. 1991;1:263–76.
22. Dawber TR, Meadors GF, Moore FE. Epidemiological approaches to heart disease: the Framingham Study. Am J Public Health Nations Health. 1951;41:279–81.
23. Bild DE, Bluemke DA, Burke GL, Detrano R, Diez Roux AV, Folsom AR, et al. Multi-ethnic study of atherosclerosis: objectives and design. Am J Epidemiol. 2002;156:871–81.
24. Keating BJ, Tischfield S, Murray SS, Bhangale T, Price TS, Glessner JT, et al. Concept, design and implementation of a cardiovascular gene-centric 50 k SNP array for large-scale genomic association studies. PLoS One. 2008;3:e3583. 25. Purcell S, Neale B, Todd-Brown K, Thomas L, Ferreira MAR, Bender D, et al. PLINK: a tool set for
whole-genome association and population-based linkage analyses. Am J Hum Genet. 2007;81:559–75. 26. Sun X, Lu Q, Mukheerjee S, Crane PK, Elston R, Ritchie MD. Analysis pipeline for the epistasis search - statistical
versus biological filtering. Front Genet. 2014;5:106.
27. Guo Y, Lanktree MB, Taylor KC, Hakonarson H, Lange L a, Keating BJ. Gene-centric meta-analyses of 108 912 individuals confirm known body mass index loci and reveal three novel signals. Hum Mol Genet. 2013;22:184–201.
28. Bush WS, Dudek SM, Ritchie MD: Biofilter: A Knowledge-Integration System for the Multi-Locus Analysis of Genome-Wide Association Studies. Pacific Symp Biocomput 2009:368–379. http://www.ncbi.nlm.nih.gov/pmc/ articles/PMC2859610/.
29. Pendergrass SA, Frase A, Wallace J, Wolfe D, Katiyar N, Moore C, et al. Genomic analyses with biofilter 2. 0: knowledge driven filtering, annotation, and model development. BioData Min. 2013;6:25.
30. Turner SD, Berg RL, Linneman JG, Peissig PL, Crawford DC, Denny JC, et al. Knowledge-driven multi-locus analysis reveals gene-gene interactions influencing HDL cholesterol level in two independent EMR-linked biobanks. PLoS One. 2011;6:e19586.
31. Price AL, Patterson NJ, Plenge RM, Weinblatt ME, Shadick NA, Reich D. Principal components analysis corrects for stratification in genome-wide association studies. Nat Genet. 2006;38:904–9.
32. Frayling TM, Timpson NJ, Weedon MN, Zeggini E, Freathy RM, Lindgren CM, et al. A common variant in the FTO gene is associated with body mass index and predisposes to childhood and adult obesity. Science. 2007;316:889– 94.
33. Gui J, Moore JH, Williams SM, Andrews P, Hillege HL, van der Harst P, et al. A simple and computationally efficient approach to multifactor dimensionality reduction analysis of gene-gene interactions for quantitative traits. PLoS One. 2013;8:e66545.
34. Ritchie MD, Hahn LW, Roodi N, Bailey LR, Dupont WD, Parl FF, et al. Multifactor-dimensionality reduction reveals high-order interactions among estrogen-metabolism genes in sporadic breast cancer. Am J Hum Genet. 2001;69: 138–47.
35. Greene CS, Himmelstein DS, Nelson HH, Kelsey KT, Williams SM, Andrew AS, et. al. Enabling personal genomics with an explicit test of epistasis. Pacific Symp Biocomput 2010:327–36. http://www.ncbi.nlm.nih.gov/pmc/articles/ PMC2916690/.
36. Wong AK, Park CY, Greene CS, Bongo L a, Guan Y, Troyanskaya OG: IMP. IMP: a multi-species functional genomics portal for integration, visualization and prediction of protein functions and networks. Nucleic Acids Res. 2012;40(Web Server issue):W484–90.
37. McCarty CA, Chisholm RL, Chute CG, Kullo IJ, Jarvik GP, Larson EB, et al. The eMERGE Network: a consortium of biorepositories linked to electronic medical records data for conducting genomic studies. BMC Med Genomics. 2011;4:13.
38. Johnson AD, Handsaker RE, Pulit SL, Nizzari MM, O’Donnell CJ, de Bakker PIW. SNAP: a web-based tool for identification and annotation of proxy SNPs using HapMap. Bioinformatics. 2008;24:2938–9.
39. Hirschhorn JN, Lohmueller K, Byrne E, Hirschhorn K. A comprehensive review of genetic association studies. Genet Med. 2002;4:45–61.
40. Mackay TF, Moore JH. Why epistasis is important for tackling complex human disease genetics. Genome Med. 2014;6:42.
41. Moore JH, Williams SM. New strategies for identifying gene-gene interactions in hypertension. Ann Med. 2002;34: 88–95.
42. Moore J, Ritchie M. The Challenges of Whole-Genome Approaches to Common Disease. JAMA J Am Med Assoc. 2004;291:1642–3.
43. Russo P, Lauria F, Loguercio M, Barba G, Arnout J, Cappuccio FP, et al.−344C/T Variant in the promoter of the aldosterone synthase gene (CYP11B2) is associated with metabolic syndrome in men. Am J Hypertens. 2007;20:218–22.
44. Ranade K, Wu KD, Risch N, Olivier M, Pei D, Hsiao CF, et al. Genetic variation in aldosterone synthase predicts plasma glucose levels. Proc Natl Acad Sci U S A. 2001;98:13219–24.
45. Bellili NM, Foucan L, Fumeron F, Mohammedi K, Travert F, Roussel R, et al. Associations of the−344 T > C and the 3097 G > A polymorphisms of CYP11B2 gene with hypertension, type 2 diabetes, and metabolic syndrome in a French population. Am J Hypertens. 2010;23:660–7.
46. Quesada V, Sánchez LM, Álvarez J, López-Otín C. Identification and characterization of human and mouse ovastacin: a novel metalloproteinase similar to hatching enzymes from arthropods, birds, amphibians and fish. J Biol Chem. 2004;279(25):26627–34.
47. Kanehisa M, Goto S. KEGG: kyoto encyclopedia of genes and genomes. Nucleic Acids Res. 2000;28:27–30. 48. Croft D, Mundo AF, Haw R, Milacic M, Weiser J, Wu G, et al. The Reactome pathway knowledgebase. Nucleic Acids
Res. 2014;42(Database issue):D472–7.
49. Caprio M, Fève B, Claës A, Viengchareun S, Lombès M, Zennaro M-C. Pivotal role of the mineralocorticoid receptor in corticosteroid-induced adipogenesis. FASEB J. 2007;21:2185–94.
50. Wang Y-X, Zhang C-L, Yu RT, Cho HK, Nelson MC, Bayuga-Ocampo CR, et al. Regulation of muscle fiber type and running endurance by PPARdelta. PLoS Biol. 2004;2:e294.
51. Schuler M, Ali F, Chambon C, Duteil D, Bornert J-M, Tardivel A, et al. PGC1alpha expression is controlled in skeletal muscles by PPARbeta, whose ablation results in fiber-type switching, obesity, and type 2 diabetes. Cell Metab. 2006;4:407–14.
52. Zorzano A, Liesa M, Palacín M. Role of mitochondrial dynamics proteins in the pathophysiology of obesity and type 2 diabetes. Int J Biochem Cell Biol. 2009;41:1846–54.
53. Ichinose A, Davie EW. Characterization of the gene for the a subunit of human factor XIII (plasma transglutaminase), a blood coagulation factor. Proc Natl Acad Sci U S A. 1988;85:5829–33.
54. Naukkarinen J, Surakka I, Pietiläinen KH, Rissanen A, Salomaa V, Ripatti S, et al. Use of genome-wide expression data to mine the“Gray Zone”of GWA studies leads to novel candidate obesity genes. PLoS Genet. 2010;6: e1000976.
55. Skurk T, Hauner H. Obesity and impaired fibrinolysis: role of adipose production of plasminogen activator inhibitor-1. Int J Obes Relat Metab Disord. 2004;28:1357–64.
56. Lau DCW, Dhillon B, Yan H, Szmitko PE, Verma S. Adipokines: molecular links between obesity and atheroslcerosis. Am J Physiol Heart Circ Physiol. 2005;288:H2031–41.
57. Buhman KK, Accad M, Novak S, Choi RS, Wong JS, Hamilton RL, et al. Resistance to diet-induced hypercholesterolemia and gallstone formation in ACAT2-deficient mice. Nat Med. 2000;6:1341–7.
58. Miettinen TA, Gylling H. Cholesterol absorption efficiency and sterol metabolism in obesity. Atherosclerosis. 2000; 153:241–8.
59. Simonen P, Gylling H, Howard AN, Miettinen TA. Introducing a new component of the metabolic syndrome. Am J Clin Nutr. 2000;72(1):82–8.
60. Oshikawa J, Otsu K, Toya Y, Tsunematsu T, Hankins R, Kawabe J, et al. Insulin resistance in skeletal muscles of caveolin-3-null mice. Proc Natl Acad Sci U S A. 2004;101:12670–5.
61. Otsu K, Toya Y, Oshikawa J, Kurotani R, Yazawa T, Sato M, et al. Caveolin gene transfer improves glucose metabolism in diabetic mice. Am J Physiol Cell Physiol. 2010;298(3):450–6.
62. Kahn SE, Hull RL, Utzschneider KM. Mechanisms linking obesity to insulin resistance and type 2 diabetes. Nature. 2006;444:840–6.
63. Carty CL, Johnson N a, Hutter CM, Reiner AP, Peters U, Tang H, et al. Genome-wide association study of body height in African Americans: the Women’s Health Initiative SNP Health Association Resource (SHARe). Hum Mol Genet. 2012;21:711–20.
• We accept pre-submission inquiries
• Our selector tool helps you to find the most relevant journal
• We provide round the clock customer support
• Convenient online submission
• Thorough peer review
• Inclusion in PubMed and all major indexing services
• Maximum visibility for your research
Submit your manuscript at www.biomedcentral.com/submit