R E S E A R C H A R T I C L E
Open Access
Polygenic analysis of inflammatory disease
variants and effects on microglia in the
aging brain
Daniel Felsky
1,2,3,4*, Ellis Patrick
5, Julie A. Schneider
6,7, Sara Mostafavi
8, Chris Gaiteri
6,7, Nikolaos Patsopoulos
2,3,
David A. Bennett
6,7and Philip L. De Jager
1,2,3,4Abstract
Background:The role of the innate immune system in Alzheimer’s disease (AD) and neurodegenerative disease susceptibility has recently been highlighted in genetic studies. However, we do not know whether risk for
inflammatory disease predisposes unaffected individuals to late-life cognitive deficits or AD-related neuropathology. We investigated whether genetic risk scores for seven immune diseases and central nervous system traits were related to cognitive decline (nmax= 1601), classical AD neuropathology (nmax= 985), or microglial density (nmax= 184).
Methods:Longitudinal cognitive decline, postmortem amyloid and tau neuropathology, microglial density, and gene module expression from bulk brain tissue were all measured in participants from two large cohorts (the Rush Religious Orders Study and Memory and Aging Project; ROS/MAP) of elderly subjects (mean age at entry 78 +/−8.7 years). We analyzed data primarily using robust regression methods. Neuropathologists were blind to clinical data.
Results:The AD genetic risk scores, including and excludingAPOEeffects, were strongly associated with cognitive decline in all domains (minPuncor= 3.2 × 10⁻²⁹). Multiple sclerosis (MS), Parkinson’s disease, and schizophrenia risk did not influence cognitive decline in older age, but the rheumatoid arthritis (RA) risk score alone was significantly associated with microglial density after correction (t146=−3.88,Puncor= 1.6 × 10⁻⁴). Post-hoc tests found significant effects of the RA genetic risk score in multiple regions and stages of microglial activation (minPuncor= 1.5 × 10⁻⁶). However, these associations were driven by only one or two variants, rather than cumulative polygenicity. Further, individual MS (Pone-sided< 8.4 × 10⁻⁴) and RA (Pone-sided= 3 × 10⁻⁴) variants associated with higher microglial density were also associated with increased expression of brain immune gene modules.
Conclusions:Our results demonstrate that global risk of inflammatory disease does not strongly influence aging-related cognitive decline but that susceptibility variants that influence peripheral immune function also alter microglial density and immune gene expression in the aging brain, opening a new perspective on the control of microglial and immune responses within the central nervous system. Further study on the molecular mechanisms of peripheral immune disease risk influencing glial cell activation will be required to identify key regulators of these pathways.
Keywords:Genomics, Alzheimer’s disease, Microglia, Inflammation, Polygenic score, Innate immunity, Postmortem, Neuropathology, RNA sequencing
* Correspondence:[email protected]
1Center for Translational and Computational Neuroimmunology, Department
of Neurology, Columbia University Medical Center, 630 West 168th Street, PH 19–302, New York, NY 10032, USA
2Department of Neurology, Brigham and Woman’s Hospital, 75 Francis Street, Boston, MA 02115, USA
Full list of author information is available at the end of the article
Background
Genetic studies have highlighted the shared architecture of susceptibility among inflammatory diseases [1]; how-ever, in unaffected individuals, the significance of this genetic predisposition to immune dysfunction for aging-related processes is unknown. Recent genetic stud-ies of neurodegenerative diseases have also implicated the immune system–particularly the innate component
– in susceptibility to aging-related conditions [2], with Alzheimer’s disease (AD) susceptibility being most clearly enriched for variants that influence the expression and splicing of genes expressed in myeloid cells [3, 4]. In the brain, microglia, the resident myeloid cells, have a prom-inent role, but infiltrating macrophages, B cells, and T cells also contribute to brain pathology in older age. Today, it is not clear whether a predisposition to patho-logic inflammatory responses influences the function of organ systems in individuals that are not affected by an autoimmune disease. Here, we evaluate whether a propen-sity for excessive inflammation that has not manifested it-self clinically in one’s life course can influence the likelihood of (1) late-life cognitive deficits, (2) the accumu-lation of common neuropathology, including amyloid-β (Aβ) and hyperphosphorylated tau, or (3) microglial re-cruitment and activation.
The genetic architecture of aging-related traits is not yet well understood; although their prevalence in the population and the heterogeneity observed among older individuals suggest that the allelic spectrum influencing susceptibility includes many common variants of modest effect [5–7]. To assess this hypothesis, we used a com-mon strategy in which the effects of validated suscepti-bility variants are aggregated into a single additive genetic risk score (GRS). While useful as a screening tool, a GRS obscures the intrinsic granularity of the gen-omic risk landscape; therefore, they need to be comple-mented with targeted investigations of individual variants, where possible. We evaluated two representa-tive inflammatory diseases for which the genetic archi-tecture of susceptibility has been well described: MS, which targets the central nervous system, and rheuma-toid arthritis (RA), for which a recent study of medical claims data from over 8.5 million adults reported an in-creased relative risk of AD among patients with RA. Fur-ther, anti-TNFαtherapy for RA may lower this risk [8]. In MS, a neuropathological study reported no significant difference in the presence of AD pathologies compared to controls [9]; however, the prevalence of late-life path-ologies and cognitive deficits in genetically-defined pop-ulations remains to be characterized.
We also evaluated GRS for four other traits that could influence brain aging and have been characterized genet-ically: Parkinson’s disease (PD), telomere length, coron-ary artery disease (CAD), as well as schizophrenia,
which may also have an inflammatory component [10]. Specifically, we deployed our GRS in two deeply charac-terized cohorts of aging individuals, deconstructed poly-genic associations to resolve whether an association is driven by selected variants or a broad distribution of variants, and accessed cortical RNA sequence data to further develop our mechanistic understanding of ob-served genetic effects.
Methods Subjects
Participants in this study were from the Religious Orders Study (ROS) [11] and the Rush Memory and Aging Pro-ject (MAP) [12], two cohort studies of elderly popula-tions from the Chicago area conducted by investigators at the Rush Alzheimer’s Disease Center (Rush University Medical Center, Chicago, IL, USA). All subjects were older and recruited free of dementia (mean age at entry 78 +/−8.7 years), agreed to annual clinical and neuro-cognitive evaluation, and signed an Anatomical Gift Act allowing for brain autopsy at time of death.
Genetics and imputation
In total, 1878 subjects were genotyped using the Affyme-trix 6.0 Genechip. DNA was extracted from whole blood, lymphocytes, or frozen brain tissue and genotype data underwent standard quality control procedures using PLINK (v1.08), as previously described [13]. Briefly, sub-jects and variants were filtered based on genotype suc-cess rate > 0.95, Hardy-Weinberg Equilibrium P> 0.001, and mishap testP> 1 × 10⁻⁹. After quality control of the initial genotype dataset, 1709 individuals and 750,173 autosomal variants remained. Whole genome imputation was performed using BEAGLE (v3.3.2) [14] and the 1000 Genomes reference panel (phase I haplotypes). To analyze the major histocompatibility complex (MHC) re-gion in detail, a specialized imputation pipeline, SNP2HLA [15], was used. This was necessary given the major contribution of variation in this region to the pathogenesis of immune-related traits analyzed in this study. See Additional file1: Supplementary Methods for details.
Postmortem amyloid-βand tau neuropathology
Postmortem microglial count density
A subset of up to 183 brain samples with genomic data were evaluated for the presence of microglia at three stages of activation, based on morphology: stage 1 (thin ramified processes), stage 2 (plump cytoplasm and thicker processes), and stage 3 (appearance of macro-phages). For each of four regions (midfrontal cortex, in-ferior temporal cortex, ventral medial caudate, and posterior putamen), four microglial density scores (total count of microglia/area surveyed) were calculated: stage 1 only, stage 1 + 2 + 3, stage 2 + 3, and stage 3 only [3] (see Additional file1: Supplementary Methods).
Cognitive decline
A total of 1601 subjects with genomic data also had lon-gitudinal cognitive performance data available at the time of study. ROS and MAP subjects were both admin-istered 17 cognitive tests annually spanning five cogni-tive domains: episodic memory, semantic memory, working memory, perceptual speed, and visuospatial ability. Measures of cognitive performance for each do-main were calculated by averaging z-scores across tests [11, 12, 17], and rates of cognitive decline were calcu-lated per subject using general linear mixed models of cognitive scores over time, co-varying for age at baseline, years of education, and sex, as described [6].
Gene expression
RNA sequencing and post-processing
RNA was extracted from DLPFC and sequenced on the Illumina HiSeq (50 million paired-end reads of 101 bp each), as described [13]. Expression FPKM values were quantile-normalized, correcting for batch effect with Combat [18]. Paired-end reads were mapped to genes using the Ensemble human genome transcriptomic data-base (http://www.ensembl.org). Expression QTL (eQTL) analyses were performed in the ROS/MAP sample to as-certain potential mechanisms of pathology-associated gene variants with respect to gene expression [19]. The GTEx portal [20, 21] was used to corroborate eQTL effects.
Clustering and module enrichment analyses
Gene modules of co-expressed genes were derived using the SpeakEasy consensus clustering algorithm [22]. In ROS/MAP, SpeakEasy identified 47 mutually exclusive modules with 20–556 gene members (median = 331), several of which have been shown to correlate strongly with pathology, cognition, and cell-type specific markers of gene expression in multiple datasets [23]. Of these modules, five (modules #5, #113, #114, #115, and #116) show substantial enrichment for immune- and microglia-related functions and processes [23]. Immune gene modules were defined based on hypergeometric
enrichment for microglia-specific genes (enrichmentp< 0.0011). These microglia-specific genes were defined based on Olah et al. (2018) [24] as at least four-fold up-regulated in human bulk microglia. Module 113 (in-cludes AD genes CLU, SPPL2A, SQSTM1, MPZL1, and
ETS1) has an overlap of 24 microglial genes/313 total module genes (P= 0.0024); module 114 (no major AD genes) has an overlap of 24/276 (P= 4.5 × 10⁻⁴); module 115 (no major AD genes) has an overlap of 33/232 (P= 4.1 × 10⁻¹⁰); module 116 (TREM2,INPP5D) has an over-lap of 144/224 (P= 5.6 × 10−148); and module 5 (BIN1,
PVRL2) has an overlap of 58/431 (P =8.5 × 10⁻¹⁶). See Patrick et al. (2018) for details [25]. As such, expression levels of these five modules were used to benchmark the transcriptional effects of variants in functionally cohesive immune pathways.
Statistical analysis
GRS calculation
Associations of GRS with postmortem pathology and cognitive decline
Associations of GRS with study outcomes were modeled using iterated re-weighted least squares, from the“MASS” R package [27]. The iterated weighted least squares re-gression technique employed here provides effect esti-mates robust to outliers by assigning weights to each observation and iteratively fitting Huber M-estimators [28]. All models of neuropathology co-varied for age at death, sex, postmortem interval, and the top three EIGENSTRAT principal components [29]. Tests were cor-rected using Benjamini & Hochberg’s false discovery rate (FDR) procedure [30]. Significant associations (two-sided
PFDR< 0.05) were analyzed further to determine region and activation stage-specific effects on microglial density. All variants within each significantly associated GRS (with minor allele frequency > 0.1) were then tested individually.
Overlap between variants affecting microglial density and gene module expression
To compare effects of risk variants on microglial density vs. effects of the same risk variants on gene module ex-pression, the -log(P-value) for each variant’s effect on both phenotypes were multiplied by their allelic direc-tions of effect (+ 1 or−1) and tested for association using Spearman rank correlations. Thus, whole sets of variants, grouped by the GRS to which they contribute, could be tested for synergistic effects on both microglial density and gene module expression. Correlation coeffi-cients were calculated separately for each GRS and mod-ule combination, where positive ρ values indicate a tendency for variants within a given GRS to influence both microglial density and gene module expression in concordant directions. The ranks of these coefficients for the five immune modules were then evaluated for significance by calculating the probability that the lowest of five randomly selected ranks would be equal to the lowest observed rank by chance alone (see Additional file1: Supplementary Methods).
Results
The RA but not the MS GRS is associated with cognitive decline and postmortem neuropathology
Table 2 summarizes the demographic characteristics of the ROS/MAP participants that were included in our analyses. In comparing the GRS to one another, we found a modest correlation between the RA and MS scores (Spearman ρ=−0.13, Puncor= 2.29 × 10⁻⁸), as ex-pected given the documented sharing of susceptibility loci between the two diseases (see Additional file 1: Figure S1).
After FDR correction, both the AD GRS including (AD+APOE) and excluding (AD-APOE) the APOE ɛ4 risk haplotype were significantly associated with faster de-cline in all cognitive domains proximal to death (min
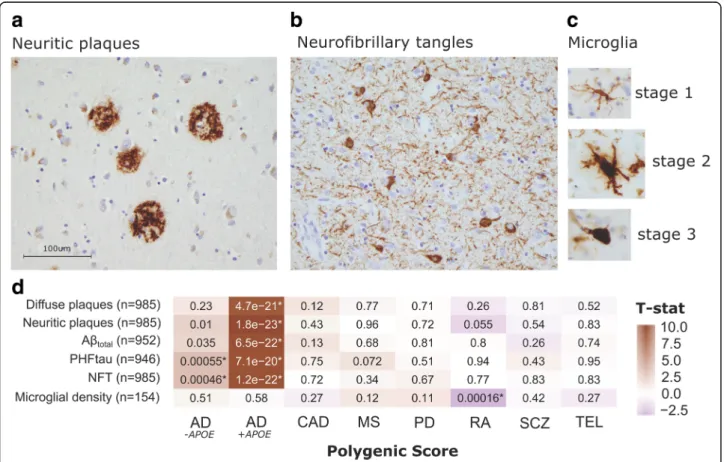
Puncor< 1 × 10⁻¹⁶), but no other GRS demonstrated significant associations (Fig. 1). The AD+APOE GRS was also strongly associated with both amyloid (4.7 × 10⁻²¹>
Puncor> 1.8 × 10⁻²³) and tau (7.1 × 10⁻²⁰>Puncor> 1.2 × 10⁻²²) phenotypes; whereas the AD-APOE GRS was only associated with tau measures (5.5 × 10⁻⁴>Puncor> 5.5 × 10⁻⁴) (Fig. 2). There were no associations of either AD GRS with microglial counts, confirming findings previ-ously reported in these and other cohorts. [5,31] Across all other scores, only the RA GRS was significantly asso-ciated with brain-wide microglial density after correc-tion: an increase in liability for RA was associated with a decrease in microglial density (t146=−3.88, Puncor=
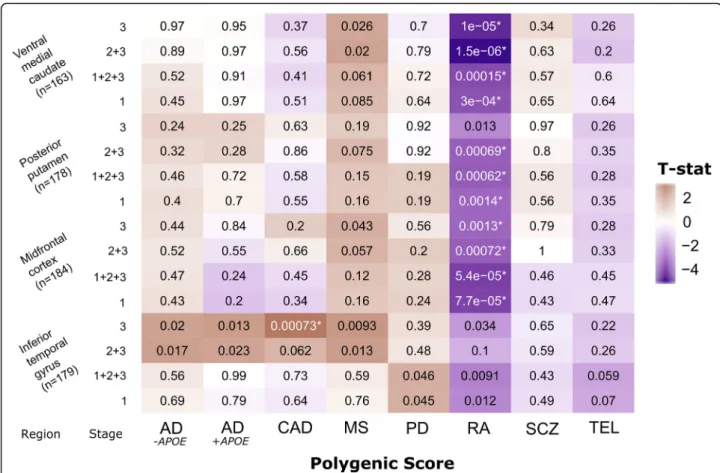
1.6 × 10⁻⁴) (Fig. 2). We then accessed our more detailed microglial data and repeated the analyses to test for the effects of each GRS on microglial count density across each brain region and stages of microglial activation. We found that the effect of the RA GRS is widely distrib-uted, being present in multiple brain regions and stages of activation (1.4 × 10⁻³>Puncor> 1.5 × 10⁻⁶). In addition, significant (CAD; t171= 3.44, Puncor= 7.3 × 10⁻⁴) and
sug-gestive (MS and AD) associations, particularly in relation to the activated stage 3 microglia, were noted in the infer-ior temporal gyrus (Fig.3).
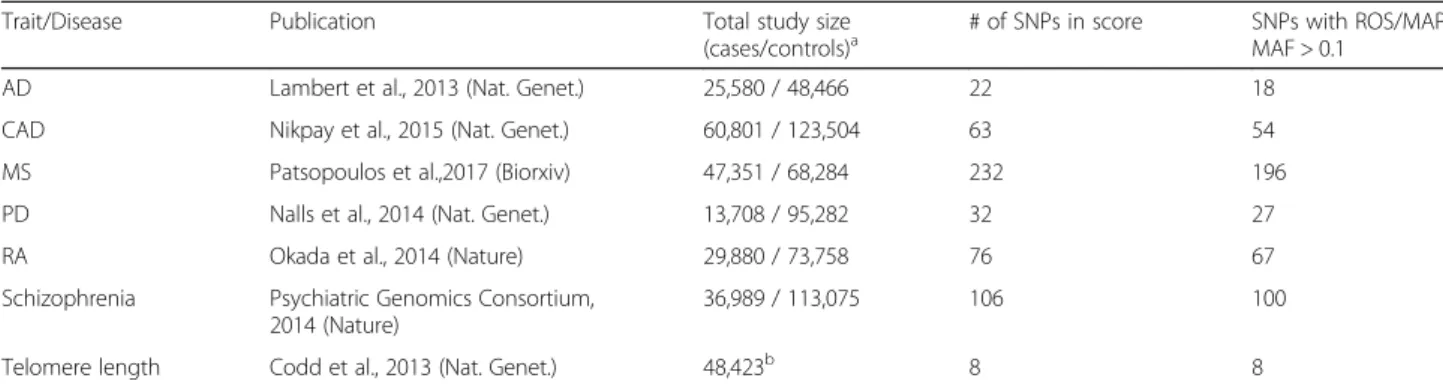
Table 1Summary of Studies Used to Derive Polygenic Scores
Trait/Disease Publication Total study size
(cases/controls)a # of SNPs in score SNPs with ROS/MAPMAF > 0.1
AD Lambert et al., 2013 (Nat. Genet.) 25,580 / 48,466 22 18
CAD Nikpay et al., 2015 (Nat. Genet.) 60,801 / 123,504 63 54
MS Patsopoulos et al.,2017 (Biorxiv) 47,351 / 68,284 232 196
PD Nalls et al., 2014 (Nat. Genet.) 13,708 / 95,282 32 27
RA Okada et al., 2014 (Nature) 29,880 / 73,758 76 67
Schizophrenia Psychiatric Genomics Consortium, 2014 (Nature)
36,989 / 113,075 106 100
Telomere length Codd et al., 2013 (Nat. Genet.) 48,423b
8 8
a
Study size represents all subjects analyzed, regardless of study design (i.e. case/control, meta-analysis, and family-based designs) or analysis stage.
b
Individual variants drive GRS associations with microglial density
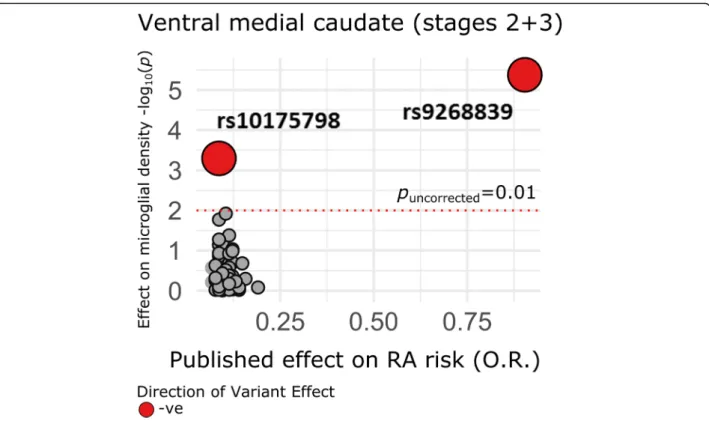
To understand what drives the association of the RA and CAD GRS with microglial phenotypes, we analyzed individual variants contributing to each GRS. For CAD, rs4977574 (chr. 9) alone drove the GRS association, and, for RA, two variants, rs9268839 (chr. 6) and rs10175798 (chr. 2), were responsible (Fig.4). After removal of these two top RA GRS variants and re-calculation of the RA score, we found no association with total microglial density (P= 0.74) nor with any of the region- or stage-specific measures (0.23 >P< 0.88). The more
strongly associated RA variant, rs9268839, is found in the Human Leukocyte Antigen (HLA) class II region and is also the strongest RA susceptibility variant in Europeans (O.R. = 2.47, C.I.95%= [2.39,2.55], Pmeta=
1.5 × 10−300) [32]. Therefore, upweighting of this variant in the calculation of the RA GRS biased its effect on microglial density (Additional file 1: Figure S3). In the CAD GRS, a similar pattern was observed: rs4977574 drives the association and is the strongest hit in the CAD genome-wide association study (O.R. = 1.21, C.I.95%
= [1.19,1.24], Pmeta= 2.29 × 10−98) [33] (Additional file 1: Figure S4).
Table 2Sample Sizes and Characteristics for Each Analysis
Phenotype N Mean SD Min Max
Neuritic Plaques 985 0.86 0.85 0.00 5.04
Diffuse Plaques 0.73 0.77 0.00 4.61
Neurofibrillary Tangles 0.63 0.76 0.00 6.23
Sex (F/M) 641/344 – – –
APOEε4 status (−/+) 723/262 – – –
Age at death 89.06 6.39 66.22 108.28
Dx at last visit (CN/MCI/AD/other) 319/237/343/86 – – –
PMI 8.57 7.59 0.00 85.08
Total Amyloid 952 4.21 4.20 0.00 19.93
Sex (F/M) 617/335 – – –
APOEε4 status (−/+) 697/255 – – –
Age at death 88.95 6.38 66.22 108.28
Dx at last visit (CN/MCI/AD/other) 309/230/329/84 – – –
PMI 8.52 7.57 0.00 85.08
Total PHF-Tau 946 6.43 7.70 0.00 78.52
Sex (F/M) 615/331 – – –
APOEε4 status (−/+) 694/252 – – –
Age at death 88.91 6.38 66.22 108.28
Dx at last visit (CN/MCI/AD/other) 312/228/326/80 – – –
PMI 8.47 7.56 0.00 85.08
Microglial Density (all regions) 154 191.02 54.88 48.30 348.64
Sex (F/M) 96/58 – – –
APOEε4 status (−/+) 117/37 – – –
Age at death 89.50 5.15 74.83 101.19
Dx at last visit (CN/MCI/AD/other) 51/41/58/4 – – –
PMI 7.36 5.97 2.50 54.50
Cognition 1601 −0.01 0.09 −0.48 0.17
Sex (F/M) 1113/488 – – –
APOEε4 status (−/+) 1 594a
1186/408 – – –
Age at baseline evaluation 1601 86.50 6.81 60.15 108.15
Dx at last visit (CN/MCI/AD/other) 700/357/436/108 – – –
Note: All values of N are given for samples that have data for both the specified phenotype and genome-wide genotypes.
a
In ROS/MAP cortical RNA and GTEx, the top variant influ-encing microglial density for the RA score (rs9268839,Puncor = 2.48 × 10⁻⁵) influences HLA class II expression (see Additional file 1: Supplementary Methods). The top CAD SNP, rs4977574, has no cis-eQTL effects in these data but has been reported to influenceVIL2in blood (P= 6.1 × 10⁻⁶) [34].
Variants affecting microglial density also tend to affect expression of immune gene modules
Another approach to exploring the role of GRS in the aging brain involves assessing their effects on the cor-tical transcriptome of ROS/MAP participants, using the 47 modules of co-expressed genes previously defined in
Fig. 1Analysis of GRS vs. cognitive decline slopes (n= 1601). Two-sided uncorrectedP-values derived from robust regression are shown within tiles. Models co-varied for age at initial assessment, sex, years of education, and three EIGENSTRAT principal components. The color scale indicates
magnitude and direction of the effect T-statistic. *significant after FDR correction (PFDR< 0.05)
Fig. 2Analysis of GRS vs. aggregate AD-related pathologies and microglial density. Immunohistochemistry images showing (a) neuritic amyloid
plaques (stained with 4G8), (b) neurofibrillary (tau) tangles (stained with AT8), and (c) microglia at three stages of activation (stained with CR3–43)
in our postmortem tissue samples. (d) Two-sided uncorrectedP-values derived from robust regression are shown within tiles. Models co-varied
for age at death, sex, and three EIGENSTRAT principal components. The color scale indicates magnitude and direction of the effect T-statistic.
these individuals [23]. Additional file 1: Figure S5A shows the results of the direct association of each gene module’s expression with each GRS. After cor-rection, this analysis yielded no significant results overall; however, 17 correlations exceeded Puncor< 0.05. Evaluating gene module expression directly against midfrontal microglia density (stages 1 + 2 + 3), only module #118 had a significant effect after cor-rection (t94=−3.60, Puncor= 5.1 × 10⁻⁴), whereby
in-creased expression was associated with a decrease in microglial density (Additional file 1: Figure S5B). To evaluate the intersection of gene variant effects on both microglial density and gene expression, Spear-man correlations of variant effects on both outcomes were evaluated within each GRS. Again, no results were significant after correction, largely due to a sparsity of individually significant associations of GRS SNPs with either microglial density or module expres-sion. Nonetheless, our exploratory findings suggest a possible tendency for variants which affect microglial density to also influence immune module expression (See Additional file 1: Figure S7, Additional file 1: Supplementary Results).
Discussion
We show that polygenic risk burden for RA and CAD significantly impact microglial count density, in different regions and at different stages of activation, in postmor-tem brain of elderly individuals. However, these associa-tions were driven by only one or two variants within each GRS, highlighting a key limitation in the use of polygenic risk models of complex traits. In joint analyses of GRS, microglial densities, and RNA sequencing from the frontal cortex, we found no significant direct associa-tions between GRS and immune gene module expres-sion. However, when evaluating pleiotropy among GRS variants, microglial density and immune gene expres-sion, we noted significant associations of MS, CAD, and RA risk variants with brain-wide microglial density and expression of at least one immune module. In parallel, a high genetic MS burden was linked to a loss of modules that are enriched for neuronal or mitochondrial genes, suggesting that it may play a role in exacerbating the dysfunction or loss of neurons or their transcriptional programs.
Several GRS tested showed effects in the directions ex-pected based on existing literature: both the AD+APOE
Fig. 3Analysis of GRS vs. microglial densities across four regions for each measured stage of activation. Two-sided uncorrectedP-values derived from robust regression are shown within tiles. Models co-varied for age at death, sex, and three EIGENSTRAT principal components. The color
and AD-APOEGRS were significantly associated with cog-nitive decline at corrected thresholds, but, interestingly, the AD-APOE GRS was only significantly associated with tau-related neuropathology, complimenting existing evi-dence from in vivo PET imaging and CSF analyses show-ing an effect of APOE ε4 on amyloid- but not tau-related biomarkers in healthy elderly [35]. While our observed association of the CAD GRS with microglial density in the inferior temporal cortex was not expected, the variant driving this association, rs4977574, is in high linkage disequilibrium (r2= 0.89) with another variant, rs1333049, that has been associated at genome-wide sig-nificance with risk for ischemic stroke [36]. It is possible that the overlapping susceptibility at this locus for CAD and stroke drives cerebrovascular changes that lead to the recruitment and activation of microglia. Analyses of regional interactions between microglia density and other types of brain pathology, such as silent infarction, is beyond the scope of our current study and is a topic of future interest. For our observed association of the RA GRS with microglia across multiple activation stages, there appears to be little regional specificity other than that the association is much less pronounced is the in-ferior temporal gyrus. Interestingly, this region is the earliest affected in AD [37] and appears to behave
differently from the other three brain regions in our ana-lyses: it harbors additional, significant (CAD) and sug-gestive (MS and AD) associations in secondary analyses, particularly in relation to the activated, stage 3 microglia. Finally, we note that, while we elected to use an FDR-based correction in our original analysis plan, our main results also meet more conservative thresholds of significance, such as Bonferroni correction.
Many tests revealed a lack of GRS effects on our out-comes: for example, the schizophrenia GRS was not asso-ciated with any measure of cognitive decline or neuropathology. This seemingly contradicts previous evi-dence of increased HLA-DR+ microglia in brains of schizophrenia patients compared to age-matched controls [38]. Our lack of association of schizophrenia GRS with microglial density in any area and at any stage of activa-tion suggests that the mechanism behind aberrant micro-glial recruitment in the schizophrenia brain is less likely to be due to schizophrenia-specific genetic risk factors; ra-ther, it may be driven by environmental factors or be a consequence of processes downstream of the onset of schizophrenia. In addition, for telomere length variants, we find a lack of association with AD pathology or cogni-tive decline, in contrast to a recent meta-analysis finding that AD patients have shorter telomeres than controls
Fig. 4Analysis of individual variants in the RA GRS on microglial density in the ventral medial caudate. Published effect sizes on the x-axis have been transformed using a natural logarithm and oriented in the positive direction to align allelic effects (color denotes direction of effect on
microglial density).P-values (uncorrected) are two-sided and derived from robust iterated re-weighted least squares regression models, co-varying
[39], as well as Mendelian randomization analyses sug-gesting causal links between telomere length and AD [40]. Also, our top signals for association across all GRS (in-cluding RA) localized to the MHC region, which influ-ences many immune traits, and resolving the mechanism of this association to the HLA class II region within the MHC will be difficult given the extensive linkage disequi-librium that exists in this unique genomic region [41].
The main limitation of our GRS is that they were de-rived from lists of genome-wide significant loci only. We chose this approach due to (1) the lack of unrestricted availability of full summary statistics for all diseases tested, and (2) validity assumptions of individual variant analyses. If many variants well below genome-wide significance from each GWAS were included in our GRS calculations, then post-hoc associations of individual variants may not be relevant in the context of risk for the disease of interest. Moreover, our post-mortem measure of microglial activa-tion is based on morphologic criteria and is subject to error associated with misclassification of individual cells to specific microglial stages of activation. However, by analyzing multiple binned groups of microglia by stage in our detailed analyses, the confounding of misclassification over the spectrum of groups has likely been mitigated. Also, the challenge of objectively classifying microglial ac-tivation states is not unique to our study; microglial sta-ging is an active field of investigation [42].
Conclusions
Together, our findings demonstrate limited links between microglial activation and liability for archetypal inflamma-tory diseases of both the central nervous system (MS) and periphery (RA). Thus, the immune dysfunction involved in AD susceptibility seems to be largely distinct from those genes and pathways that are involved in susceptibil-ity to inflammatory disease in young and middle-aged adults. Nonetheless, we have uncovered a handful of vari-ants that have strong effects on both inflammatory disease risk and microglial density, which informs our under-standing of human microglial biology in aging which re-mains poorly understood today.
Additional file
Additional file 1:Supplementary Methods, Results, and Figures. (DOCX 1972 kb)
Abbreviations
AD:Alzheimer’s disease; Aβ: Amyloid beta; CAD: Coronary artery disease;
CSF: cerebrospinal fluid; eQTL: Expression quantitative trait locus/loci; FDR: False discovery rate; FPKM: Fragments per kilobase per million reads; GRS: Genetic risk score; GWAS: Genome-wide association study; HLA: Human leukocyte antigen; MAP: Memory and Aging Project; MHC: Major
histocompatibility complex; MS: Multiple sclerosis; PD: Parkinson’s disease;
PET: Positron emissions tomography; PMI: Postmortem interval; RA: Rheumatoid arthritis; ROS: Religious Orders Study
Acknowledgements
We thank the participants in the Religious Orders Study and the Rush Memory and Aging Project.
Funding
This study was supported by NIH grants P30AG10161, R01AG15819, R01AG17917, R01AG30146, R01NS084965, the Illinois Department of Public Health, and the Translational Genomics Research Institute. D.F. is supported by a Canadian Institutes of Health Research Postdoctoral Fellowship. No funding source played a role in the design or analysis of the study, nor was involved in the writing of the manuscript.
Availability of data and materials
The datasets generated and/or analysed during the current study are
available in the Rush Alzheimer’s Disease Center Resource Sharing Hub
(https://www.radc.rush.edu/).
Authors’contributions
DF was responsible for study design, data management and pre-processing, all statistical analyses, and writing of the manuscript. EP contributed to the study design, post-processing of RNA sequencing data, and manuscript editing. JAS was responsible for overseeing neuropathological data acquisition, ensuring quality control of the data, and editing the final manuscript. SM and CG were responsible for calculating gene module meta-feature values and editing final manuscript. NP contributed HLA region imputed data as well as important information regarding MS risk variants. DAB contributed to the study design and manuscript editing, as well as facilitating collaboration between study sites. PLDJ contributed to the study design, evaluation of results, and writing of the manuscript. All authors read and approved the final manuscript.
Ethics approval and consent to participate
The Institutional Review Board of Rush University Medical Center approved study protocols and all subjects provided informed, written consent, and signed an Anatomical Gift Act.
Consent for publication Not applicable.
Competing interests
The authors declare that they have no competing interests.
Publisher’s Note
Springer Nature remains neutral with regard to jurisdictional claims in published maps and institutional affiliations.
Author details
1
Center for Translational and Computational Neuroimmunology, Department of Neurology, Columbia University Medical Center, 630 West 168th Street, PH 19–302, New York, NY 10032, USA.2Department of Neurology, Brigham and Woman’s Hospital, 75 Francis Street, Boston, MA 02115, USA.3Department of Neurology, Harvard Medical School, 25 Shattuck Street, Boston, MA 02115, USA.4Program in Population and Medical Genetics, Broad Institute of MIT and Harvard, 415 Main St, Cambridge, MA 02142, USA.5Department of Statistics, University of Sydney, Camperdown, NSW 2006, Australia. 6
Department of Neurology, Rush University Medical Center, 1653 West Congress Parkway, Chicago, IL 60612, USA.7Rush Alzheimer’s Disease Center, Rush University Medical Center, 600 South Paulina Street, Chicago, IL 60612, USA.8Department of Statistics, University of British Columbia, 2329 West Mall, Vancouver, BC V6T 1Z4, Canada.
Received: 10 November 2017 Accepted: 13 July 2018
References
1. Parkes M, Cortes A, van Heel DA, Brown MA. Genetic insights into common
pathways and complex relationships among immune-mediated diseases.
Nat Rev Genet. 2013;14:661–73.
2. Raj T, Rothamel K, Mostafavi S, Ye C, Lee MN, Replogle JM, et al. Polarization
of the effects of autoimmune and neurodegenerative risk alleles in
3. Bradshaw EM, Chibnik LB, Keenan BT, Ottoboni L, Raj T, Tang A, et al. CD33
Alzheimer’s disease locus: altered monocyte function and amyloid biology.
Nat Neurosci. 2013;16:848–50.
4. Huang K, Marcora E, Pimenova A, Narzo AD, Kapoor M, Jin SC, et al. A
common haplotype lowers PU.1 expression in myeloid cells and delays onset of Alzheimer's disease. Nat Neurosci. 2017;8;1052-61.
5. Beecham GW, Hamilton K, Naj AC, Martin ER, Huentelman M, Myers AJ, et al.
Genome-wide association meta-analysis of Neuropathologic features of
Alzheimer’s disease and related dementias. PLoS Genet. 2014;10:e1004606.
6. De Jager PL, Shulman JM, Chibnik LB, Keenan BT, Raj T, Wilson RS, et al. A
genome-wide scan for common variants affecting the rate of age-related
cognitive decline. Neurobiol Aging. 2012;33:1017.e1–15.
7. Chibnik LB, White CC, Mukherjee S, Raj T, Yu L, Larson EB, et al. Susceptibility
to neurofibrillary tangles: role of the PTPRD locus and limited pleiotropy
with other neuropathologies. Mol Psychiatry. 2017;23(6):1521–9.
8. Chou RC, Kane M, Ghimire S, Gautam S, Gui J. Treatment for rheumatoid
arthritis and risk of Alzheimer’s disease: a nested case-control analysis. CNS
Drugs. 2016;30:1111–20.
9. Dal Bianco A, Bradl M, Frischer J, Kutzelnigg A, Jellinger K, Lassmann H.
Multiple sclerosis and Alzheimer’s disease. Ann Neurol. 2008;63:174–83.
10. Schizophrenia Working Group of the Psychiatric Genomics Consortium.
Biological insights from 108 schizophrenia-associated genetic loci. Nature.
2014;511:421–7.
11. Bennett DA, Schneider JA, Arvanitakis Z, Wilson RS. Overview and findings
from the religious orders study. Curr Alzheimer Res. 2012;9:628–45.
12. Bennett DA, Schneider JA, Buchman AS, Barnes LL, Boyle PA, Wilson RS.
Overview and findings from the rush memory and aging project. Curr
Alzheimer Res. 2012;9:646–63.
13. Bennett DA, Yu L, De Jager PL. Building a pipeline to discover and validate
novel therapeutic targets and lead compounds for Alzheimer’s disease.
Biochem Pharmacol. 2014;88:617–30.
14. Browning BL, Browning SR. A unified approach to genotype imputation and
haplotype-phase inference for large data sets of trios and unrelated
individuals. Am J Hum Genet. 2009;84:210–23.
15. Jia X, Han B, Onengut-Gumuscu S, Chen W-M, Concannon PJ, Rich SS, et al.
Imputing amino acid polymorphisms in human leukocyte antigens. PLoS One. 2013;8:e64683.
16. Bennett DA, Wilson RS, Boyle PA, Buchman AS, Schneider JA. Relation of
neuropathology to cognition in persons without cognitive impairment. Ann
Neurol. 2012;72:599–609.
17. Bennett DA, Wilson RS, Schneider JA, Evans DA, Beckett LA, Aggarwal NT, et
al. Natural history of mild cognitive impairment in older persons. Neurology.
2002;59:198–205.
18. Johnson WE, Li C, Rabinovic A. Adjusting batch effects in microarray expression
data using empirical Bayes methods. Biostat Oxf Engl. 2007;8:118–27.
19. Ng B, White CC, Klein HU, Sieberts SK, McCabe C, Patrick E, et al. Brain xQTL
Map: Integrating The Genetic Architecture Of The Human Brain Transcriptome And Epigenome. bioRxiv. 2017;142927
20. Lonsdale J, Thomas J, Salvatore M, Phillips R, Lo E, Shad S, et al. The
genotype-tissue expression (GTEx) project. Nat Genet. 2013;45:580–5.
21. The GTEx Consortium. The genotype-tissue expression (GTEx) pilot analysis:
multitissue gene regulation in humans. Science. 2015;348:648–60.
22. Gaiteri C, Chen M, Szymanski B, Kuzmin K, Xie J, Lee C, et al. Identifying
robust communities and multi-community nodes by combining top-down and bottom-up approaches to clustering. ArXiv150104709 Phys Q-Bio
[Internet]. 2015 [cited 2015 Sep 13]; Available from:http://arxiv.org/abs/
1501.04709
23. Mostafavi S, Gaiteri C, Sullivan S, White C, Takasi S, Xu J, et al. A molecular
network of the aging brain implicates INPPL1 and PLXNB1 in Alzheimer’s
disease. bioRxiv. 2017;205807
24. Olah M, Patrick E, Villani A-C, Xu J, White CC, Ryan KJ, et al. A transcriptomic
atlas of aged human microglia. Nat Commun. 2018;9:539.
25. Patrick E, Olah M, Taga M, Klein H-U, Xu J, White CC, et al. A cortical
immune network map identifies a subset of human microglia involved in Tau pathology. bioRxiv. 2017;234351
26. Purcell S, Neale B, Todd-Brown K, Thomas L, Ferreira MAR, Bender D, et al.
PLINK: a tool set for whole-genome association and population-based
linkage analyses. Am J Hum Genet. 2007;81:559–75.
27. R Core Team. R: A language and environment for statistical computing
[Internet]. Vienna: Vienna, Austria: R Foundation For Statistical Computing;
2014. Available from:http://www.r-project.org/
28. Huber PJ. Robust statistics [Internet]. 1981 [cited 2017 May 2]. Available
from:https://zbmath.org/?q=an:0536.62025
29. Price AL, Patterson NJ, Plenge RM, Weinblatt ME, Shadick NA, Reich D.
Principal components analysis corrects for stratification in genome-wide
association studies. Nat Genet. 2006;38:904–9.
30. Benjamini Y, Hochberg Y. Controlling the false discovery rate: a practical
and powerful approach to multiple testing. J R Stat Soc Ser B Methodol.
1995;57:289–300.
31. Mormino EC, Sperling RA, Holmes AJ, Buckner RL, De Jager PL, Smoller JW,
et al. Polygenic risk of Alzheimer disease is associated with early- and
late-life processes. Neurology. 2016;87:481–8.
32. Okada Y, Wu D, Trynka G, Raj T, Terao C, Ikari K, et al. Genetics of
rheumatoid arthritis contributes to biology and drug discovery. Nature.
2014;506:376–81.
33. Nikpay M, Goel A, Won H-H, Hall LM, Willenborg C, Kanoni S, et al. A
comprehensive 1000 genomes-based genome-wide association
meta-analysis of coronary artery disease. Nat Genet. 2015;47:1121–30.
34. Fehrmann RSN, Jansen RC, Veldink JH, Westra H-J, Arends D, Bonder MJ, et
al. Trans-eQTLs reveal that independent genetic variants associated with a complex phenotype converge on intermediate genes, with a major role for the HLA. PLoS Genet. 2011;7:e1002197.
35. Morris JC, Roe CM, Xiong C, Fagan AM, Goate AM, Holtzman DM, et al.
APOE predicts amyloid-beta but not tau Alzheimer pathology in cognitively
normal aging. Ann Neurol. 2010;67:122–31.
36. Dichgans M, Malik R, König IR, Rosand J, Clarke R, Gretarsdottir S, et al.
Shared genetic susceptibility to ischemic stroke and coronary artery disease:
a genome-wide analysis of common variants. Stroke. 2014;45:24–36.
37. Braak H, Braak E. Neuropathological stageing of Alzheimer-related changes.
Acta Neuropathol (Berl). 1991;82:239–59.
38. Radewicz K, Garey LJ, Gentleman SM, Reynolds R. Increase in HLA-DR
Immunoreactive microglia in frontal and temporal cortex of chronic
schizophrenics. J Neuropathol Exp Neurol. 2000;59:137–50.
39. Forero DA, González-Giraldo Y, López-Quintero C, Castro-Vega LJ, Barreto
GE, Perry G. Meta-analysis of telomere length in Alzheimer’s disease. J
Gerontol A Biol Sci Med Sci. 2016;71:1069–73.
40. Zhan Y, Song C, Karlsson R, Tillander A, Reynolds CA, Pedersen NL, et al.
Telomere length shortening and Alzheimer disease—a Mendelian
randomization study. JAMA Neurol. 2015;72:1202–3.
41. Shiina T, Hosomichi K, Inoko H, Kulski JK. The HLA genomic loci map:
expression, interaction, diversity and disease. J Hum Genet. 2009;54:15–39.
42. Boche D, Perry VH, Nicoll J. a. R. Review: activation patterns of microglia and
their identification in the human brain. Neuropathol Appl Neurobiol. 2013;
39:3–18.
43. Codd V, Nelson CP, Albrecht E, Mangino M, Deelen J, Buxton JL, et al.
Identification of seven loci affecting mean telomere length and their