Abstract— In today’s era detection of security threats that
are commonly referred to as intrusion, has become a very important and critical issue in network, data and information security. In recent times data mining and machine learning have been researched extensively for intrusion detection with the aim of improving the accuracy of detection classifier. KDD CUP’ 99 Data set is the most widely used dataset in research domain. Selecting important feature on the basis of feature selection approach have lead to a simplification of the problem, faster and more accurate detection rates. In this paper, we presented an efficient approach for detecting relevant features from the KDD CUP’99 Data set using subspace method.
Index Terms— Intrusion detection, KDD CUP 99 intrusion
detection Data set, Subspace Method.
I. INTRODUCTION
Internet and other area network are growing at a fast rate in current years, not just terms of shape and size, but also term of different changing the services offered. But some time is cyber-attacks by hackers and crackers misusing the internet protocol, important data and services. Several Protective techniques have been developed and implement to protect the computer system against the cyber-attack such as antivirus, firewall, encryption technique and other various protective measures. Even with all the techniques could not guarantee the full protection of the system. Hence, the need for a more active mechanism likes Intrusion Detection system (IDS) anext track of defense [13]. So the progressive use of intrusion detection system for handling the anomalies on web has caused multiple efforts arranged by the analysts. The intrusions have been found domination the internet which may be assumed as a threat to the security of authorized users. In order to meet the advantage of changing technological world, IDS has been implemented through various amendments where it is able to detecting intrusion exactly. Therefore, intrusion detection is becoming increasingly important technique that deployed to monitor and find out the abnormal condition in the network system and identifies network intrusion such as anomalous network behavior, unauthorized network access, or malicious attack to computer system.
Intrusion detection can be categorized into two main approaches used misuse detection and second, anomaly detection. In Misuse detection, attacks can be represented in the form of pattern or a signature in order to detect or prevent same attack in future. In anomaly detection category,
deviation of normal usage behavior pattern is identified in order to correctly detect the intrusion [10].
Pattern reorganization problem can be handled by intrusion detection system and it can also be classified as learning system. Selecting relevant feature is an important problem in learning systems. We proposed that selecting important attribute is useful for dimensionality reduction of training data sets. Speed of data manipulation and classification rate can be improved by reducing the influence of noise. Performance factor, such as, accuracy of classification is maximized in order to achieve exactly and find a feature subset by using the concept of feature selection [9]. Feature selection is not an important issue in research domain. Selecting important features by using rough set theory makes the problem simple, faster and more accurate for detection rates. This paper explores feature selection KDD cup 99 data set by using concept of rough set theory. This paper organized as follow: Section 2 present basic concept and methodology, explain proposed approach, Section 3 present KDD CUP 99 Dataset, Section 4 consist experiments result, finally conclusion and future work is mentioned in Section 5.
.
II. METHODOLOGY
In many cases, network data sets can be modeled as high-dimensional connection oriented records each of which contains a number of features to measure the quantitative behaviors of the network traffic, as in the 1999 KDD CUP anomaly detection application. A salient characteristics of high-dimensional data is that almost all the anomalies are embedded in some lower-dimensional subspaces (spaces consisting of a subset of attributes) due to the so-called Curse of Dimensionality. These anomalies are termed subspace anomalies in the high-dimensional space context. As the dimensionality of data goes up, data tend to be equally distant from each other. As a result, the difference of data points outlier-ness will become increasingly weak and thus undistinguishable. Only in projected or low dimensional subspaces can significant outlier-ness of data be observed. Problem Definition
The problem of detecting subspace anomalies from high-dimensional data can be formulated as follows: given a data D with a potentially unbounded size of n-dimensional data points, each data point P = {Pi1; Pi2; . . . . Pin} in D will be labeled as either a subspace anomaly if it is found abnormal in one or more subspaces. It will be flagged as a regular data
Efficient Subspace Analysis
for Anomaly
Detection
otherwise. If Pi is a subspace anomaly, its associated outlying subspace(s) will be presented as well in the result.[11] Preprocessing
Since information gain is calculated for discrete features, continuous features should be discredited. To this end, continuous features are partitioned into equalized partitions by utilizing equal frequency intervals [8,9]. In equal frequency intervals method, the feature space is partitioned into arbitrary number of partitions where each partition contains the same number of data points. That is to say, the range of each partition is adjusted to contain N dataset instances. If a value occurs more than N times in a feature space, it is assigned a partition of its own. In “10% KDD” dataset, certain classes such as denial of service attacks and normal connections occur in the magnitude of hundreds of thousands whereas other classes such as R2L and U2R attacks occur in the magnitude of tens or hundreds. Therefore, to provide sufficient resolution for the minor classes N is set to 10, (i.e. maximum 50,000 partitions). Study of feature selection methods
A number of feature selection algorithms are proposed by various authors. The aim of this work is to examine the various existing attribute selection methods in terms of detection rate andcomputational time.Out of the total 41 network traffic features, used in detecting intrusion, some features will be potential in detecting intrusions. Therefore the predominant features are extracted from the 41 features that are really effective in detecting intrusions.
Attribute evaluators: Attribute evaluator is basically used for ranking all the features according to some metric. Various attribute evaluators are available in WEKA. We used (Weka, 3.9.8) a learning machine tool in this work which includes ChiSquaredAttributeEval, InfoGainAttributeEval and GainRatioAttributeEval. ChiSquaredAttributeEval: Evaluates the worth of an attribute by computing the value of the chi-squared statistic with respect to the class.
GainRatioAttributeEval: Evaluates the worth of an attribute by measuring the gain ratio with respect to the class. InfoGainAttributeEval: Evaluates the worth of an attribute by measuring the information gain with respect to the class. Subspace Analysis
Attributes given by feature selection methods are given to subspace clustering algorithm to detected anomalies in the data. As we form subspaces using highly influencing attributes which contributes more outliers so that we get all missing or hidden outliers. This over all process is very effective and efficient to detect hidden or missing outliers. The computational speed of the process is also high because we only consider the selected and relevant attributes.[1,2]
III. KDD CUP 99 DATA SET DESCRIPTION
KDD Cup‟99 dataset used for benchmarking intrusion detection problem is used in our experiment. These are generated by processing the tcpdump segment of DARPA 1998 evaluation data set. This data set consists of 41 feature and separate feature (42nd feature) that labels the connection as „normal‟ or a type of attack [12]. The data set contains a total of 23 attack, these are grouped into 4 major categories: 3.1. Denial-of-Service (DoS)
In Denial-of-service attack, the attacker has the goal of limiting or denying service provided to the user, computer or network. Attacker tries to prevent genuine users from using a service. It is usually done by making the resources either too busy or too full and overflow.
3.2. Probing or Surveillance
Probing or Surveillance attacks have the main aim of gaining knowledge of the existence or configuration of a computer system or the network. The attacker then tries to harm or retrieve information about resources of the victim network. 3.3. User-to-Root (U2R)
User-to-root attack is attempts by an unauthorized user to gain administrative privileges. The attacker starts outs with access to a normal user account on the system (perhaps gained by sniffing password, a dictionary attack, or social engineering) and is able to exploit some vulnerability to gain root access to the system.
3.4. Remote-to-Local (R2L)
Remote-to-local attack is the kind of intrusion attack where the remote intruder consistently sends packets to a local machine over a network but who does not have an account on that machine exploits some vulnerability to gain local access as a user of that machine.
In training data set, 23 attack that appears which is organized into 5 major class labels those are given Table 1 below such as normal, R2L, U2R, Probe and DoS.
KDD‟99 features can be classified into three groups: 1) Basic features: this category encapsulates all the attributes that can be extracted from a TCP/IP connection. Most of these features leading to an implicit delay in detection. 2) Traffic features: this category includes features that are computed with respect to a window interval and is divided into two groups:
a) “same host” features: examine only the connections in the past 2 seconds that have the same destination host as the current connection, and calculate statistics related to protocol behavior, service, etc.
b) “same service” features: examine only the connections in the past 2 seconds that have the same service as the current connection.
The two aforementioned types of “traffic” features are called time-based. However, there are several slow probing attacks that scan the hosts (or ports) using a much larger time interval than 2 seconds, for example, one in every minute. As a result, these attacks do not produce intrusion patterns with a time window of 2 seconds. To solve this problem, the “same host” and “same service” features are re-calculated but based on the connection window of 100 connections rather than a time window of 2 seconds. These features are called connection-based traffic features.
3) Content features: unlike most of the DoS and Probing attacks, the R2L and U2R attacks don‟t have any intrusion frequent sequential patterns. This is because the DoS and Probing attacks involve many connections to some host(s) in a very short period of time; however the R2L and U2R attacks are embedded in the data portions of the packets, and normally involves only a single connection. To detect these kinds of attacks, we need some features to be able to look for suspicious behavior in the data portion, e.g., number of failed login attempts. These features are called content features. Table 1. List of attacks and their count
Normal Probe DOS U2R R2L Total
97280 4107 391458 52 1124 494020
.
Fig1. Visual Comparison of normal data and attacks
IV. EXPERIMENTAL RESULT AND ANALYSIS
The Experiment is performed in Weka The processor used is intel core i7 and memory required 512 MB. The input data set used is KDD CUP 99 and rough set based approach is applied for selecting the optimal feature among the given 41 feature from 10% KDD CUP‟99 Data set. Figure 1 shows the training dataset consisted of 494,021 records among which 92,277 (19.69%) were normal, 391,458 (79.24%) DoS, 4,107 (0.83%) probe, 1,126 (0.23%) R2L and 52 (0.01%) U2R connections [12].
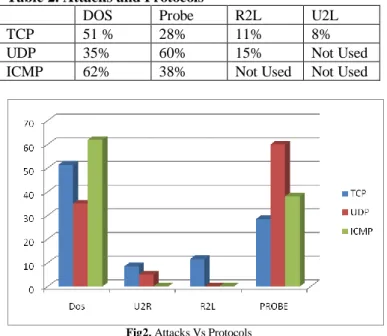
Figure 2 shows statistical view of the data. In TCP protocol all the four attack categories DoS, R2L, U2R and PROBE are active as shown in Table 2. TCP protocol more prone to attacks i.e almost 19 – 22 attacks. The ICMP protocol also more prone to DOS attacks but U2R and R2L attacks are not present in this protocol. Lastly UDP is more affected by Probe attacks.
Table 2. Attacks and Protocols
DOS Probe R2L U2L
TCP 51 % 28% 11% 8%
UDP 35% 60% 15% Not Used
ICMP 62% 38% Not Used Not Used
Fig2. Attacks Vs Protocols
Results are presented in terms of the classes that achieved good levels of discrimination from others in the training set and the analysis of feature relevancy in the training set. Table 2 details the most relevant features for each class and provides the corresponding chi-square test, information gain and gain ratio measures.
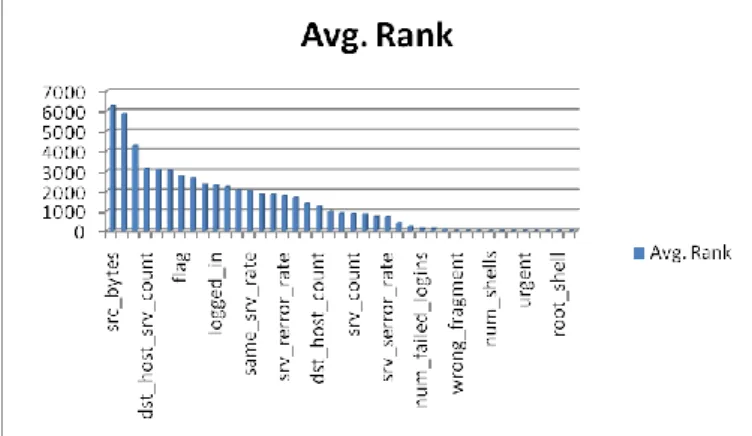
Figure 3 shows Ranking given by the Chi-Square test for each feature. Table 3 shows list of ranked attributes given by Chi-Square test, Information gain, Gain ratio Methods. It shows that most influencing features from KDD-CUP dataset are Src_byte(5),dst_bytes(6),Service(3) and least influencing features are num_outbound_cmd (20), root_shell (14), su_command (15) their avg rank by all three method is 0. So the subspaces form by highly influencing feature like src_byte, dst_byte can give better anomalies than considering whole 42 attributes. This means consider only relevant attributes to process the data it will save time and computation of process.
Fig3. Ranking of features by Chi-Square test.
Figure 4 shows average ranking of all the features using 3 different methods Chi-Square test, Information gain, Gain ratio. Average ranking of src_bytes, dst_byte are more while su_command, root_shell are least. All ranking features are given in Table 3.
Fig4. Average ranking of features
Table 4 details the most discriminative class label for each feature[9]. For majority of the features (31 over 41), normal, smurf and Neptune are the most discriminative classes. That is to say, there are many features that can discriminate these classes accurately. There are 9 features with very small maximum information gain (e.g. smaller than 0.001), which contribute very little to intrusion detection. Moreover features 20 and 21 (outbound command count for FTP sessions and hot login, respectively) do not show any variations in the training set therefore they have no relevance to intrusion detection.
Three classes (namely normal, neptune and smurf)stand out from others with high information gain, hence high degree of discrimination. As indicated before, recent literature based on machine learning algorithms [4, 5, 6] achieved approximately 90% detection rate with low false alarm rates (~2%). Given that normal, neptune and smurf classes correspond to 98% of the training data, the majority of the training set can be easily classified therefore high detection and low false positive rates of IDSs trained on “10% KDD” dataset are questionable because the dataset is unrealistically simple. Moreover, for 14 of the 23 classes, amount of data exchange (i.e. source and destination bytes) is the most discriminating feature. This is expected for denial of service and probe category attacks where the nature of the attack involves very short or very long connections. However for content based attacks (such as ftp_write back and phf) basing the decision on a feature that is unrelated with content will lead to unjustified detection of an attack. Furthermore, as expected, feature 7, which is related to land attack, is selected as the most discriminating feature for land class.
Attr
No Attributes Name Chi-Square Info gain Gain ratio Avg. Rank 5 src_bytes 18756.114 0.77273 0.1975 6252.3 6 dst_bytes 17603.944 0.69273 0.2127 5868.2 3 service 12765.710 0.48480 0.1431 4255.4 33 dst_host_srv_cou nt 9351.305 0.33717 0.1182 3117.2 35 dst_host_diff_srv _rate 9238.1843 0.33406 0.1198 3079.5 34 dst_host_same_sr v_rate 9081.4096 0.32647 0.133 3027.2 4 flag 8300.6853 0.34069 0.2158 2767.081 40 dst_host_rerror_r ate 7971.5361 0.30732 0.1617 2657.335 23 count 7020.5017 0.25963 0.0709 2340.277 12 logged_in 6848.3281 0.23009 0.2323 2282.93 41 dst_host_srv_rerr or_rate 6672.5201 0.26572 0.2288 2224.338 30 diff_srv_rate 6147.9875 0.25786 0.1935 2049.48 29 same_srv_rate 6036.3669 0.2433 0.163 2012.258 27 rerror_rate 5469.9039 0.22611 0.2181 1823.449 37 dst_host_srv_diff _host_rate 5451.0384 0.19042 0.1178 1817.116 28 srv_rerror_rate 5281.7333 0.21749 0.2681 1760.74 36 dst_host_same_sr c_port_rate 4997.1567 0.16571 0.0855 1665.803 31 srv_diff_host_rat e 4070.8727 0.14734 0.1203 1357.047 32 dst_host_count 3731.7494 0.12239 0.0782 1243.983 38 dst_host_serror_r ate 2939.4672 0.12284 0.0962 979.8954 25 serror_rate 2652.0596 0.11351 0.1417 884.1049 24 srv_count 2560.3531 0.08573 0.039 853.4926 39 dst_host_srv_serr or_rate 2502.0422 0.10860 0.1367 834.0958 1 duration 2161.1881 0.09408 0.0881 720.4568 26 srv_serror_rate 2126.5591 0.09232 0.137 708.9295 2 protocol_type 1165.8963 0.04053 0.0519 388.6629 10 hot 695.3526 0.03107 0.104 231.8292 11 no_failed_logins 363.8741 0.01675 0.1178 121.3362 22 is_guest_loginb 352.8157 0.01396 0.0749 117.6349 13 no_compromised 243.4198 0.01112 0.0861 81.17234 8 wrong_fragment 28.1796 0.00093 0.0451 9.408546 16 num_root 25.4471 0.00099 0.0438 8.497298 19 num_access_files 25.0244 0.0008 0.0259 8.350368 18 num_shells 14.3898 0.0006 0.0698 4.820095 17 num_file_creatio n 14.2237 0.0005 0.0266 4.750273 21 is_host_login 8.328 0.0003 0.0653 2.797899 9 urgent 7.5706 0.0003 0.0646 2.545187 7 land 5.2987 0.0002 0.0266 1.775184 20 num_outbound_c mds 0 0 0 0 14 root_shell 0 0 0 0 15 su_attempted 0 0 0 0 Attr
No Attributes Name Chi-Square Info gain Gain ratio Avg. Rank 5 src_bytes 18756.114 0.77273 0.1975 6252.3 6 dst_bytes 17603.944 0.69273 0.2127 5868.2 3 service 12765.710 0.48480 0.1431 4255.4 33 dst_host_srv_cou nt 9351.305 0.33717 0.1182 3117.2 35 dst_host_diff_srv _rate 9238.1843 0.33406 0.1198 3079.5 34 dst_host_same_sr v_rate 9081.4096 0.32647 0.133 3027.2 4 flag 8300.6853 0.34069 0.2158 2767.081 40 dst_host_rerror_r ate 7971.5361 0.30732 0.1617 2657.335 23 count 7020.5017 0.25963 0.0709 2340.277 12 logged_in 6848.3281 0.23009 0.2323 2282.93 41 dst_host_srv_rerr or_rate 6672.5201 0.26572 0.2288 2224.338 30 diff_srv_rate 6147.9875 0.25786 0.1935 2049.48 29 same_srv_rate 6036.3669 0.2433 0.163 2012.258 27 rerror_rate 5469.9039 0.22611 0.2181 1823.449 37 dst_host_srv_diff _host_rate 5451.0384 0.19042 0.1178 1817.116 28 srv_rerror_rate 5281.7333 0.21749 0.2681 1760.74 36 dst_host_same_sr c_port_rate 4997.1567 0.16571 0.0855 1665.803 31 srv_diff_host_rat e 4070.8727 0.14734 0.1203 1357.047 32 dst_host_count 3731.7494 0.12239 0.0782 1243.983 38 dst_host_serror_r ate 2939.4672 0.12284 0.0962 979.8954 25 serror_rate 2652.0596 0.11351 0.1417 884.1049 24 srv_count 2560.3531 0.08573 0.039 853.4926 39 dst_host_srv_serr or_rate 2502.0422 0.10860 0.1367 834.0958 1 duration 2161.1881 0.09408 0.0881 720.4568 26 srv_serror_rate 2126.5591 0.09232 0.137 708.9295 2 protocol_type 1165.8963 0.04053 0.0519 388.6629 10 hot 695.3526 0.03107 0.104 231.8292 11 no_failed_logins 363.8741 0.01675 0.1178 121.3362 22 is_guest_loginb 352.8157 0.01396 0.0749 117.6349 13 no_compromised 243.4198 0.01112 0.0861 81.17234 8 wrong_fragment 28.1796 0.00093 0.0451 9.408546 16 num_root 25.4471 0.00099 0.0438 8.497298 19 num_access_files 25.0244 0.0008 0.0259 8.350368 18 num_shells 14.3898 0.0006 0.0698 4.820095 17 num_file_creatio n 14.2237 0.0005 0.0266 4.750273 21 is_host_login 8.328 0.0003 0.0653 2.797899 9 urgent 7.5706 0.0003 0.0646 2.545187 7 land 5.2987 0.0002 0.0266 1.775184 20 num_outbound_c mds 0 0 0 0 14 root_shell 0 0 0 0 15 su_attempted 0 0 0 0
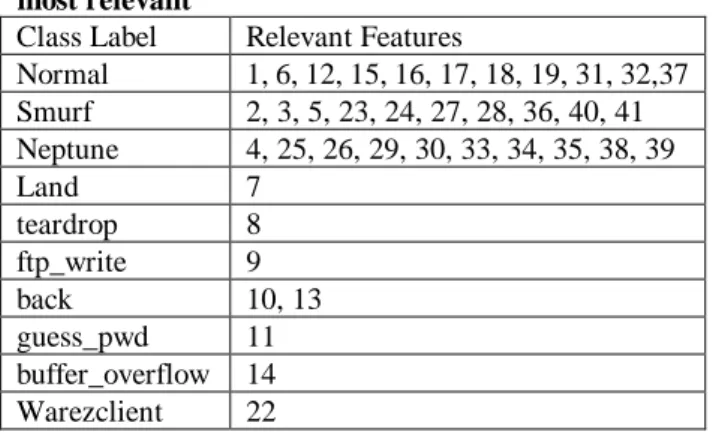
Table 4. List of features for which the class is selected most relevant
Class Label Relevant Features
Normal 1, 6, 12, 15, 16, 17, 18, 19, 31, 32,37 Smurf 2, 3, 5, 23, 24, 27, 28, 36, 40, 41 Neptune 4, 25, 26, 29, 30, 33, 34, 35, 38, 39 Land 7 teardrop 8 ftp_write 9 back 10, 13 guess_pwd 11 buffer_overflow 14 Warezclient 22
Table 5. shows all the releavent features and their releated subspaces which can helps to detcte the anomalies efficiently and effiectively. It also gives which features contibute more to which attacks. So it will easy to detecte attcks using only relevant features instead of taking all features which may not contribute more in that attack.
Table 5. List of relevant features and their subspaces Class Label Most
relevant Feature
Feature Name Relevant Features subspaces
Attack Type
Back 5 source bytes 5,6 DOS
Land 7 land 7 DOS
neptune 5 source bytes
3.4,5,23,26.29,3 0,31,32,34,36,3 7,38,39 DOS Pod 8 wrong fragment 8 DOS
Smurf 5 source bytes
2,3,5,6,12,25,29 ,30,32,36,37,39 DOS
teardrop 8
wrong
fragment 8 DOS
Satan 30 diff srv rate 27 PROBE
ipsweep 36
dst host name
src port rate 36 PROBE
Nmap 5 source bytes 5 PROBE
portsweep 28 srv error rate 28 PROBE
normal 29 same srv rate
3,6,12,23,25,26, 29,30,33,34,35, 36,37,38,39 NORMAL guess_pass wd 11 failed login 11,6,3,4 R2L ftp_write 23 count 9,23 R2L Imap 3 service 3,39 R2L Phf 6 destination bytes 6,10,14,5 R2L multihop 23 count 23 R2L warezmaster 6 destination bytes 6,1 R2L warezclient 3 service 3,24,26 R2L spy 39 dst host srv serror rate 39,1 R2L buffer_overf
low 3 service 3,24,14,6 U2R
loadmodule 36
dst host name
srcport rate 36,24,3 U2R
perl 14 root shell 14,16,18,5 U2R
rootkit 24 srv count 24,23,3 U2R
V. CONCLUSION
Feature selection is a preprocessing part of an intrusion detection system. In this Paper, analysis of the various features of the KDD CUP 99 Dataset is done to find the optimal selection feature using chi-square, info gain and gain ratio based approach in order to maximize the accuracy, simplify the problem and makes the processes faster for detecting the intrusions in a IDS.
The basic concept of data reduction and core attribute selection has been applied to efficiently improve the detection rate. We used subspace clustering method to detect anomalies from relevant attribute subspaces. We plan to extend the work in term of accuracy by focusing on relevant attributes to form relevant subspace and clustering to detect Missing or Hidden anomaly.
ACKNOWLEDGMENT
I take this opportunity to express my profound gratitude and deep regards to my guide Prof. SHARMILA M. SHINDE for her exemplary guidance, monitoring and constant encouragement which helped me in completing this task through various stages. I would like to thanks IJSETR for giving me a opportunity to publish my paper.
REFERENCES
[1] E. Muller, I. Assent, U. Steinhausen, and T. Seidl,Outlier Ranking via Subspace Analysis in Multiple Views of the Data, in ICDM, 2012. [2] C.C. Aggarwal, P.S. Yu, An effective and efficient algorithm for
high-dimensional outlier detection, VLDB J. 14 (2005) 211221. [3] C.C. Aggarwal, On abnormality detection in spuriously populated data
streams, in: SDM05, Newport Beach, CA, 2005.
[4] C.C. Aggarwal, P.S. Yu, Outlier detection in high dimensional data, in: SIGMOD01, Santa Barbara, California, USA, 2001, pp. 3746. [5] C.C. Aggarwal, J. Han, J. Wang, P.S. Yu, A Framework for projected
clustering of high dimensional data streams, in: VLDB04, Toronto, Canada, 2004, pp. 852863.
[6] M. Breuning, H-P. Kriegel, R. Ng, J. Sander, LOF: identifying density-based local outliers, in: SIGMOD00, Dallas, Texas, 2000, pp. 93104.
[7] L. Boudjeloud, F. Poulet, Visual interactive evolutionary algorithm for high dimensional data clustering and outlier detection, in: Proc. of 9th Pacific- Asia Conference on Advances in Knowledge Discovery and Data Mining (PAKDD05), Hanoi, Vietnam, 2005, pp. 426431.
[8] H. Cui, Online Outlier Detection Over Data Streams, Master Thesis, Simon Fraser University, 2002.
[9] H. Günes Kayacık, A. Nur Zincir-HeywoodSelecting Features for Intrusion Detection:A Feature Relevance Analysis on KDD 99 Intrusion Detection Datasets 2005
[10] E. Eskin, A. Arnold, M. Prerau, L. Portnoy, S. Stolfo, A geometric framework for unsupervised anomaly detection: detecting intrusions in unlabeled data, Appl. Data Min. Comput. Secur. (2002).
[11] Ji Zhang, Hongzhou Li, Qigang Gao,Detecting anomalies from big network traffic data using an adaptive detection approach e 2014
[12] KDD Cup 1999. Available on:
http://kdd.ics.uci.edu/databases/kddcup99/kddcup99.html, Ocotber 2007.
Ms. Supriya Garule received her B.E. degree with honors in Information Technology from PUNE university. She is pursuing M.E. in computer science from PUNE university. Her areas of interest are computer networks, security and Data Mining.
.
Prof. Sharmila M. Shinde is an Assistant Professor in Department of
Computer Science at JSPM College, PUNE University . She received her M.Tech. in Computer Science. She is currently pursuing her Ph.D. in Computer Science and Engineering fromPUNE University. She has more than 16 years of experience in Academics, Data Mining, and Software Development Industry .