Cell-specific regulation of proliferation by Ano1/TMEM16A in
breast cancer with different ER, PR, and HER2 status
Huizhe Wu1, Hui Wang2, Shu Guan3, Jing Zhang1, Qiuchen Chen1, Xiaodong Wang1, Ke Ma2, Pengfei Zhao1, Haishan Zhao1, Weifan Yao1, Feng Jin3, Qinghuan Xiao2 and Minjie Wei1
1Department of Pharmacology, Liaoning Key Laboratory of Molecular Targeted Anti-Tumor Drug Development and Evaluation,
China Medical University, Shenyang, 110122, P.R. China
2Department of Ion Channel Pharmacology, School of Pharmacy, China Medical University, Shenyang, 110122, P.R. China 3Department of Breast Surgery, The First Hospital of China Medical University, Shenyang, 110001, P.R. China
Correspondence to: Minjie Wei, email: mjweicmu@hotmail.com
Qinghuan Xiao, email: qinghuanxiao@gmail.com
Keywords: Ano1, TMEM16A, Ki67, breast cancer, proliferation
Received: October 07, 2015 Accepted: May 23, 2017 Published: June 27, 2017
Copyright: Wu et al. This is an open-access article distributed under the terms of the Creative Commons Attribution License 3.0 (CC BY 3.0), which permits unrestricted use, distribution, and reproduction in any medium, provided the original author and source are credited.
ABSTRACT
The calcium-activated chloride channel Ano1 (TMEM16A) is overexpressed in many tumors. However, conflicting data exist regarding the role of Ano1 in cell proliferation. Here, we performed immunohistochemistry to investigate the expression of Ano1 and Ki67 in 403 patients with breast cancer, and analyzed the association between the expression of Ano1 and Ki67 in breast cancer subtypes categorized according to estrogen receptor (ER), progesterone receptor (PR), and human epidermal growth factor receptor 2 (HER2). Ano1 expression was negatively correlated with Ki67 expression. Ano1 overexpression more frequently occurred in ER-positive or HER2-negative patients with the low expression of Ki67. Ano1 overexpression was associated with longer overall survival (OS) in breast cancer with the low expression of Ki67, especially in ER-positive, PR-positive, and HER2-negative breast cancer. Multivariate Cox regression analysis showed that Ano1 overexpression was a prognostic factor for longer overall survival in ER-positive, PR-positive, or HER2-negative patients with the low expression of Ki67. Furthermore, Ano1 promoted cell proliferation in ER-positive, PR-positive, and HER2-negative MCF7 cells, but inhibited cell proliferation in ER-negative, PR-negative, and HER2-negative MDA-MB-435S cells. Our findings suggest that Ano1 may differentially regulate cell proliferation in a subtype of breast cancer defined by ER, PR, and HER2. Combined expression of Ano1 and Ki67 may be used for predicting clinical outcomes of breast cancer patients with different subtypes of ER, PR, and HER2.
INTRODUCTION
Anoctamin 1 (Ano1, TMEM16A) is a novel calcium-activated chloride channel (CaCC) identified by three independent laboratories in 2008 [1-3]. Ano1 is involved in a variety of physiological functions including epithelial secretion, smooth muscle contraction, neuronal and cardiac excitation, and pain [4-7]. Ano1 has been
implicated in many diseases such as cancer, hypertension, and cystic fibrosis [4, 8, 9]. Recently, Ano1 modulators with a relative high selectivity have been developed [10-12], and are believed to be potentially used for the treatment of these diseases [4].
Before the discovery of Ano1 as a CaCC, Ano1 has been found to be overexpressed in many cancers including gastrointestinal stromal tumor, esophageal squamous www.impactjournals.com/oncotarget/ Oncotarget, 2017, Vol. 8, (No. 49), pp: 84996-85013
cell cancer, and head and neck squamous cell carcinoma (HNSCC) [13-16]. Ano1overexpression is also found in many other tumors including breast cancer [17-19], prostate cancer [20], pancreatic ductal adenocarcinoma [21], gastric cancer [22], and chondroblastoma [23]. Amplification of the corresponding chromosomal region in 11q13 contributes to Ano1 overexpression in many cancers including breast cancer [18, 24-26]. However, the 11q13 amplification only occurs in approximately 15% of breast cancer patients [27]. It is unlikely that the 11q13 amplification is the only contributor to Ano1 overexpression in breast cancer. Other regulatory mechanisms that are responsible for Ano1 overexpression are expected to exist. It has been reported that the inhibition of histone deacetylase (HDAC) downregulated Ano1 expression in breast cancer cells, suggesting that epigenetic regulation of Ano1 by HDAC may contribute to Ano1 overexpression in breast cancer [28]. Ano1 has been found to be downregulated via promotor methylation in metastatic nodal tissues from HNSCC patients [29]. Our previous study have shown that in ER-negative breast cancer, Ano1 expression was higher in PR-positive tumors than in PR-negative tumors, suggesting that Ano1 expression may be regulated by the ER/PR signaling pathway [19].
Although Ano1 has been found to regulate cell proliferation, the role of Ano1 in cell proliferation has not been completely understood [4]. Ano1 overexpression promotes cell proliferation in tumors such as HNSCC, breast cancer, glioma, and prostate cancer [18, 20, 24, 30, 31], as well as interstitial cells of Cajal [32] and renal cyst-forming epithelial cells [33]. However, cell proliferation is not reduced in pancreatic ductal adenocarcinoma cells and gastric cancer cells treated with Ano1 shRNAs or inhibitors [21, 22]. In addition, overexpression of various Ano1 isoforms identified in breast cancer cells does not affect cell proliferation in HEK-293 cells [17]. The inhibitory effect of Ano1 on cell proliferation has been found in vascular smooth muscle cells. Ano1 overexpression inhibits angiotensin II-induced proliferation in vascular smooth muscle cells via Kruppel-like factor 5, which prevents activation of the Ano1 promoter by myocardin [34, 35]. It appears that Ano1 plays different roles in cell proliferation in different cells via cell type-dependent mechanisms.
Breast cancer is a heterogeneous disease that is clinically categorized into different subtypes based on estrogen receptor (ER), progesterone receptor (PR), and human epidermal growth factor receptor 2 (HER2) [36]. In this study, we investigated the expression of Ano1and Ki67, a well-known marker for cell proliferation, in subgroups of breast cancer patients, categorized according to the ER, PR, and HER2 status. The purpose of this study was to explore the association of Ano1expression with Ki67 expression in different subtypes of breast cancer, to identify the prognostic role of Ano1 in breast cancer with
different subtypes, and to explore the possible cell-specific mechanisms of Ano1 overexpression in cell proliferation.
RESULTS
Clinicopathological characteristics
Table 1 summarizes clinicopathological charac-teristics of 407 breast cancer patients. The median age of these patients was 51 years (range, 20-82 years). Most patients (83.8%) did not have a family history of breast cancer. The majority of these patients had a tumor with >2 cm in size, histological Grade 2, and Stage I or II. Of the 407 patients, 278 (68.3%), 275 (67.6%), and 96 (23.6%) patients were ER-negative, PR-negative and HER2-positive, respectively. Triple-negative breast cancer (TNBC) patients were only recorded in 63 (15.5%) of 407 patients. Of the 407 patients, 358 patients received anthracycline-based chemotherapy alone or in combination with paclitaxel, and 316 patients received tamoxifen treatment.
The patients were followed up for 5-71 months. Relapses occurred in 37 (9.1%) of 407 cases and breast cancer-associated deaths in 49 (12.0%) of 407 cases. The 5-years survival rate was 86.9%. The mean OS and DFS were 66 months and 63 months, respectively.
The expression of Ano1 and Ki67 in breast cancer
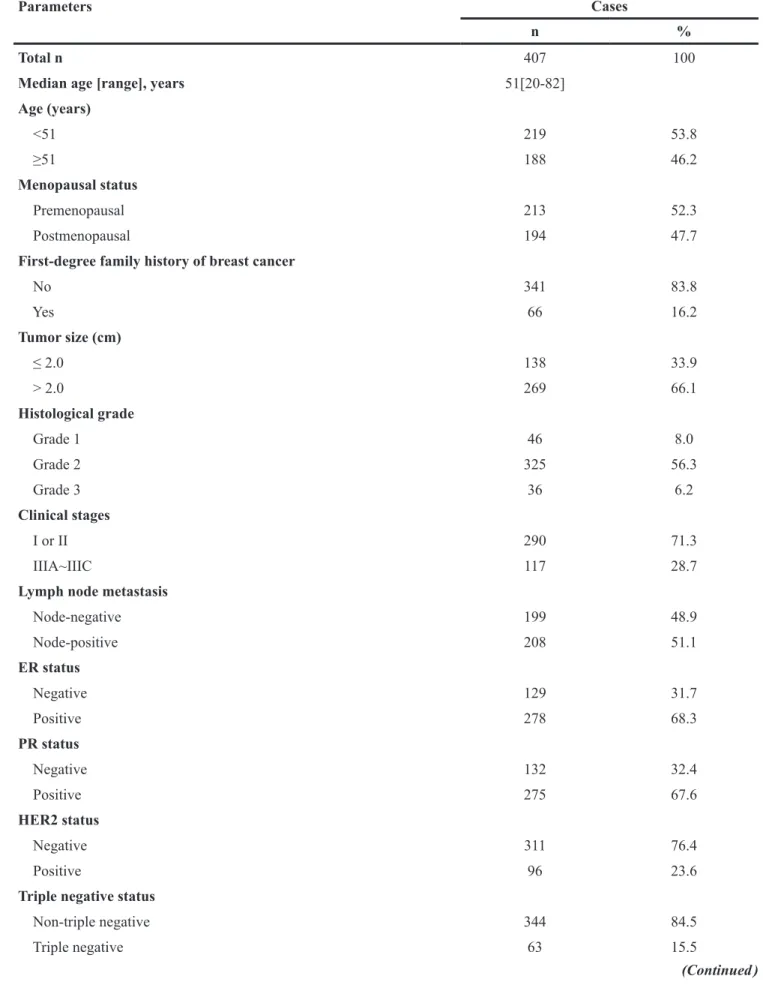
We performed immunohistochemistry to investigate the expression of Ano1 and Ki67 in 407 breast cancer samples (Figure 1). The optimal cutoff score for the expression of Ano1 and Ki67 was determined by ROC curves, based on the sensitivity and specificity for each clinicopathological feature of the 407 patients (Figures 2 and 3). ROC curves showed that the expression level of Ano1 was discriminated by PR (P=0.040), TNBC (P=0.051), and tamoxifen treatment (P=0.017) (Figure 2), and the expression level of Ki67 was discriminated by tumor size (P=0.028), clinical stages (P=0.004), and HER2 status (P=0.003) (Figure 3). The parameter that exhibited the biggest area of the area under the curve (AUC) was selected to determine the cutoff values. According to the criteria, tamoxifen treatment and clinical stages were selected to determine the cutoff values for Ano1 and Ki67, respectively. Based on these results, a cutoff score of 65% and 38% were determined for the expression of Ano1 and Ki67, respectively. Immunohistological scores >65% and ≤65% were defined as the ‘high” and “low” expression of Ano1, respectively. Immunohistological scores >38% and ≤ 38% were defined as the “high” and “low” expression of Ki67, respectively.
Figure 1 shows the representative immunohis-tochemical staining for the high and low expression of Ano1 and Ki67 in breast cancer samples. Of the 407 breast cancer samples, 175 (43%) samples exhibited
Table 1: Clinicopathological baseline characteristics
Parameters Cases
n %
Total n 407 100
Median age [range], years 51[20-82]
Age (years) <51 219 53.8 ≥51 188 46.2 Menopausal status Premenopausal 213 52.3 Postmenopausal 194 47.7
First-degree family history of breast cancer
No 341 83.8 Yes 66 16.2 Tumor size (cm) ≤ 2.0 138 33.9 > 2.0 269 66.1 Histological grade Grade 1 46 8.0 Grade 2 325 56.3 Grade 3 36 6.2 Clinical stages I or II 290 71.3 IIIA~IIIC 117 28.7
Lymph node metastasis
Node-negative 199 48.9 Node-positive 208 51.1 ER status Negative 129 31.7 Positive 278 68.3 PR status Negative 132 32.4 Positive 275 67.6 HER2 status Negative 311 76.4 Positive 96 23.6
Triple negative status
Non-triple negative 344 84.5
Triple negative 63 15.5
the low expression of Ano1, and 232 (57%) samples showed the high expression of Ano1. 353 (86.7%) samples exhibited the low expression of Ki67, and 54 (13.3%) samples showed the high expression of Ki67. Association of Ano1 expression with Ki67
expression
We performed Spearman’s rank correlation coefficient analysis to analyze the association between the expression of Ano1 and Ki67 in breast cancer patients. Ano1 expression was negatively correlated with Ki67 expression (r=-0.99,
P=0.045) (Table 2). Ano1 expression was significantly higher in ER-positive (P=0.048) or HER2-negative (P=0.040) patients with the low expression of Ki67 compared with those with the high expression of Ki67 (Table 3).
Association of the expression of Ano1 and Ki67 with the survival of breast cancer patients
We then evaluated the association of the expression of Ano1 and Ki67 with the OS or DFS in breast cancer patients. Ano1 expression was not associated with DFS or OS in breast cancer with the high expression
Parameters Cases
n %
Tamoxifen treatment
No 91 22.4
Yes 316 77.6
Postoperative therapeutic regimens
Anthracycline alone or combined with paclitaxel 358 88.0
Other chemotherapies or treatments 49 12.0
Abbreviations: ER, Estrogen receptor; PR, Progesterone receptor; HER2, Human epidermal growth factor receptor.
Other chemotherapies included paclitaxel alone (n=21), NP regimen (navelbine plus cisplatin, n=15), TP regimen (Docetaxel plus cisplatin, n=11).
Figure 1: Representative immunohistochemical micrographs for the low (A, C) and high (B, D) expression of Ano1 (A, B)
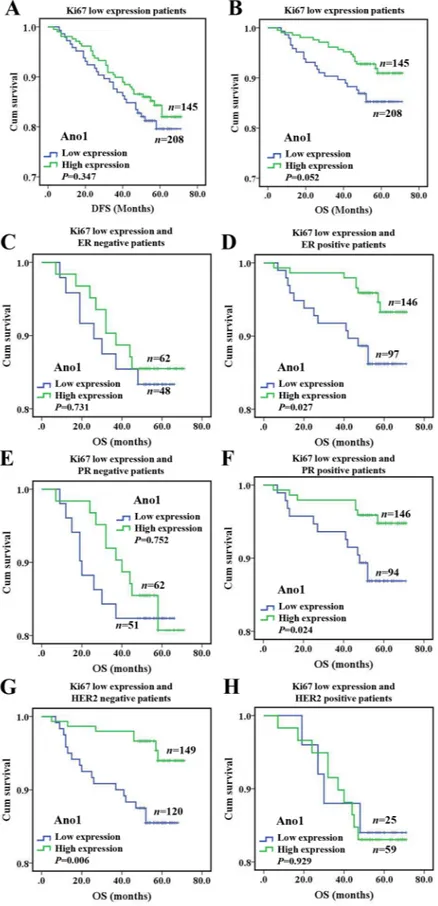
of Ki67, regardless of the ER, PR, and HER2 status (Supplementary Figure 1). The high expression of Ano1 was associated with a tendency toward a longer OS in breast cancer with the low expression of Ki67 (P= 0.052, Figure 4B), especially in ER-positive (P=0.027, Figure 4D), PR-positive (P=0.024, Figure 4F), or HER2-negative (P=0.006) breast cancer (Figure 4G). Multivariate Cox
regression analysis showed that Ano1 overexpression was a prognostic factor for longer OS in ER-positive, PR-positive or HER2-negative patients with the low expression of Ki67 (Table 4)
We then investigated the association of the expression of Ano1 and Ki67 with the OS or DFS in breast cancer patients with lymph node-positive or
Figure 2: ROC curves were used to determine the cutoff score for the expression of Ano1 in breast cancer patients. The sensitivity and specificity for histological grade (A), clinical stage (B), lymph node metastasis (C), PR status (D), TNBC status (E), Ki67 status (F), tamoxifen treatment (G), and OS (H) were plotted for the expression of Ano1. The areas under curves (AUC) and P values were indicated.
Figure 3: ROC curves were used to determine the cutoff score for the expression of Ki67 in breast cancer patients. The sensitivity and specificity for tumor size (A), clinical stage (B), lymph node metastasis (C), HER2 status (D), RFS (E), and OS (F) were plotted for the expression of Ano1. The areas under curves (AUC) and P values were indicated.
Table 2: The correlation analysis of Ano1 expression and Ki67 expression in patients with breast cancer
Parameter Ano1 expression P†,‡ OR (95%CI)§ Correlation
coefficientЛ Low n (%) n (%)High Ki67 expression Low 145(41.1) 208(58.9) 0.045† 1 (reference) -0.99 High 30(55.6) 24(44.4) 0.047‡ 0.558 (0.313-0.993)
† P values were calculated from 2-sided chi-square tests or Fisher’s Exact Test.
‡P values were calculated by unconditional logistic regression adjusted for age, menopause state.
§OR and 95% CI values were calculated by unconditional logistic regression adjusted for age, menopause status, first degree family history of breast cancer.
Лcorrelation coefficient was calculated by using Spearman’s rank correlation coefficient analysis.
Table 3: Association of Ano1 expression with Ki67 expression in breast cancer patients with different ER, PR, and HER2 status
Ki67 expression Ano1 expression
Low n (%) n (%)High P value †,‡ OR(95%CI)§ ER-positive patients Low 97(39.9) 146(60.1) 0.054† 1 (reference) High 20(57.1) 15(42.9) 0.048‡ 0.480(0.232-0.995) ER-negative patients Low 48(43.6) 62(56.4) 0.467† 1 (reference) High 10(52.6) 9(47.4) 0.480‡ 0.699(0.259-1.885) PR-positive patients Low 94(39.2) 146(60.8) 0.289† 1 (reference) High 17(48.6) 18(51.4) 0.250‡ 0.654(0.317-1.348) PR-negative patients Low 51(45.1) 62(54.9) 0.060† 1 (reference) High 13(68.4) 6(31.6) 0.057‡ 0.356(0.123-1.029) HER2-postive patients Low 25(29.8) 59(70.2) 0.801† 1 (reference) High 4(33.3) 8(66.7) 0.935‡ 0.942(0.227-3.911) HER2-negative patients Low 120(44.6) 149(55.4) 0.037† 1 (reference) High 26(61.9) 16(38.1) 0.040‡ 0.497(0.255-0.969)
Abbreviations: ER, Estrogen receptor; PR, Progesterone receptor; HER2, Human epidermal growth factor receptor.
† P values were calculated from 2-sided chi-square tests or Fisher’s Exact Test.
‡P values were calculated by unconditional logistic regression adjusted for age, menopause state.
§OR and 95% CI values were calculated by unconditional logistic regression adjusted for age, menopause status, first
Figure 4: Kaplan-Meier survival analysis of Ano1 expression in breast cancer patients with the low expression of Ki67.
(A, B) Survival curves show the association between Ano1 expression and DFS (A) and OS (B) in 353 breast cancer patients with the low
expression of Ki67. C-H. Survival curves show the association between Ano1 expression and OS in ER-negative patients (C), ER-positive patients (D), PR-negative patients (E), PR-positive patients (F), HER2-negative patients (G), and HER2-positive patients (H).
Table 4: Multivariate COX regression analysis of the association of Ano1 and Ki67 expression with DFS and OS in breast cancer patients
Variable DFS OS
Total
n. Eventsn (%) HR (95%CI)Adjusted P value
† Total
n Eventsn (%) HR (95%CI)Adjusted P value
†
Ano1 Expression ER-positive patients
Low 117 7 (6.0) 1 (reference) 117 16 (13.7) 1 (reference)
High 161 (11.8)19 1.869(0.780-4.480) 0.161 161 12 (7.5) 0.503(0.236-1.070) 0.074
ER-negative patients
Low 58 6 (10.3) 1 (reference) 58 10 (17.2) 1 (reference)
High 71 5 (7.0) 0.561(0.164-1.913) 0.356 71 11 (15.5) 0.938(0.391-2.252) 0.887
PR-positive patients
Low 111 10 (9.0) 1 (reference) 111 16 (14.4) 1 (reference)
High 164 16 (9.8) 1.015(0.455-2.262) 0.971 164 11 (6.7) 0.425(0.196-0.921) 0.030 PR-negative patients
Low 64 3 (4.7) 1 (reference) 64 10 (15.6) 1 (reference)
High 68 8 (11.8) 2.065(0.536-7.961) 0.292 68 12 (17.6) 1.087(0.465-2.540) 0.848
HER2-positive patients
Low 29 3 (10.3) 1 (reference) 29 5(17.2) 1 (reference)
High 67 8 (11.9) 0.955(0.240-3.805) 0.948 67 13(19.4) 1.498(0.489-4.589) 0.479
HER2-negative patients
Low 285 (52.3)149 1 (reference) 280 155(55.4) 1 (reference)
High 26 (61.5)16 1.256(0.564-2.794) 0.577 31 10(32.3) 0.388(0.182-0.826) 0.014 Patients with the low expression of Ki67
Low 106 8(7.5) 1 (reference) 106 14(13.2) 1 (reference)
High 169 19(11.2) 1.226(0.585-2.570) 0.590 169 9(5.3) 0.536(0.282-1.019) 0.057
Patients with the high expression of Ki67
Low 22 2(9.1) 1 (reference) 22 4(18.2) 1 (reference)
High 19 2(10.5) 2.146(0.334-13.785) 0.421 19 5(26.3) 1.569(0.445-5.526) 0.483
Lymph node-negativepatients
Low 79 11(13.9) 1 (reference) 79 5(6.3) 1 (reference)
High 120 14(11.7) 0.783(0.351-1.750) 0.551 120 5(4.2) 0.533(0.151-1.877) 0.327
Lymph node-positivepatients
Low 96 23(24.0) 1 (reference) 96 21(21.9) 1 (reference)
High 112 26(23.2) 0.975(0.546-1.678) 0.879 112 18(16.1) 0.694(0.370-1.303) 0.256
ER-negativepatients with the low expression of Ki67
Low 48 11(22.9) 1 (reference) 48 8(16.7) 1 (reference)
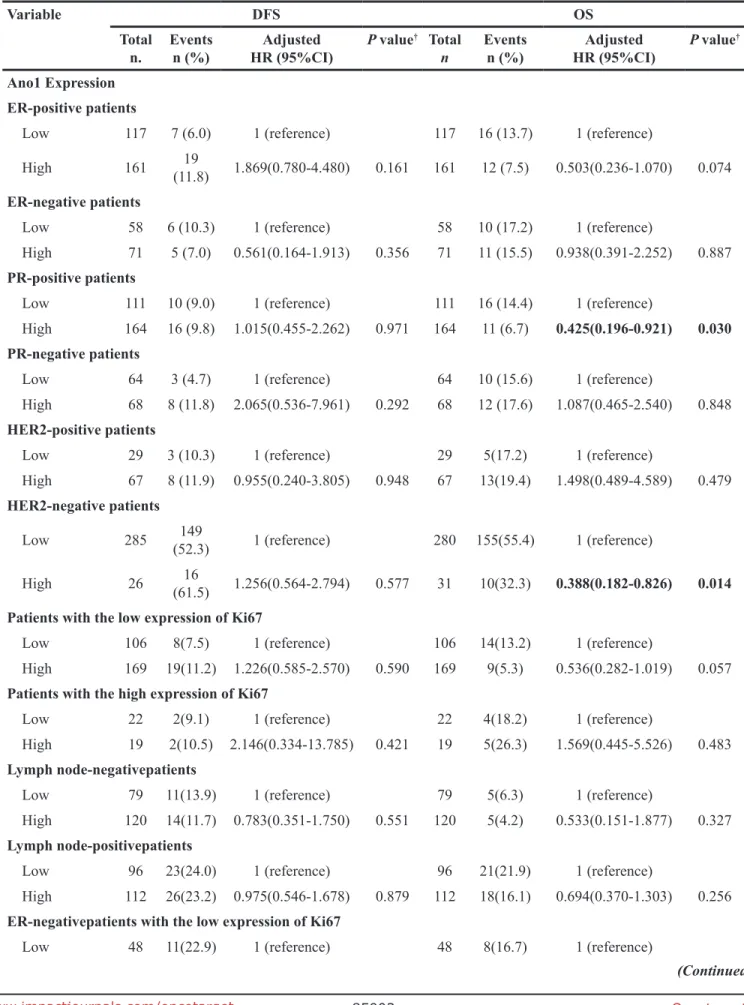
node-negative status. In lymph node-negative patients, the expression of Ano1 or Ki67 was not significantly associated with the DFS or OS (Supplementary Figure 2A-2D). In lymph node-positive patients, Ano1 expression
was not significantly associated with the DFS (P=0.879) or OS (P=0.252) (Figure 5A, 5B). In node-positive patients, Ki67 expression was significantly associated with shorter OS (P=0.031, Figure 5D), but not DFS (P=0.076,
Variable DFS OS
Total
n. Eventsn (%) HR (95%CI)Adjusted P value
† Total
n Eventsn (%) HR (95%CI)Adjusted P value
†
High 62 12(19.4) 0.870(0.376-2.015) 0.746 62 9(14.5) 0.900(0.340-2.385) 0.832
ER-positive patients with the low expression of Ki67
Low 97 17(17.5) 1 (reference) 97 13(13.4) 1 (reference)
High 146 21(14.4) 0.722(0.407-1.468) 0.431 146 8(5.5) 0.374(0.155-0.906) 0.029 PR-negative patients with the low expression of Ki67
Low 51 11(21.6) 1 (reference) 51 9(17.6) 1 (reference)
High 62 15(24.2) 1.082(0.492-2.379) 0.844 62 10(16.1) 0.880(0.353-2.194) 0.880
PR-positive patients with the low expression of Ki67
Low 94 17(18.1) 1 (reference) 94 12(12.8) 1 (reference)
High 146 18(12.3) 0.627(0.320-1.227) 0.173 146 7(4.8) 0.328(0.128-0.841) 0.020 HER2-negative patients with the low expression of Ki67
Low 120 22(18.3) 1 (reference) 120 17(14.2) 1 (reference)
High 149 17(12.1) 0.602(0.321-1.127) 0.113 149 7(4.7) 0.296(0.122-0.717) 0.007 HER2-positive patients with the low expression of Ki67
Low 25 6(24.0) 1 (reference) 25 4(16.0) 1 (reference)
High 59 15(25.4) 1.212(0.456-3.225) 0.700 59 10(16.9) 1.402(0.420-4.680) 0.583
Ki67 Expression
Lymph node-negative patients
Low 177 23(13.0) 1 (reference) 177 9(5.1) 1 (reference)
High 22 2(9.1) 0.667(0.155-2.861) 0.585 22 1(4.1) 0.831(0.104-6.641) 0.861
Lymph node-positive patients
Low 176 38(21.6) 1 (reference) 176 29(16.5) 1 (reference)
High 32 11(34.4) 0.551(0.280-1.087) 0.085 32 10(31.3) 0.482(0.233-0.995) 0.048 Lymph node-positive patients with the high expression of Ano1
Low 98 20(20.4) 1 (reference) 98 13(13.3) 1 (reference)
High 14 6(42.9) 2.649(1.060-6.617) 0.037 14 5(35.7) 3.286(1.170-9.228) 0.024 Lymph node-positive patients with the low expression of Ano1
Low 78 18(23.1) 1 (reference) 78 16(20.5) 1 (reference)
High 18 5(27.8) 1.262(0.468-3.400) 0.646 18 5(27.8) 1.453(0.532-3.970) 0.466
Abbreviations: HR: Hazard Ratio; 95% CI, 95% confidence interval; DFS: Disease-free survival; OS: Overall survival;
Ref, reference category; ER, Estrogen receptor; PR, Progesterone receptor; HER2, Human epidermal growth factor receptor.
†P values, Adjusted HR(95%CI) were assessed using multivariate Cox regression analysis adjusted for age and menopausal
Figure 5: Kaplan-Meier survival analysis of Ano1 or Ki67 expression in breast cancer patients with lymph node metastasis. (A-D) Survival curves show the association of the expression of Ano1 (A, B) and Ki67 (C, D) with DFS (A, C) and OS (B, D) in 208 lymph node-positive breast cancer patients. (E-H) Survival curves show the association between the expression of Ki67 with DFS (E, G) and OS (F, H) in lymph node-positive breast cancer patients with the high (E, F) and low (G, H) expression of Ano1.
Figure 5C). Furthermore, in lymph node-positive patients with the high expression of Ano1, Ki67 expression was significantly associated with shorter DFS (P=0.030, Figure 5E) and OS (P=0.016, Figure 5F). However, no significant association was found between Ki67 expression with DFS and OS in lymph node-positive patients with the low expression of Ano1 (Figure 5G, 5H). Multivariate Cox regression analysis showed that Ki67 overexpression was a prognostic factor for shorter OS in lymph node-positive patients with the high expression of Ano1 (Table 4). Differential regulation of cell proliferation by Ano1 in MCF7 and MDA-MB-435S cells
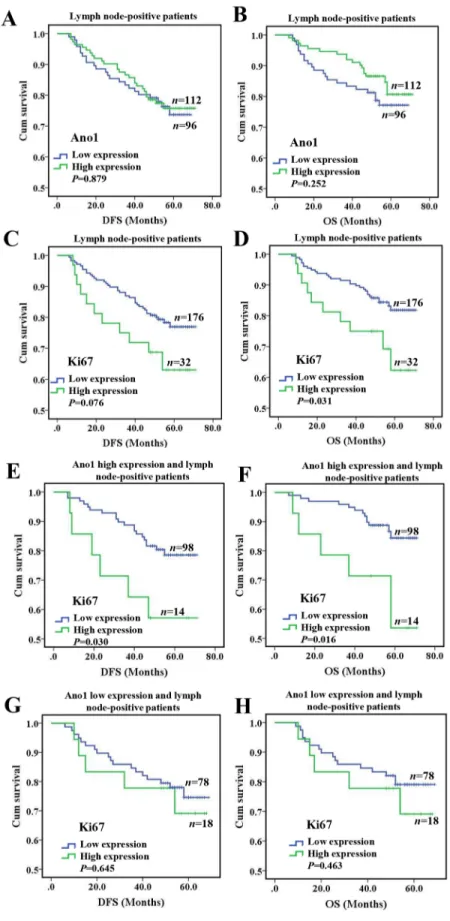
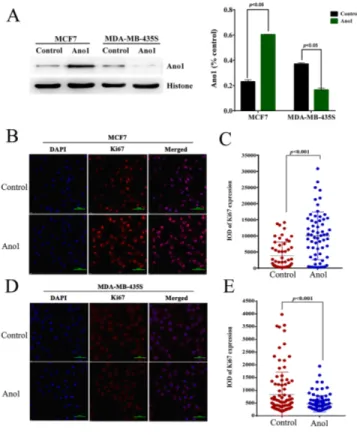
We then investigated whether Ano1 differentially regulated cell proliferation in different cells with different ER, PR, and HER2 status. Western blot analysis showed that Ano1 was expressed in MCF7 cells with ER-positive, PR-positive and HER2-negative status and MDA-MB-435S cells with ER-negative, PR-negative and HER2-negative status. Transfection of Ano1 plasmids resulted in a significant increase in Ano1 expression (Figure 6A, 6B). Ano1 overexpression resulted in a significant increase in cell viability in MCF7 cells and a significant decrease in cell viability in MDA-MB-435S cells (Figure 6C). In addition, Western blot analysis showed that Ano1 overexpression increased the nuclear expression of Ki67 in MCF7 cells, and inhibited the nuclear expression of Ki67 in MDA-MB-435S cells (Figure 7A). Consistent with Western blot results, immunofluorescence analysis showed that Ano1 overexpression significantly increased Ki67 expression in MCF7 cells, and significantly decreased Ki67 expression in MDA-MB-435S cells (Figure 7B–7E), suggesting that Ano1 regulated cell proliferation in a cell-specific manner. Furthermore, cell cycle analysis showed
that Ano1 overexpression increased the percentage of MCF7 cells in the S phase, but decreased the percentage of MDA-MB-435S cells in the S phase (Figure 8). Taken together, these findings showed that Ano1 overexpression promoted cell proliferation in MCF7 cells, and inhibited cell proliferation in MDA-MB-435S cells.
DISCUSSION
We and others have previously reported that Ano1 is overexpressed in breast cancer [18, 19]. However, it is unclear how Ano1 overexpression contributes to breast cancer tumorigenesis, and there are conflicting results regarding the role of Ano1 in cell proliferation in different cells [17, 18, 30, 34]. Breast cancer is a heterogeneous disease with respect to cellular origin, cellular subtypes, genetic alterations, and clinical outcomes [40]. We have previously found that Ano1 overexpression is associated with good prognosis in PR-positive or HER2-negative breast cancer patients following tamoxifen treatment [19]. The role of Ano1 in breast cancer tumorigenesis may be explained by a cell-type specific mechanism defined by different ER, PR and HER2 status. In the present study, we investigated the cell-specific mechanisms of Ano1 in breast cancer cell proliferation in breast cancer tumors and cell lines with different ER, PR and HER2 status. We found that in ER-positive or HER2-negative patients, Ano1 expression was significantly higher in tumors with the low expression of Ki67 than in tumors with the high expression of Ki67. Furthermore, in vitro studies showed that Ano1 increased cell proliferation in ER-positive, PR-positive, and HER2-negative MCF7 cells, but inhibited cell proliferation in ER-negative, PR-ER-negative, and HER2-negative MDA-MB-435S cells. Our findings support the idea that Ano1 differentially regulates breast cancer cell proliferation in a cell-specific manner, depending on the ER, PR, and HER2 status.
Figure 6: Regulation of cell proliferation by Ano1. (A, and B) Representative western blot showing the expression of
Ano1 in MCF7 cells (A) or MDA-MB-435S cells (B) transfected with Ano1 plasmids or empty vectors. b-actin was used as a loading control. (C) CCK-8 assay showing the cell viability in MCF7 cells or MDA-MB-435S cells transfected with Ano1 plasmid or empty vectors. *p<0.05. n=3.
Figure 7: Ano1 overexpression regulates the nuclear expression of Ki67. (A) Representative Western blot showing the nuclear expression of Ki67 in MCF7 cells or MDA-MB-435S cells transfected with Ano1 plasmids or empty vectors (control). Histone was used as a loading control. (B-E) Representative immunofluorescent staining for Ano1 and Ki67 in MCF7 (B) or MDA-MB-435S (D) cells transfected with Ano1 plasmids or empty vectors. Scatter plots analysis of the IOD values of Ki67 expression in MCF7 (C) or MDA-MB-435S (E) cells transfected with Ano1 plasmids or empty vectors. *p<0.05. n=3.
Figure 8: Effect of Ano1 on cell cycle. (A and B), Representative Flow cytometry for cell cycle analysis in MCF7 (A) or MDA-MB-435S (B) cells transfected with Ano1 plasmids or empty vectors. (C and D), Proliferation index (C) and S-phase fraction (D) in MCF7 and MDA-MB-435S cells transfected with Ano1 plasmids or empty vectors. *p<0.05. n=3.
In this study, we found that Ano1 overexpression promoted cell proliferation in MCF7 cells in vitro. Consistent with the proliferation-promoting effect of Ano1 in MCF7 cells, several in vitro studies have shown the proliferation-promoting effect of Ano1 in HNSCC, breast cancer, and prostate cancer [18, 20, 30]. However, in human breast cancer samples, we found that Ano1 expression was negatively correlated with Ki67 expression. In ER-positive or HER2-negative patients, Ano1 expression was significantly higher in tumors with the low expression of Ki67 than in tumors with the high expression of Ki67. It appears that Ano1 overexpression may inhibit cell proliferation in human breast cancer with ER-positive or HER2-negative status. These seemingly controversial results may be because the cellular condition may be different between in vivo human breast cancer tissues and in vitro cultured cells. Human breast cancer tissues contain heterogeneous cell populations, and it may be possible that a signaling pathway that promotes cell proliferation and inhibits Ano1 expression may be activated in breast cancer tissues, but not in cultured cells in our experimental conditions. Furthermore, we found that Ano1 overexpression inhibited cell proliferation in MDA-MB-435S cells with ER-negative, PR-negative, and HER2-negative status. It appears that the effect of Ano1 on cell proliferation is dependent on cellular conditions defined by ER, PR and HER2 status. The inhibitory effect of Ano1 on cell proliferation is supported by previous reports showing that Ano1 inhibited cell proliferation in vascular smooth muscle cells [34, 35]. The cell-specific effect of Ano1 on regulation of cell proliferation is further demonstrated by several studies showing that knockdown of Ano1 does not affect proliferation in HEK-293 cells [17], HNSCC BHY cells [25], colonic epithelial HT29 cells [26], pancreatic ductal adenocarcinoma cells [21], and gastric cancer cells [22].
The cell-specific mechanism underlying regulation of cell proliferation by Ano1 remains unclear, and may be associated with activation of different signaling pathways by Ano1 in different cancer cells. For example, in HNSSC, Ano1 activates ERK1/2 and increases the levels of cyclin D1 [30]. In gastric cancer, Ano1 promotes TGF-β secretion, and TGF-β signaling activation meditates Ano1-induced migration, invasion, and metastasis [22]. In glioma, Ano1 overexpression activates the nuclear factor-κB signaling pathway [31]. In breast cancer cell lines, Ano1 activates the epidermal growth factor receptor (EGFR) and calmodulin-dependent protein kinase (CAMK) signaling pathways [18]. In the present study, we found that Ano1 promoted cell proliferation in ER-positive, PR-ER-positive, and HER2-negative MCF7 cells, but inhibited cell proliferation in ER-negative, PR-negative, and HER2-negative MDA-MB-435S cells. It appears that ER and PR signaling may determine the effect of Ano1 in cell proliferation. Further studies are required to identify the signaling pathways that are involved in the regulation
of cell proliferation by Ano1 in MCF7 and MDA-MB-435S cells.
Cell lines exhibit a relatively high degree of homogeneity, whereas human breast cancer tissues are more heterogeneous. Therefore, the findings in one population of breast cancer cells may not represent the general feature of heterogeneous breast cancer tissues in vivo. In this study, we found a negative correlation between Ano1 and Ki67 in breast cancer samples, and the negative correlation was supported by Ano1 overexpression inhibited cell proliferation in MDA-MB-435S cells. However, although we found that Ano1 overexpression promoted cell proliferation in MCF7 cells, no positive correlation between Ano1 overexpression and Ki67 was found in human breast cancer samples. The proliferation-promoting effect of Ano1 in MCF7 cells may represent a specific feature of a certain breast cancer cell population and/or under a certain cellular condition. We found in lymph node-positive patients with the high, but not low, expression of Ano1, Ki67 overexpression was associated with a shorter OS. The poor prognosis of breast cancer patients with the high expression of Ano1 may be explained by the proliferation-promoting effect of Ano1 as identified in MCF7 cells.
Although it remains unclear whether Ano1 promotes or inhibits cell proliferation, there is a consistent finding of Ano1 overexpression in malignant cancers. Thus, Ano1 may be used as prognostic marker for cancer patients. It has been reported that Ano1 is associated with poor prognosis in patients with gastric cancer and HNSCC [22, 25]. Bristschgi et al. has found that Ano1 gene amplification is associated with poor prognosis in patients with breast cancer [18]. We have previously reported that Ano1 overexpression is associated with good prognosis in PR-positive or HER2-negative breast cancer patients following tamoxifen treatment [19]. In this study, multivariate Cox regression analysis showed that Ano1 overexpression was a prognostic for longer OS in ER-positive, PR-positive, or HER2-negative patients with the low expression of Ki67. According to the 13th
Gallen International Breast Cancer Conference (2013) Expert panel [41], endocrine therapy with tamoxifen is the most important intervention for the treatment of Luminal A breast cancer with ER-positive, PR-positive, HER2-negative status and the low expression of Ki67. Our study suggests that Ano1 expression in combination of clinical relevant markers ER, PR, HER2, and Ki67 is useful for predicting clinical outcomes of breast cancer patients, especially those with luminal A breast cancer, following tamoxifen treatment. Therefore, in the future, Ano1 expression could be used to help better identify Luminal A breast cancer patients with more sensitivity to tamoxifen treatment. Furthermore, we found that Ki67 overexpression was significantly associated with a shorter OS in lymph node-positive patients with the high expression of Ano1. Multivariate Cox regression analysis
showed that Ki67 overexpression was a prognostic factor for shorter OS in lymph node-positive patients with the high expression of Ano1. These findings suggest that the expression of Ano1 and Ki67 may be used for predicting prognosis in breast cancer patients with lymph node metastasis.
In summary, Ano1 may inhibit or promote cell proliferation in different cells, suggesting that additional factors that regulate Ano1 expression and function may be involved in the cell-type specific mechanism. Since Ano1 expression is regulated by many ways such as genetic amplification [18], epigenetic regulation by HDAC [28] and promotor methylation [29], many signaling pathways can be potentially involved in regulation of Ano1 expression. Changes in Ano1 expression have been reported to determine whether cancer cells grow or migrate [29]. In the present study, we found that Ano1 was more associated with ER-positive, PR-positive, or HER2-negative patients with the low expression of Ki67, and Ano1 promoted cell proliferation in ER-positive, PR-positive, and HER2-negative MCF7 cells, but inhibited cell proliferation in ER-negative, PR-negative, and HER2-negative MDA-MB-435S cells. It appears that the ER, PR, and HER2 signaling pathways may affect the effect of Ano1 on cell proliferation. Ano1 has been found to activate different signaling pathways such as the ERK1/2 [30], TGF-β [22], nuclear factor-κB [31], EGFR and CAMK [18] signaling pathways. It remains to determine how certain pathways are activated in specific cells, and how activation of these signaling pathways affects the role of Ano1 in cell proliferation. Furthermore, we found that Ano1 overexpression was associated with longer OS in ER-positive, PR-positive or HER2-negative patients with the low expression of Ki67. These findings suggest Ano1 may be a potential marker for predicting clinical outcome in breast cancer subtypes defined by the ER, PR and HER2, and Ki67 status.
MATERIALS AND METHODS
Patients
The Medical Ethics Committee of China Medical University approved this retrospective study. Due to the retrospective nature of the study, the Ethics Committee waived the need of informed consent by the patients.
Human breast tissue samples were obtained from 407 female patients with sporadic breast cancer, who underwent surgery at the Department of Surgical Oncology and the Department of General Surgery at the First Hospital of China Medical University between January 2008 and December 2009. The diagnosis of breast cancer was histopathologically confirmed. The inclusion criteria for breast cancer patients were: 1) invasive ductal carcinoma (IDC) (n=396) and invasive lobular carcinoma (ILC) (n=11); 2) availability of complete clinical data
and follow-up status; 3) breast cancer samples were collected for analysis; 4) breast cancer patients initially diagnosed at our hospital without a previous history of radiation therapy, chemotherapy, and hormonal therapy; and 5) patients who underwent surgical removal at our hospital and received postoperative chemotherapy and/ or endocrine therapy. The exclusion criteria were: 1) incomplete clinical data; 2) ER, PR, and HER2 status were not tested, not recorded, or unknown; 3) HER2-positive status with 2+ immunostaining was not confirmed by fluorescent in situ hybridization (FISH); 4) patients who underwent postoperative radiation therapy; 5) patients who underwent adjuvant trastuzumab treatment; and 6) severe cardiovascular, pulmonary, renal, hepatic, and gastrointestinal diseases.
Clinicopathological data were retrospectively obtained from medical records. The following parameters were analyzed: patient age, menopausal status, family history, tumor size, histological grade, tumor stage, lymph node metastasis, ER status, PR status, HER2 status, and chemotherapeutic regimes. The histological grade of the cancer was determined according to the World Health Organization grading system. The stage of the cancer was evaluated according to the TNM staging system. ER, PR, and HER2 status were classified as positive and negative based on the immunohistochemistry (IHC) results in the medical records. ER-positive and PR-positive status were defined by >1% nuclear staining [37]. HER2 status was reported as follows: 0, 1+ for negative, 2+ for borderline, and 3+ for positive. HER2-immunostaining of 0-1+ and 3+ was defined as negative status and postive status, respectively. For tumors with HER2-immunostaining of 2+, FISH was performed to verify the positive status. HER2 gene amplification ratio of ≤2.2 and >2.2 by FISH was defined as negative, and HER2-postive status, respectively.
Tissue microarray (TMA) and immunohistochemistry
Paraffin donor blocks containing representative breast cancer samples were selected by reviewing the hematoxylin and eosin-stained slides. Tissue cores with a diameter of 1.5 mm were extracted from each donor block, and precisely arrayed into a new paraffin recipient block with a maximum of 200 cores, using the Organization Microarrayer (Pathology Devices, USA). Sections (4 μm thick) were obtained from formalin-fixed and paraffin-embedded TMA blocks, mounted on poly-L-lysine-coated glass slides, and used for immunohistochemistry.
Immunohistochemistry was performed as previously described [19]. Briefly, sections were deparaffinized with xylene, rehydrated in a graded alcohol series, and washed in distilled water. Sections were then incubated in primary antibodies against Ano1 (Abcam Biotechnology, USA) or Ki67 (Abcam Biotechnology,
USA) overnight at 4°C, followed by incubation with biotinylated secondary antibodies for 30 min at 37°C. The slides were then incubated with horseradish peroxidase-coupled streptavidin for additional 30 min (LSAB kit; Dako, Glostrup, Denmark), and stained with DAB (3, 3-diaminobenzidine). Sections were counterstained with hematoxylin, dehydrated, and mounted. Sections in which primary antibodies were replaced with normal rabbit IgG were used as negative controls.
Evaluation of immunohistochemistry
The immunostaining was evaluated by two pathologists blinded to the experimental conditions. The intensity of immunoreactivity was scored as follows: 0 for no staining, 1 for weak staining, 2 for moderate staining, and 3 for strong staining. The proportion of tumor cells was calculated as the percentage of Ano1- or Ki67-immunopositive cells over the total tumor cells. Five sections were selected from each sample. For each section, five fields were randomly selected. Scores was assigned by using 5% increments (0%, 5%, 10%, …100%) as previously reported [19, 38, 39]. The average score for each sample was used for assessing cutoff score for overexpression of Ano1 or Ki67, using receiver operating characteristic curve (ROC). To generate ROC curves, the sensitivity and specificity for each outcome under study was plotted.
Cell culture
The MCF7 and MDA-MB-435S cell lines were obtained from the American Type Culture Collection (ATCC, USA). The cells were maintained in Dulbecco’s Modified Eagle Medium (DMEM, Invitrogen, USA) containing 10% fetal bovine serum (HyClone, USA), 100 U/ml penicillin, and 100 mg/ml streptomycin in 5% CO2
in a humidified incubator at 37 °C. Cells were subcultured every 3 days, and used for the following experiments. Cell transfection
Plasmids containing Ano1 tagged with EGFP (enhanced green fluorescent protein) were kindly provided by Dr. U. Oh (Seoul National University, Korea). Ano1-overexpressing MCF7 or MDA-MB-435S cells were obtained by transfecting MCF7 or MDA-MB-435S cells with 1 μg Ano1 plasmids. Empty vectors were used as controls. After transfection for 48 h, cells were used for the following experiments.
Western blot analysis
Cells were homogenized in ice-cold lysis buffer after cell transfection for 48 h. Proteins were resolved by SDS–PAGE, and transferred onto polyvinylidene fluoride membranes by electroblotting. Membranes were
blocked with 5% milk, and then incubated with primary antibodies against Ano1 (1:3,000, Abcam Biotechnology, USA) or Ki67 (1:500, Abcam Biotechnology, USA) overnight at 4 °C. β-actin or histone was used as a loading control. Membranes were then incubated with horseradish peroxidase-conjugated goat anti-rabbit secondary antibodies (dilution 1:5,000, Abcam, USA) at room temperature for 1 h. Bands were visualized using an enhanced chemiluminescence detection system (Amersham, Freiburg, Germany).
Cell Counting Kit-8 (CCK-8) assay
Cell viability was measured by using CCK-8 assay (Dojindo, JAPAN). After transfected with Ano1 or empty vectors, MCF7 or MDA-MB-435S cells (8,000 cells/well) were seeded into 96-well plates (Coring, Lowell, MA). Cells were allowed to grow in the growth medium for 48 h. Cells were then incubated with WST-8 (2-(2-methoxy- 4-nitrophenyl)-3-(4-nitrophenyl)-5-(2,4-disulfophenyl)-2H-tetrazolium) for 2.5 h. Plates were read at 450 nm wavelength in a microplate reader (Anthos Labtec Instruments GmbH, Austria).
Immunofluorescence
After transfected with Ano1 or empty vectors, cells were grown on glass coverslips in six-well plates until confluence. Cells were then rinsed with PBS, and fixed in 4% paraformaldehyde for 10 min at room temperature. Cells were permeabilized with 0.5% Triton-X-100 for 10 min, rinsed in PBS, and blocked with normal goat serum for 1 h at room temperature. Cells were then incubated with primary antibodies against Ki67 (Abcam Biotechnology, USA) (1:100 dilution) overnight at 4°C, followed by incubation with FITC-conjugated secondary antibodies (1:300 dilution; Invitrogen) for 1 h at room temperature. Cells were then counterstained with DAPI (4’,6- diamidino-2-phenylindole) for 15 min. The cells were examined and photographed under a confocal microscope (FV1000S-SIM/IX81, Olympus). Ki67-positive cells were defined as cells with the immunopositive staining in the nuclei. Integral optical density (IOP) was measured by using the IPP software (National Institutes of Health, USA).
Flow cytometry
After transfected with Ano1 or empty vectors for 48 h, MCF7 or MDA-MB-435S cells were harvested and washed twice with cold PBS. Cells were then fixed with 70% ethanol and stored at 4 °C overnight. After rehydration with PBS, cells were treated with 20 μl (2 μg/ml) RNase A and incubated at 37 °C for 30 min. Cells were then stained with propidium iodide (PI, 50 μg/ml) for 1 h at 4 °C. Cells were analyzed for cell cycle by flow cytometry, using a MACSQuant instrument (Miltenyi, Germany).
Statistical analysis
Analyses were performed using SPSS 16.0 (Chicago, IL, USA). Categorical data were compared using Pearson chi square tests or Fisher’s exact probability tests. Survival probabilities were estimated by the Kaplan-Meier method and assessed by a log-rank test. Multivariate Cox proportional hazards regression models was used for assessing the association between potential confounding variables and prognosis (overall survival (OS), or disease-free survival (DFS)). Probability values <0.05 were considered statistically significant.
Abbreviations
Ano1, Anoctamin 1; OR, Odds ratio; CI, Confidence interval; DIC, Ductal invasive carcinoma; LIC, Lobular invasive carcinoma; ER, Estrogen receptor; PR, Progesterone receptor; HER2, Human epidermal growth factor receptor; Ki67, nuclear antigen Ki-67.
Author contributions
Study design: Huizhe Wu, Qinghuan Xiao, Minjie Wei. Methodology development: Jing Zhang, Qiuchen Chen, Xiaodong Wang, Ke Ma. Data acquisition and analysis: Huizhe Wu, Hui Wang, Shu Guan, Jing Zhang, Qiuchen Chen, Xiaodong Wang, Ke Ma, Pengfei Zhao, Haishan Zhao, Weifan Yao. Writing, review, and/ or revision of the manuscript: Huizhe Wu, Feng Jin, Qinghuan Xiao, Minjie Wei.Technical and material support: Pengfei Zhao, Haishan Zhao, Weifan Yao. Study supervision: Qinghuan Xiao, Minjie Wei.All authors discussed the results and commented on the manuscript.
ACKNOWLEDGMENTS
We gratefully appreciate the efforts and contributions of doctors, nurses, and technical staff at the First Hospital of China Medical University.
CONFLICTS OF INTEREST
All authors declare no conflict of interest with regard to the submitted manuscript.
FUNDING
This work was supported by grants from the National Natural Science Foundation of the People’s Republic of China (Grant No. 31371145, No. 81572613, and No.81402948), the Liaoning Key Laboratory of Molecular Targeted Anti-tumor Drug Development and Evaluation Program, the Educational Commission of Liaoning Province, China (Grant No. L2014315), the Research Fund
for the Doctoral Program of Higher Education of Liaoning Province, China (Grant No. 20141032), and the Liaoning Pandeng Scholar. the Key Laboratory Foundation from Shenyang S&T Projects(F16-094-1-00),Liaoning Province Scientific Research Foundation (2014226033),Program for Liaoning Innovative Research Team in University (No. LT2014016), and the S&T Projects in Shenyang, China (Grant No. F14-232-6-05).
REFERENCES
1. Yang YD, Cho H, Koo JY, Tak MH, Cho Y, Shim WS, Park SP, Lee J, Lee B, Kim BM, Raouf R, Shin YK, Oh U. TMEM16A confers receptor-activated calcium-dependent chloride conductance. Nature. 2008; 455: 1210-5. https:// doi.org/10.1038/nature07313.
2. Schroeder BC, Cheng T, Jan YN, Jan LY. Expression cloning of TMEM16A as a calcium-activated chloride channel subunit. Cell. 2008; 134: 1019-29. https://doi. org/10.1016/j.cell.2008.09.003.
3. Caputo A, Caci E, Ferrera L, Pedemonte N, Barsanti C, Sondo E, Pfeffer U, Ravazzolo R, Zegarra-Moran O, Galietta LJ. TMEM16A, a membrane protein associated with calcium-dependent chloride channel activity. Science. 2008; 322: 590-4. https://doi.org/10.1126/science.1163518. 4. Pedemonte N, Galietta LJ. Structure and function of
TMEM16 proteins (anoctamins). Physiol Rev. 2014; 94: 419-59. https://doi.org/10.1152/physrev.00039.2011. 5. Duran C, Hartzell HC. Physiological roles and diseases
of Tmem16/Anoctamin proteins: are they all chloride channels? Acta Pharmacol Sin. 2011; 32: 685-92. https:// doi.org/10.1038/aps.2011.48.
6. Hartzell HC, Yu K, Xiao Q, Chien LT, Qu Z. Anoctamin/ TMEM16 family members are Ca2+-activated Cl- channels. J Physiol. 2009; 587: 2127-39. https://doi.org/10.1113/ jphysiol.2008.163709.
7. Huang F, Wong X, Jan LY. International Union of Basic and Clinical Pharmacology. LXXXV: calcium-activated chloride channels. Pharmacol Rev. 2012; 64: 1-15. https:// doi.org/10.1124/pr.111.005009.
8. Sondo E, Caci E, Galietta LJ. The TMEM16A chloride channel as an alternative therapeutic target in cystic fibrosis. Int J Biochem Cell Biol. 2014; 52: 73-6. https:// doi.org/10.1016/j.biocel.2014.03.022.
9. Wang B, Li C, Huai R, Qu Z. Overexpression of ANO1/ TMEM16A, an arterial Ca2+-activated Cl- channel, contributes to spontaneous hypertension. J Mol Cell Cardiol. 2015; 82: 22-32. https://doi.org/10.1016/j. yjmcc.2015.02.020.
10. Namkung W, Phuan PW, Verkman AS. TMEM16A inhibitors reveal TMEM16A as a minor component of calcium-activated chloride channel conductance in airway and intestinal epithelial cells. J Biol Chem. 2011; 286: 2365-74. https://doi.org/10.1074/jbc.M110.175109.
11. Namkung W, Yao Z, Finkbeiner WE, Verkman AS. Small-molecule activators of TMEM16A, a calcium-activated chloride channel, stimulate epithelial chloride secretion and intestinal contraction. FASEB J. 2011; 25: 4048-62. https:// doi.org/10.1096/fj.11-191627.
12. Oh SJ, Hwang SJ, Jung J, Yu K, Kim J, Choi JY, Hartzell HC, Roh EJ, Lee CJ. MONNA, a potent and selective blocker for transmembrane protein with unknown function 16/anoctamin-1. Mol Pharmacol. 2013; 84: 726-35. https:// doi.org/10.1124/mol.113.087502.
13. West RB, Corless CL, Chen X, Rubin BP, Subramanian S, Montgomery K, Zhu S, Ball CA, Nielsen TO, Patel R, Goldblum JR, Brown PO, Heinrich MC, et al. The novel marker, DOG1, is expressed ubiquitously in gastrointestinal stromal tumors irrespective of KIT or PDGFRA mutation status. Am J Pathol. 2004; 165: 107-13. https://doi. org/10.1016/S0002-9440(10)63279-8.
14. Katoh M, Katoh M. FLJ10261 gene, located within the CCND1-EMS1 locus on human chromosome 11q13, encodes the eight-transmembrane protein homologous to C12orf3, C11orf25 and FLJ34272 gene products. Int J Oncol. 2003; 22:1375–81.
15. Carneiro A, Isinger A, Karlsson A, Johansson J, Jonsson G, Bendahl PO, Falkenback D, Halvarsson B, Nilbert M. Prognostic impact of array-based genomic profiles in esophageal squamous cell cancer. BMC Cancer. 2008; 8: 98. https://doi.org/10.1186/1471-2407-8-98.
16. Carles A, Millon R, Cromer A, Ganguli G, Lemaire F, Young J, Wasylyk C, Muller D, Schultz I, Rabouel Y, Dembele D, Zhao C, Marchal P, et al. Head and neck squamous cell carcinoma transcriptome analysis by comprehensive validated differential display. Oncogene. 2006; 25: 1821-31. https://doi.org/10.1038/sj.onc.1209203. 17. Ubby I, Bussani E, Colonna A, Stacul G, Locatelli M, Scudieri P, Galietta L, Pagani F. TMEM16A alternative splicing coordination in breast cancer. Mol Cancer. 2013; 12: 75. https://doi.org/10.1186/1476-4598-12-75.
18. Britschgi A, Bill A, Brinkhaus H, Rothwell C, Clay I, Duss S, Rebhan M, Raman P, Guy CT, Wetzel K, George E, Popa MO, Lilley S, et al. Calcium-activated chloride channel ANO1 promotes breast cancer progression by activating EGFR and CAMK signaling. Proc Natl Acad Sci U S A. 2013; 110: E1026-34. https://doi.org/10.1073/ pnas.1217072110.
19. Wu H, Guan S, Sun M, Yu Z, Zhao L, He M, Zhao H, Yao W, Wang E, Jin F, Xiao Q, Wei M. Ano1/TMEM16A Overexpression Is Associated with Good Prognosis in PR-Positive or HER2-Negative Breast Cancer Patients following Tamoxifen Treatment. PLoS One. 2015; 10: e0126128. https://doi.org/10.1371/journal.pone.0126128. 20. Liu W, Lu M, Liu B, Huang Y, Wang K. Inhibition
of Ca(2+)-activated Cl(-) channel ANO1/TMEM16A expression suppresses tumor growth and invasiveness in human prostate carcinoma. Cancer Lett. 2012; 326: 41-51. https://doi.org/10.1016/j.canlet.2012.07.015.
21. Sauter DR, Novak I, Pedersen SF, Larsen EH, Hoffmann EK. ANO1 (TMEM16A) in pancreatic ductal adenocarcinoma (PDAC). Pflugers Arch. 2015; 467:1495–508.
22. Liu F, Cao QH, Lu DJ, Luo B, Lu XF, Luo RC, Wang XG. TMEM16A overexpression contributes to tumor invasion and poor prognosis of human gastric cancer through TGF-beta signaling. Oncotarget. 2015; 6: 11585-99. https://doi. org/10.18632/oncotarget.3412.
23. Akpalo H, Lange C, Zustin J. Discovered on gastrointestinal stromal tumour 1 (DOG1): a useful immunohistochemical marker for diagnosing chondroblastoma. Histopathology. 2012; 60:1099–106.
24. Ayoub C, Wasylyk C, Li Y, Thomas E, Marisa L, Robe A, Roux M, Abecassis J, de Reynies A, Wasylyk B. ANO1 amplification and expression in HNSCC with a high propensity for future distant metastasis and its functions in HNSCC cell lines. Br J Cancer. 2010; 103: 715-26. https://doi.org/10.1038/sj.bjc.6605823.
25. Ruiz C, Martins JR, Rudin F, Schneider S, Dietsche T, Fischer CA, Tornillo L, Terracciano LM, Schreiber R, Bubendorf L, Kunzelmann K. Enhanced expression of ANO1 in head and neck squamous cell carcinoma causes cell migration and correlates with poor prognosis. PLoS One. 2012; 7: e43265. https://doi.org/10.1371/journal. pone.0043265.
26. Wanitchakool P, Wolf L, Koehl GE, Sirianant L, Schreiber R, Kulkarni S, Duvvuri U, Kunzelmann K. Role of anoctamins in cancer and apoptosis. Philos Trans R Soc Lond B Biol Sci. 2014; 369: 20130096. https://doi. org/10.1098/rstb.2013.0096.
27. Early Breast Cancer Trialists' Collaborative Group (EBCTCG). Effects of chemotherapy and hormonal therapy for early breast cancer on recurrence and 15-year survival: an overview of the randomised trials. Lancet. 2005; 365: 1687-717. https://doi.org/10.1016/S0140-6736(05)66544-0. 28. Matsuba S, Niwa S, Muraki K, Kanatsuka S, Nakazono
Y, Hatano N, Fujii M, Zhan P, Suzuki T, Ohya S. Downregulation of Ca2+-activated Cl- channel TMEM16A by the inhibition of histone deacetylase in TMEM16A-expressing cancer cells. J Pharmacol Exp Ther. 2014; 351: 510-8. https://doi.org/10.1124/jpet.114.217315.
29. Shiwarski DJ, Shao C, Bill A, Kim J, Xiao D, Bertrand CA, Seethala RS, Sano D, Myers JN, Ha P, Grandis J, Gaither LA, Puthenveedu MA, et al. To "grow" or "go": TMEM16A expression as a switch between tumor growth and metastasis in SCCHN. Clin Cancer Res. 2014; 20: 4673-88. https://doi.org/10.1158/1078-0432.CCR-14-0363. 30. Duvvuri U, Shiwarski DJ, Xiao D, Bertrand C, Huang X, Edinger RS, Rock JR, Harfe BD, Henson BJ, Kunzelmann K, Schreiber R, Seethala RS, Egloff AM, et al. TMEM16A induces MAPK and contributes directly to tumorigenesis and cancer progression. Cancer Res. 2012; 72: 3270-81. https://doi.org/10.1158/0008-5472.CAN-12-0475-T. 31. Liu J, Liu Y, Ren Y, Kang L, Zhang L. Transmembrane
promotes glioma formation through the nuclear factor-κB signaling pathway. Mol Med Rep. 2014; 9:1068–74. 32. Stanich JE, Gibbons SJ, Eisenman ST, Bardsley MR,
Rock JR, Harfe BD, Ordog T, Farrugia G. Ano1 as a regulator of proliferation. Am J Physiol Gastrointest Liver Physiol. 2011; 301: G1044-51. https://doi.org/10.1152/ ajpgi.00196.2011.
33. Buchholz B, Faria D, Schley G, Schreiber R, Eckardt KU, Kunzelmann K. Anoctamin 1 induces calcium-activated chloride secretion and proliferation of renal cyst-forming epithelial cells. Kidney Int. 2014; 85: 1058-67. https://doi. org/10.1038/ki.2013.418.
34. Wang M, Yang H, Zheng LY, Zhang Z, Tang YB, Wang GL, Du YH, Lv XF, Liu J, Zhou JG, Guan YY. Downregulation of TMEM16A calcium-activated chloride channel contributes to cerebrovascular remodeling during hypertension by promoting basilar smooth muscle cell proliferation. Circulation. 2012; 125: 697-707. https://doi. org/10.1161/CIRCULATIONAHA.111.041806.
35. Zhang XH, Zheng B, Yang Z, He M, Yue LY, Zhang RN, Zhang M, Zhang W, Zhang X, Wen JK. TMEM16A and Myocardin Form a Positive Feedback Loop That Is Disrupted by KLF5 During Ang II-Induced Vascular Remodeling. Hypertension. 2015; 66: 412-21. https://doi. org/10.1161/HYPERTENSIONAHA.115.05280.
36. Bertucci F, Birnbaum D. Reasons for breast cancer heterogeneity. J Biol. 2008; 7: 6. https://doi.org/10.1186/ jbiol67.
37. Hammond ME, Hayes DF, Dowsett M, Allred DC, Hagerty KL, Badve S, Fitzgibbons PL, Francis G, Goldstein NS, Hayes M, Hicks DG, Lester S, Love R, et al. American Society of Clinical Oncology/College Of American Pathologists guideline recommendations for immunohistochemical testing of estrogen and progesterone receptors in breast cancer. J Clin Oncol. 2010; 28: 2784-95. https://doi.org/10.1200/JCO.2009.25.6529.
38. Fang Y, Wei J, Cao J, Zhao H, Liao B, Qiu S, Wang D, Luo J, Chen W. Protein expression of ZEB2 in renal cell carcinoma and its prognostic significance in patient survival. PLoS One. 2013; 8: e62558.
39. Zhu W, Cai MY, Tong ZT, Dong SS, Mai SJ, Liao YJ, Bian XW, Lin MC, Kung HF, Zeng YX, Guan XY, Xie D. Overexpression of EIF5A2 promotes colorectal carcinoma cell aggressiveness by upregulating MTA1 through C-myc to induce epithelial-mesenchymaltransition. Gut. 2012; 61: 562–75.
40. Bertucci F, Birnbaum D. Reasons for breast cancer heterogeneity. J Biol. 2008; 7: 6.
41. Goldhirsch A, Winer EP, Coates AS, Gelber RD, Piccart-Gebhart M, Thürlimann B, Senn HJ; Panel members. Personalizing the treatment of women with early breast cancer: highlights of the St Gallen International Expert Consensus on the Primary Therapy of Early Breast Cancer 2013. Ann Oncol. 2013; 24: 2206-2223.
![catena Poly[[[diaquacopper(II)] bis[μ 1,1′ (butane 1,4 diyl)diimidazole κ2N3:N3′]] dinitrate]](data:image/gif;base64,R0lGODlhAQABAIAAAP///wAAACH5BAEAAAAALAAAAAABAAEAAAICRAEAOw==)