Dipartimento di Politiche Pubbliche e Scelte Collettive – POLIS
Department of Public Policy and Public Choice – POLIS
Working paper n. 51 April 2005
Tax system and tax reforms in India
Luigi Bernardi and Angela Fraschini
TAX SYSTEM AND TAX REFORMS IN INDIA
by
Luigi Bernardi and Angela Fraschini
University of Pavia and University of Eastern Piedmont - Italy
Abstract
This paper is part of a wider research on South-East Asia countries’ taxation carried on under the supervision of. V. Tanzi. India is a federal republic and a big, highly populated and poor country, which however since some years has entered the catching up stage of development and shows im-pressive rates of GDP growth. General Government budget is structurally imbalanced and public debt stays high. Public spending (about 25 percent of GDP) is mainly devoted to general services, defense, and the support of economic activities, rather than to public health and welfare programs. Total fiscal pressure (about 17 percent of GDP) is in line with per capita GDP and is shared evenly enough between central and states governments. The structure of the tax system is not much be-yond the Musgravian “early stage”. A complex structure of taxes on goods and services is largely the main heading of the tax system and it is difficultly moving towards a VAT-kind structure. Di-rect taxes still are in an infant state, both as weight as well as structure. Import duties remain at not negligible levels. Social contributions are entirely lacking. A tax system of a country like India unavoidably raises more than one problem: foremost among these problems appear to be a too large dominance of a complex and obsolete indirect taxation and the fiscal relations among gov-ernment layers. The road to updating and improving the Indian tax system has been entered since the early 1990s, but the reform is still largely to be accomplished. Introducing VAT – so success-fully adopted in other developing countries – is the most striking but not the only example.
JEL Classification numbers: H20, H24, H25, H29
1. Introduction, contents and main conclusions
India is a federal republic with an area of 3,287,590 sq. km and the population in 2002 stood at about one billion and 52 million persons and the population density (people per square kilometer) was 320. At the turn of the century, GDP totals about US$ 440 billion. This aggre-gate figure stays at the world’s fourth place, but its per capita counterpart is less than US$ 450. Poverty remains an enormous problem: according to World Bank, India has some 433 million people living on less than US$ 1 a day, 36 percent of the total number of poor in the world. Also non-income poverty represents a huge problem and many social indicators are going bad. This notwithstanding, India’s economic performance has been impressive over the last two decades. Total GDP grew yearly at about 6 percent, per capita GDP at about 4 per-cent.
During the 1990s the average gross fiscal deficit level was 7.2 percent of GDP, while during latest years gross fiscal deficit went up to the 9-10 percent of GDP range. The general government debt fell from 72.5 percent of GDP in 1990-91 to 65.1 percent at the middle of 1990s, but then rose to 79.8 percent in 2001-2002. At the late 1990s Indian general govern-ment public expenditure totaled near 25 percent of GDP. This figure is not low with respect to the Indian per capita income. However the joint share of education and health is poor and that of social security is still poorer.
Around the turn of the century, about 80 percent of public expenditure is financed by means of taxes, whose total pressure stays around 15 percent of GDP. Central government collects more than half of tax revenue, but about a quarter is transferred to the states. Taxes on goods and services are definitively the dominant item (60 percent of total taxes). Direct taxes’ revenue is far lower and barely reaches 20 percent of total taxes. On the contrary, import du-ties are still a not negligible share (about 12 percent) of total taxation’s yield. Finally, social contributions are wholly lacking.
Beginning with the early 1990s Indian tax system entered a way of reforms. Until now the accomplishments were of some relevance but neither radical nor fast coming. They largely are still under way or planned for the incoming years (see below). Obviously one must be aware that the economic structure as well as administrative difficulties severely constrains tax system’s features in developing countries. Anyway in India the change over to the typical “modern” system (PIT+CIT+VAT+ few large excise duties) has not been accomplished yet and it is still expected to be take place and being completed in the near future.
India has a tax structure with a three-tier federal structure (the union government, the state governments and the urban/rural local bodies). The main taxes/duties that the union gov-ernment is empowered to levy are: income tax, customs duties, excise duties, sales tax and service tax. It is worthwhile to notice some peculiar features of this tax bundle. Income tax is a single tax that is levied on a comprehensive basis both on persons and companies. The structure of custom duties is particularly intricate and the burden hits almost entirely the im-port side of international trade. Also internal indirect taxes are a complicated matter: they are separately levied on goods, services and intra-states’ sales. During the time excise duties and service tax had benefited of a credit system compensating paid tax on inputs and capital goods that has grown to avoid cascading effects and to approximate a VAT-type structure.
The main taxes levied by the state governments are sales tax, stamp duty, state excise, land revenue, duty on entertainment and tax on professions & callings. The local bodies are empowered to levy tax on properties, octroi, tax on markets and tax/user charges for utilities.
Indian tax system is still too largely made up of a big, complex and obsolete bundle of excises and sales taxes. The room of the direct taxation, both on individuals and companies, is very smaller. Consequently a number of issues arise. The share of the personal income tax is more limited than in countries where the value of the per capita income is not far from the In-dian one. This may be aimed to preserve poverty income from taxation, but unavoidably the poor are then hit by regressive consumption taxes. Furthermore, the argument that the collec-tion costs are higher for the direct than for the indirect taxes does not seem well demonstrated. Finally, some traditional argument of economic theory - i.e. that the income tax is not ade-quately saving preserving and might induce supply disincentives - is not consistent with the situation of Indian economy. Relative to the companies’ taxation, its basis should be broad-ened through the reduction of a large number of multifaceted incentives. To conclude on this point, a great deal of rationalization is still mandatory to avoid cascading effects - between na-tional excises and states’ sales tax -, random ‘all in’ rates charged on final goods, and high costs of collection. Since few years the long-term strategy moves towards a double VAT sys-tem (union and states), leaving to survive just some excises on specific goods.
As we have already noticed, India is a federal republic (union and states) with a com-plex structure of local authorities. The assignment of tax powers is based on the principle of tax separation and the consequence is a vertical fiscal imbalance. The inadequacy of the states
to meet expenditure from their own resources is recognized by the Constitution, which pro-vides for grant-in-aid both purposed-based and need-based.
Since the last two decades impressive catching-growth is going on in the Indian econ-omy. In 2003-04 real GDP at factor cost has been estimated to have grown by 8.2 percent and was accompanied by a relative stability of prices.
The fiscal deficit of the central government, in GDP terms, after declining from 6.6 per-cent in 1990-91 to 4.1 perper-cent in 1996-97, started rising to 5.3 perper-cent in 2002-03. The com-bined fiscal deficit of the centre and the states increased from a level of 9.4 percent of GDP in 1990-91 to a level of 10.1 percent of GDP in the revised estimates for 2002-03.
In 1991, in reaction to a severe macroeconomic crisis involving high fiscal deficits, India carried out a series of economic reforms, among which a tax reform. The main proposals comprised: a) the reduction in the rates of the most important taxes; b) the enlargement of all taxes’ bases; c) the transformation of the taxes on domestic production into something similar to a value added tax; d) the simplification of laws and administrative procedures. Most of the recommendations have been implemented over the years, at least at the central level. In the case of the states the reforms of their tax systems did not proceed.
In September 2002 the Government set up a new Task Force on tax reforms headed by V. Kelkar. The Kelkar committees suggested sweeping reforms including: a) raising the limits of income tax exemption and two-tier brackets; b) cut in corporate tax rate; c) three-rate basic customs duty structure; d) service tax levied in a comprehensive manner; e) repeal of wealth tax; f) removal of tax exemptions, rationalization of incentives for savings and simplification of procedures; g) gradual moving over the destination based, consumption type value added taxes at the state level.
The introduction of VAT was repeatedly postponed, mainly because of the lack of admin-istrative preparation and of disagreements between union government and some states. In July 2004 a Task Force on Implementation of Fiscal Responsibility and Budget Act, also headed by V. Kelkar, has come up with a proposal for an integrated VAT on goods and services to be levied by the central government and the states in parallel, removing all cascading taxes. Of course dismantling and deeply reforming about 60 percent of taxation will be an operation neither easy nor without the risk of loosing yield.
2. A broad view of tax system and its developments since the late 1980s
2.1 A short reminder of the Indian economy and a public sector outline
India was a British colony and it earned its independence on the 15th August 1947. It is a republic with a federal constitution, consisting of 28 states and seven union territories. India has an area of around 3.3 million sq. km., and it is the seventh largest country in the word. The population rose by 184.4 percent between 1951 and 2001 and on 1st March 2001 stood at about one billion and 27 million persons. Notwithstanding an infant mortality rate of 6.4 per-cent in 2002, population is still rapidly increasing (2.4 perper-cent in 2002 and 1.44 perper-cent esti-mated in 2004).
The country is characterized by striking contrasts, with huge linguistic, religious and cultural diversity. Poverty remains an enormous problem: according to World Bank figures, India has some 433 million people living on less than US$ 1 a day, 36 percent of the total number of poor in the world. Also non-income poverty represents a big problem: about 25 percent of world’s maternal deaths, about 23 percent of the world’s under-five child deaths every year and about 20 percent of the world’s children (aged 6-14) out of school are esti-mated to be in India. The general UN index of human development stays at the 111th place in the world, with a value equal to 0.590 in 2001; endemic diseases are widely diffused.
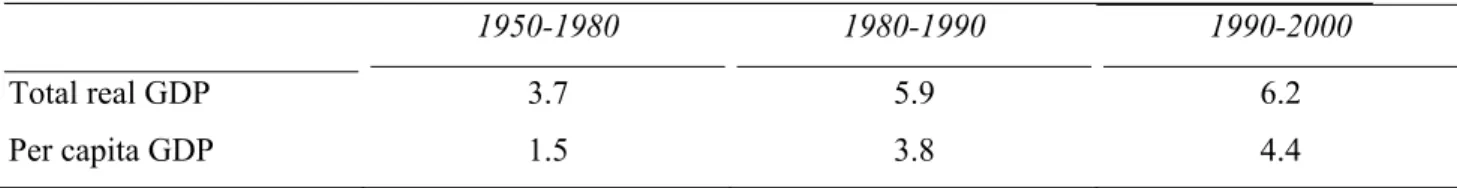
This notwithstanding, India’s economic performance has been impressive over the last two decades, while in the previous period its rate of economic growth appears ordinary (see Table 1).
Tab. 1 - Indian yearly percent rates of economic growth
1950-1980 1980-1990 1990-2000
Total real GDP 3.7 5.9 6.2
Per capita GDP 1.5 3.8 4.4
Source: IMF data quoted in DeLong (2001).
In the mid-1980s and in the 1990s India has been one of the fastest growing economies in the world, with a doubling time for average GDP per capita of only sixteen years. A large share of GDP originated in the services sector that accompanied the relative decline in the
Tab. 2 Percent shares of Indian GDP
1980 1990 2000
Agriculture 38.6 31.3 24.9
Industry 24.2 27.6 26.9
Services 37.2 41.1 48.2
Source: World Bank data quoted in Panagariya (2004)
While the conventional wisdom imputes the growth acceleration to neo-liberal eco-nomic reforms of the 1990s, according to DeLong (2001) the sources of that acceleration have to be found in some relatively minor reforms undertaken by Rajiv Gandhi’s government. Other scholars attribute the acceleration in growth in the 1980s to liberalization of trade and industry (see, for example, Pursell 1992 and Desai 1999).
During the 1980s growth was also driven by fiscal expansion financed by borrowing abroad and at home. But this was unsustainable and led to a crisis in 1991. General govern-ment’s (centre plus states consolidates) gross fiscal deficit averaged 9 percent of GDP in the second half of 1980s. The period 1992/93-1996/97 (Eighth Plan) has been one of high growth (the average real GDP growth rate was 7.1 percent yearly) and of fiscal restraint (the average gross fiscal deficit level was 7.2 percent of GDP against 9.3 percent in 1990-91). In the same period, the average revenue deficit (current spending minus revenues) was 3.6 percent of GDP (4 percent in 1990/91) and the average primary deficit (fiscal deficit minus interest payments) was 2.1 percent of GDP (4.8 percent in 1990/91).
During the Ninth Plan period (1997/98-2001/02) gross fiscal deficit returned to the 9-10 percent of GDP range, the level of the mid-1980s; the revenue deficit and the primary deficit rose, respectively, to 6.1 and 3.5 percent of GDP. The general government debt fell from 72.5percent of GDP in 1990/91 to 65.1percent at the end of the Eighth Plan period, but then rose to 79.8 percent at the end of the Ninth Plan period
.
In 1998 (GFSY 2001: last data available), Indian general government public expendi-ture totaled near 25 percent of GDP, net from intra-national transfers. The shares of central (11.9 percent) and states government (the remaining 13.1 percent) were rather even. However the two layers’ specific items were rather different. The central government was engaged mainly in defense, economic affairs & services (agriculture, transports, communications and
so forth) and to pay a huge amount of interests (4.1 percent of GDP) on public debt. States governments devoted their resources mainly to education (3.5 percent of GDP), quite less to health (0.5 percent) and, on the contrary, somewhat more to economic services, especially ag-riculture (1.4 percent).
Surprisingly enough, social security and welfare programs were virtually absent at the central level, and small also at the states’ tier (0.6 percent of GDP).1 On the contrary, general administration, law & order and defense all together reach more than 7 percent of GDP, i.e. near a third of total spending.
A comparison with the whole of developing countries (Burgess and Stern 1993) shows that total spending is not low in India, especially with respect to the per capita income, nor that of general administration and defense stays far from the average of these countries. However the share of joint education and health is poor and it is still poorer that of social security -also taking into account the caveat reported on the reliability of the data. This happens in a country where many social indicators are going badly, as we have already seen.
2.2 The tax system broad structure and its development
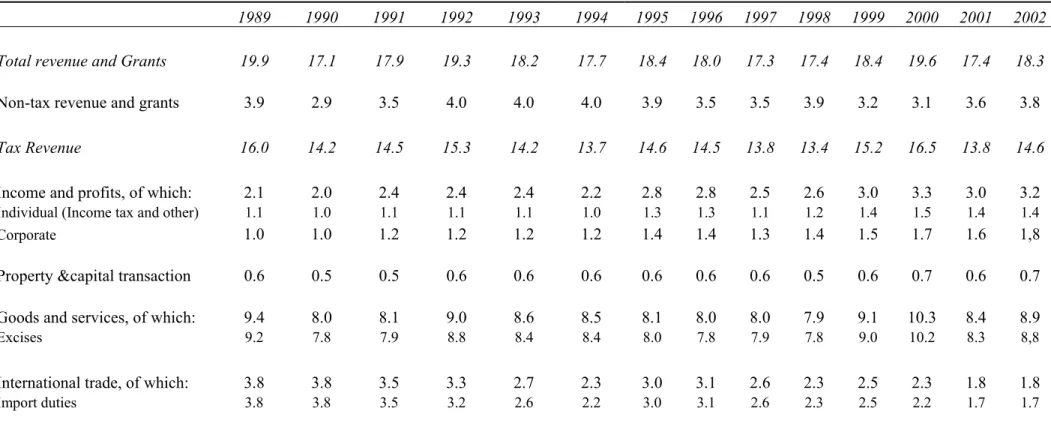
Tables 3, 4 and 5 show the broad quantitative structure of the Indian tax system and its devel-opments since the late 1980s until the first years of the current century. Data are shown for consolidated general, central and states’ governments.2 At the turn of the century, tax revenue amounts to about 80 percent of total general government revenue (Table 3). The remaining 20 percent is a not-homogeneous item, made up of tariffs, foreign grants, interest and so forth. Its level is anyway not negligible, higher than it is usually experienced in more advanced coun-tries.
By considering the average values among those of the years shown by the Table 3, total tax pressure is something less than 15 percent of GDP. Taxes on goods and services -almost en-tirely by excise duties- are definitively the dominant item (near 10 percent of GDP and 60
1 The figures in the text however may be under reported. Some welfare spending could in fact be hidden inside certain agricultural or other economic activities’ support. Furthermore, welfare services are largely supplied by local authorities whose accounts are largely defective.
2 The main source is IMF GFSY (2000, 2001). It has been integrated especially with the aid of Baird and Ferro (2003); Imf (2003); India Union Budget (1995-2002). General government account is an own estimate, this ac-count being not available in official data sources. We cleaned central government acac-counts from states’ share taxes and highlighted states’ grants revenue from the union. These data are mainly drawn from Baird and Ferro (2003), from whom the GDP series is drawn too. Pay the due care to the fact that these sources are not perfectly
percent of total taxes). Direct taxes’ revenue is far lower and barely reaches less than 3 per-cent of GDP and not more than 20 perper-cent of total taxes. One may calculate that this figure can be split almost evenly between individuals and corporations, also if they are both subject to the same single personal tax3. Property taxes are very narrow, especially by considering that they include also capital transactions’ tax yield. On the contrary, import duties accounted on average for a not negligible share (about 20 percent) of total taxation. Finally, social con-tributions are entirely lacking, like it is common in developing countries and as one could suspect from the low level of social services & welfare programs we have already spoken about.
A comparison between the Indian tax structure and its counterparts prevailing in other developing countries (e.g. Burgess and Stern 1993; Tanzi, 1994) relatively shows a somewhat outdated picture. The total Indian fiscal pressure is just slightly lower than the figure prevail-ing in those countries where per-capita income is near to the Indian value. However Indian di-rect taxes appear comparatively very low, while indidi-rect ones stay quite high and the share of import duties is relatively low.
The development of general government tax structure does not show striking changes since the late 1980s to the turn of the century, but just some -also relevant- ups and downs and some increasing/decreasing trends as to certain tax items. The total fiscal pressure went down since the beginning of the 1990s. A recovery emerged at the end of the decade but it has been not confirmed during last years. This movement is explained almost at all by the analogous one of excise duties and it was due to the rates’ reductions that were adopted at that time (see below). Personal taxes gained one point of GDP -i.e. 50 percent of the starting value- while the share of import duties more than halved itself.
Notwithstanding this somewhat static picture, a lot of reforms were introduced into In-dian tax system during the 1990s, on the wave of the proposals the Tax Reforms Committee, chaired by R. J. Chelliah in 1991 (Shome 1997; Rao 2000; Sarma and Gupta 2002). Broaden-ing the bases, reducBroaden-ing tax rates, simplifyBroaden-ing the system, makBroaden-ing it more supply friendly and attractive for FDI were the main aims of the suggested reforms. But the accomplishments
3 A Kaldor-type expenditure tax was levied in 1956-57, but it was repealed three years later because of its reve-nue shortage (Rao 2000).
Tab. 3 - Structure and developments of consolidated General Government revenue - 1989-2002 - Percentage of GDP
1989 1990 1991 1992 1993 1994 1995 1996 1997 1998 1999 2000 2001 2002 Total revenue and Grants 19.9 17.1 17.9 19.3 18.2 17.7 18.4 18.0 17.3 17.4 18.4 19.6 17.4 18.3
Non-tax revenue and grants 3.9 2.9 3.5 4.0 4.0 4.0 3.9 3.5 3.5 3.9 3.2 3.1 3.6 3.8
Tax Revenue 16.0 14.2 14.5 15.3 14.2 13.7 14.6 14.5 13.8 13.4 15.2 16.5 13.8 14.6
Income and profits, of which: 2.1 2.0 2.4 2.4 2.4 2.2 2.8 2.8 2.5 2.6 3.0 3.3 3.0 3.2
Individual (Income tax and other) 1.1 1.0 1.1 1.1 1.1 1.0 1.3 1.3 1.1 1.2 1.4 1.5 1.4 1.4
Corporate 1.0 1.0 1.2 1.2 1.2 1.2 1.4 1.4 1.3 1.4 1.5 1.7 1.6 1,8
Property &capital transaction 0.6 0.5 0.5 0.6 0.6 0.6 0.6 0.6 0.6 0.5 0.6 0.7 0.6 0.7
Goods and services, of which: 9.4 8.0 8.1 9.0 8.6 8.5 8.1 8.0 8.0 7.9 9.1 10.3 8.4 8.9
Excises 9.2 7.8 7.9 8.8 8.4 8.4 8.0 7.8 7.9 7.8 9.0 10.2 8.3 8,8
International trade, of which: 3.8 3.8 3.5 3.3 2.7 2.3 3.0 3.1 2.6 2.3 2.5 2.3 1.8 1.8
Import duties 3.8 3.8 3.5 3.2 2.6 2.2 3.0 3.1 2.6 2.3 2.5 2.2 1.7 1.7
Sources: Own calculations (see text) according to: Imf, Government Finance Statistical Yearbook, 2000 and 2001; Baird and Ferro (World Bank, 2003); Imf (2003: India Selected Issues); Ministry of Finance of India (Union Budget: various years).
Tab.4 - Structure and development of consolidated Central Government revenue - 1989-2002 - Percentage of GDP
1989 1990 1991 1992 1993 1994 1995 1996 1997 1998 1999 2000 2001 2002 Total current revenue and Grants 9.0 10.7 11.6 11.1 9.6 10.3 10.2 10.1 9.3 9.1 9.9 9.8 9.4 9.6
Non-tax revenue 0.8 2.8 3.6 3.4 3.3 3.1 3.3 3.2 3.1 3.1 3.3 3.2 3.5 3.4
Gross Tax Revenue 11.0 10.5 10.7 10.6 9.0 7.8 9.4 9.4 9.1 8.3 8.9 9.0 8.1 8.4
Income and profits, of which: 2.1 2.0 2.4 2.4 2.4 2.2 2.8 2.8 2.5 2.6 3.0 3.3 3.0 3.2
Individual (Income tax and other) 1.1 1.0 1.1 1.1 1.1 1.0 1.3 1.3 0.0 1.2 1.4 1.5 1.4 1.4
Corporate 1.0 1.0 1.2 1.2 1.2 1.2 1.4 1.4 1.3 1.4 1.5 1.7 1.6 1,8
Goods and services, of which: 5.0 4.7 4.7 4.5 3.9 3.2 3.5 3.4 3.3 3.2 3.3 3.4 3.3 3.4
Excises 4.8 4.5 4.5 4.3 3.7 3.1 3.4 3.3 3.2 3.1 3.2 3.3 3.2 3,2
International trade, of which: 3.8 3.8 3.5 3.3 2.7 2.3 3.0 3.1 2.6 2.3 2.5 2.3 1.8 1.8
Import duties 3.8 3.8 3.5 3.2 2.6 2.2 3.0 3.1 2.6 2.3 2.5 2.2 1.7 1,7
Less States' Share 2.8 2.6 2.7 2.8 2.7 2.1 2.4 2.6 2.9 2.2 2.2 2.5 2.3 2.2
Net Tax Revenue 8.2 7.9 8.0 7.7 6.3 6.7 6.9 6.9 6.3 6.0 6.6 6.5 5.9 6.3
Sources: Own calculations (see text) according to: Imf, Government Finance Statistical Yearbook, 2000 and 2001; Baird and Ferro (World Bank, 2003); Imf (2003: India Selected Issues); Ministry of Finance of India (Union Budget: various years).
Tab. 5 - Structure and developments of states government revenue - 1989-2002 - Percentage of GDP
1989 1990 1991 1992 1993 1994 1995 1996 1997 1998 1999 2000 2001 2002 Total current revenue and grants 11.2 11.6 11.9 12.1 11.8 11.5 10.6 10.5 10.5 9.8 9.9 10.6 10.6 11.3
Non-tax revenue 1.2 1.3 1.4 1.3 1.3 1.3 1.2 1.1 1.0 0.9 1.0 1.1 1.1 1,1
Grants from National Government 1.8 2.3 2.4 2.5 2.5 2.4 2.0 1.7 1.6 1.5 1.5 1.7 1.6 1.8
Tax Revenue of which: 8.1 8.0 8.1 8.2 8.1 7.9 7.4 7.6 7.9 7.4 7.4 7.8 7.8 8.3
State shares in central taxes 2.8 2.6 2.7 2.8 2.6 2.5 2.4 2.5 2.6 2.3 2.2 2.4 2.4 2.5
Own taxes of which: 5.3 5.4 5.4 5.4 5.4 5.4 5.1 5.1 5.3 5.1 5.2 5.4 5.5 5.8
Goods and services 4.7 4.8 4.8 4.8 4.8 4.8 4.5 4.5 4.7 4.5 4.6 4.8 4.9 5,1
Property & capital transaction 0.6 0.5 0.6 0.6 0.6 0.6 0.6 0.6 0.6 0.6 0.6 0.6 0.6 0.7
Sources: Own calculations (see text) according to: Imf, Government Finance Statistical Yearbook, 2000 and 2001; Baird and Ferro (World Bank, 2003); Imf (2003: India Selected Issues); Ministry of Finance of India (Union Budget: various years).
were somewhat more limited than the initial challenging design, as we will see at the end of this chapter.
During the 1990s the central government collected near two third of consolidated tax revenue, but about a quarter was transferred to the states, so that the net tax revenue was al-most evenly distributed between the two main government layers. The tax mix of central gov-ernment was far more balanced than it was at general govgov-ernment’s level. The union budget appropriates all direct taxes and import duties, and about half of total excise duties. The rela-tive weight of these three items is about the same. During the 1990s, excise duties went down, as also import duties did. Notwithstanding the increase in direct taxes, central government to-tal tax pressure showed an overall decreasing trend, albeit with ups and downs.
A more flat level of total tax revenue is on the contrary showed by states’ accounts, with the exception of some decrease during the second half of the 1990s. The two main headings of tax financing –both quite stable during the decade- are the shares in central taxes (about one third) and states’ own taxes. The latter are also almost all excise duties so that this is the dominant item also in tax financing of the states. Finally it is worthwhile to notice that the share of taxes is just a half of states’ total revenue, once that the former is cleaned from the contribution of central government’s taxes.
To sum up, the Indian tax system seems to slowly moving from the traditional features of the Musgrave’s “early stage” (Musgrave 1969). Obviously the economic structure and ad-ministrative capabilities severely constrain tax system’s features in developing countries. The large share of agriculture and the prevailing small scale of early manufacturing prevent the determination of business income. Therefore income tax could be effectively applied just to wage income of the civil servants and to the employees of large firms. Retail or multiple-stage sales taxation is difficult to be effectively implemented. However in India the changeover to the typical “modern” system (PIT+CIT+VAT + few large excise duties) has not been accom-plished yet or just it is in the starting stage.
3. Some quantitative and institutional features of main taxes
India has a tax structure with a three-tier federal structure (the union government, the state governments and the urban/rural local bodies). The power to levy taxes and duties is distrib-uted between the union government and the state governments in accordance with the
provi-sions of the Indian Constitution4. The state government may delegate any of its fiscal powers to local authorities that do not have any constitutionally reserved powers of taxation. The main taxes/duties that the union government is empowered to levy are: income tax (except tax on agricultural income, which the state governments can levy), customs duties, excise duties (except on alcoholic liquors or narcotics), sales tax and service tax. The principal taxes levied by the state governments are sales tax (tax on intra-state sale of goods), stamp duty (duty on transfer of property), state excise (duty on manufacture of alcohol), land revenue (levy on land used for agricultural/non-agricultural purposes), duty on entertainment and tax on profes-sions & callings. The local bodies are empowered to levy tax on properties (buildings, etc.), octroi (tax on entry of goods for use/consumption within areas of the local bodies), tax on markets and tax/user charges for utilities like water supply, drainage, etc.
3.1 Direct Taxes 3.1.1 Income Tax
Income tax is charged under the Indian Income Tax Act, 1961. It is an annual tax on income of both individuals and companies5 levied by the union government.
Every person (individuals, Hindu undivided families, companies, firms, association of persons or bodies of individuals and all other artificial juridical persons), whose total income exceeds the maximum exemption limit, is chargeable to the income tax at the rates prescribed in the Finance Act passed each year by the parliament. The income tax is paid on the total in-come of an individual, determined on the basis of her/his residential status in India6.
The tax is charged in respect of the income of the previous year - that is the financial year, beginning on 1st April and ending on 31st March -and the same is chargeable in the as-sessment year - that is the next financial year.
4 The Constitution points out three lists of legislative fields: 1) the union list (in which the central government has exclusive jurisdiction); 2) the state list (in which the state governments have exclusive jurisdiction); 3) the concurrent list (in which the union government and the state governments have concurrent jurisdiction, subject to the power of the union government).
5 In the statistics income tax payable by corporates goes under the head “corporation tax”. 6
An individual is considered a 'resident' if s/he stays for the prescribed period during a fiscal year either for 182 days or more, or 60 days or more (182 days or more for non-resident) and has been in India in aggregate for 365 days or more in the previous four years. Any person who does not satisfy these norms is considered as a
'non-In the taxable income are included the following heads: salaries; income from house property (determined by reference to the annual value of property); profits and gains of busi-ness or profession; capital gains; income from other sources (included interest7). The basis of taxation is the gross receipts after deducting the related expenses incurred in connection with earning such receipts. Such deductions, determined according to rules varying from head to head of income, are allowed from the aggregate of income and are in the nature of incentive provisions of different kinds.
The main deductions are the following:
• Standard deduction – available to certain taxpayers receiving salary or pension8;
• Entertainment allowance – provided to government employees that may claim a deduc-tion up to 20 percent of their salaries or 5,000 rupees, whichever is lower, for certain en-tertainment allowances granted by the employer;
• Tax – for any sum paid by an employee on account of state or municipal tax on employ-ment;
• Annuity and insurance payment – up to 10,000 rupees per annum for payments made in respect of an annuity contract in order to receive a pension;
• Repayment of loan – deduction of up to 40,000 rupees per annum for the repayment, in-cluding interest, of loans used to finance higher education (available for eight assessment years); deduction of up to 150,000 rupees in respect of interest on capital borrowed to purchase or construct owner-occupied residential property;
• Donation – to charities approved for tax purposes up to the limit prescribed by the tax au-thorities,
• Investment income – up to 9,000 rupees per annum in respect of interest received from certain specified investment, including dividends from cooperative societies and interest on bank deposits; up to 3,000 per annum for interest received from government securi-ties;
• Permanent physical disability – up to 40,000 rupees for a permanent physical disability (occurred in the previous year) certified by a competent person.
7 However, interest derived in the course of a business is taxed as business profits under the head “profits and gains of business or profession”.
8 From the assessment year 2001/02 the standard deduction is equal to: 33.33 per cent of salary up to 150,000 rupees or 30,000 rupees, whichever is lower; 25,000 rupees for salary ranging from 150,001 and 300,000 rupees; 20,000 rupees for salary ranging from 300,001 and 500,000 rupees; no deduction for salary over 500,000 rupees.
Other deductions are granted as tax incentives: for example, new export-oriented under-takings are entitled to an exemption from income tax; new industrial underunder-takings that fulfill certain conditions are entitled to a deduction (25 percent or 30 percent in the case of a com-pany) of the profits for a period of 10 consecutive assessment years (or 12 for a co-operative society); a deduction of 50 percent of profits is available to hotels in hilly/rural areas and pil-grimage centers (except Calcutta, Madras, Delhi and Mumbai), and so forth.
After reducing the gross total income by the amount of deductions, what is left is the total income that is the basis for taxation9. If the total income is below the basic exemption limit, no tax is chargeable. All receipts having the character of income are taxable unless they are specifically exempt from taxation.
For tax purposes spouses are treated separately and generally their income is not clubbed. On the contrary, income of all minors, except handicapped ones, is clubbed with the income of their parents, unless the income is derived from manual work or an activity involving skill, specialized knowledge and experience.
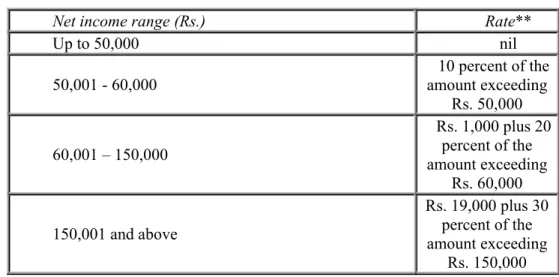
The tax rates for the assessment year 2004-2005 are listed in Table 6. Different types of assessments are provided:
a) self-assessment (the taxpayer is required to make a self- assessment and pay the tax on the basis of the returns furnished);
b) regular assessment (on the basis of the return of income chargeable to tax furnished by the taxpayer an intimation is sent to her/him informing about the tax or interest payable or re-fundable);
c) best judgment assessment (the assessing officer bases the assessment on her/his best judgment).
9 In certain cases (for example, interest, winnings from lotteries, horse races, card games and other games of any sort), income tax is deducted at source at the rates in force. For the assessment year 2004-2005 the tax rate for in-terest is 10 percent, whereas for the other above items is 30 percent, in the case of a person (other than a
com-Table 6- Tax rates, assessment year 2004-2005 (Finance Bill) a) Individual*
Net income range (Rs.) Rate**
Up to 50,000 nil 50,001 - 60,000 10 percent of the amount exceeding Rs. 50,000 60,001 – 150,000 Rs. 1,000 plus 20 percent of the amount exceeding Rs. 60,000 150,001 and above Rs. 19,000 plus 30 percent of the amount exceeding Rs. 150,000
* The tax rates applicable to individuals are also applicable to Hindu Undivided Family (HUF), Association of Persons (AOP) and Body of Individuals (BOI).
**A surcharge of 10 percent of the income tax is levied (except by non resident) where taxable income exceeds Rs. 85,000.
b) Co-operative society
Net income range (Rs.) Rate*
Up to 10,000 total income 10 percent of
10,001 - 20,000 Rs. 1,000 plus 20 percent of the amount exceeding 10,000 Above 20,000 Rs. 3,000 plus 30 percent of the amount exceeding Rs. 20,000
* A surcharge of 2.5 percent of the income tax is levied.
c) Firm and domestic company: 35 percent of the total income plus a surcharge of 2.5 percent of the income tax
d) Local authority: 30 percent of the total income plus a surcharge of 2.5 percent of the income tax
3.1.2 Wealth Tax
Wealth tax is charged under the Indian Wealth Tax Act, 1957 and the union government lev-ies it. The tax is charged on individuals, Hindu Undivided Famillev-ies (HUF) and companlev-ies in respect of the net wealth held by them during the assessment year. Indian citizens, resident companies and HUF are charged in respect of their worldwide assets, whereas non-resident is charged in respect of assets located in India.
Net wealth is the aggregate of the assets owned by the taxpayer10, less the debts owned by her/him relative to the taxable assets. From the computation of net wealth some assets are excluded (for example, the value of one house or plot of land for an individual or a HUF).
Among the assets subject to wealth tax there are, for example: buildings, or land belong-ing with them, used for residential or commercial purposes or as a guest house or farm house, within 25 km of the local limits or cantonment board; motor cars (other than those used in a business car-hire or which are stock-in-trade); jewels or precious metals (unless they are stock-in-trade); yachts, boats and aircraft (unless used for commercial purposes); urban land (with some exclusion); cash in hand in excess of Rs. 50,000.
Among the entities that are exempt from the wealth tax there are: any social club; any po-litical party; any cooperative society; any company whose object is the promotion of art, sci-ence, religion, charity, commerce, etc... The rate is 1 percent on net wealth exceeding Rs. 1.5 million. It is provided a self-assessment scheme.
3.1.3 Other taxes on capital and property
Other taxes on capital and property are levied by the states and the local authorities.
The states impose: - a land tax on the value of land (the methods of valuation and the rates vary from states to states); - a tax on motor vehicles, whose yield is used for the devel-opment and the maintenance of state roads.
The local authorities impose: - land cesses in the form of a surcharge on land revenue; - a tax on land and buildings, generally based on the annual rental value; - betterment taxes,
based on increases of land value caused by town planning and town improvement; - taxes on the transfer of immovable property, based on the value of the property and in addition to state stamp duty.
3.1.4 Expenditure Tax
The expenditure tax is charged under the Indian Expenditure-tax Act, 198711 and it is imposed by the union government. The tax is charged at the rate of 10 percent on any chargeable ex-penditure incurred in a hotel wherein the room charges12 for any unit of residential accommo-dation are three thousand rupees or more per day. The expenditure tax is collected by the per-son who carries on the business of such hotel. The tax collected during any calendar month is paid to the credit of the union government by the 10th of the month immediately following the said calendar month. Any person responsible for collecting the expenditure tax who fails to collect it shall pay, in addition to paying the tax, a sum equal to the amount of tax that s/he failed to collect.
From the 1st October, 1991 to the 31st May, 1992 a tax at the rate of 15 percent of the chargeable expenditure incurred in a restaurant was levied.
3.2 Indirect Taxes 3.2.1 Customs Duties
The Constitution has given to the union the right to legislate and collect duties on goods im-ported into or exim-ported from India. The Customs Act, 1962 is the basic Statute, effective from 1st February 1963. The categories of items and the rates of duties which are leviable have been specified in two schedules to the Customs Tariff Act, 1975. The first schedule specifies the various categories of import items, in accordance with an international scheme of
11 The Act extends to the whole of India except the State of Jammu and Kashmir.
12 In the case where a composite charge is payable in respect of residential accommodation and food, the room charges included therein shall be determined by deducting from the composite charge, the charges for food in the following manner: (i) where the composite charge includes the charge for breakfast: 10 per cent of the compos-ite charge; (ii) where the composcompos-ite charge includes the charge for breakfast and one meal: 25 per cent of the composite charge; (iii) where the composite charge includes the charge for breakfast and two meals: 40 per cent of the composite charge. As of 1st June 2002 the definition of “chargeable expenditure” excludes payments made to the hotel in respect of food, drinks or any other services.
cation of internationally traded goods (Harmonized System of Nomenclature (HSN), estab-lished by the World Customs Organization). All goods are classified into categories, called "headings" and "subheadings"; for each sub-heading, a specific rate of duty is prescribed. The duties are levied both on specific and ad-valorem basis, while there are few cases where at times specific-cum-ad valorem duties are also collected on imported items. Where ad-valorem duties are collected, the value of the goods has to be determined for customs duty purposes according to WTO Valuation Agreement.
Under the Custom Tariff Act, 1975 and other laws, there are the following types of du-ties that are leviable:
• Basic Customs Duty - that is duty specified against each heading or sub-heading in the first schedule. There are different rates of duty for different commodities and there are preferential rates for goods imported from certain countries in accordance with bilateral agreements with such countries. The duty may be ad valorem or specific.
• Surcharge - that is levied at the rate of 10% of the Basic Customs Duty on imported goods, unless exempted by a notification.
• Additional duty of customs - equivalent to the excise duty leviable on goods produced or manufactured in India. Generally it is on ad valorem basis, though specific rates are pre-scribed for some items. For imported goods to be used as inputs for manufacture of other goods, it is generally eligible for a credit (called CENVAT credit) equal to the additional duty of customs paid on the imported goods. This credit can be used for paying central excise duties.
• Special additional duty – whose amount is computed by applying the specified rate13 on the total of the assessable value, the basic customs duty and the additional duty of cus-toms described above.
There are also additional levies on particular items and other levies which are specific to the country of origin. Among the later there are anti-dumping duty, on specified goods im-ported from specified countries to protect indigenous industry, and safeguard duty, applicable on certain goods for specified periods in order to check their excessive imports which may damage the Indian industry. The rates vary and are based on official notification.
The custom duty on exports is levied on items listed in the second schedule to Customs Tariff Act, 1975. Currently, the rates vary from 10 to 60 percent and they are either ad valorem, specific or a combination of both. Very few items are subject to customs duties on their export.
In order to make the exports more competitive, it is provided a duty exemption scheme for registered exporters so that they may import the inputs required for export production at inter-national prices and free from duty. Imported items that are exempt from customs duty are raw materials, components and consumables.
3.2.2 Central Excise Duties
Central excise duties are charged under the Central Excise Act, 1944 at the rates specified in the schedules to the Central Excise Tariff Act, 1985. They are an indirect tax levied on goods produced or manufactured in India, excluding those produced or manufactured in special eco-nomic zones.
There are several types of duties which become payable at the time of clearance of such goods. These duties are:
• Basic excise duty (specified against each sub-heading in the First Schedule to the Cen-tral Excise Tariff Act, 1985) actually called the "CenCen-tral Value Added Tax (CEN-VAT)14.
• Special excise duty (leviable only on a few items, in addition to CENVAT, at the rate specified under the Second Schedule to the Central Excise Tariff Act, 1985).
• Additional duties of excise (leviable on various commodities, as specified textiles and textile articles, or on sugar, tobacco products in lieu of sales tax).
• Cess (on different items - for example, spices, agriculture and processed food prod-ucts, coffee, marine products which are exported - through special enactment).
The duty is payable by the manufacturer at the time of removal of goods from the factory premises or warehouse; the taxable base is the wholesale price of the goods manufactured. However, to achieve particular objectives - for example, to promote exports, to avoid multiple taxation, to promote educational and research activities, or to encourage the use of specified
14 The duty paid on specified inputs and capital goods used in relation to the manufacture of specified final products can be claimed, under specific conditions, as a credit (CENVAT credit).
raw material - it is in the power of the central government to exempt certain excisable goods from the whole or any part of the duty leviable on such goods.
The general rate of the basic excise duty in 2002/2003 is 16 percent, but there are a num-ber of items that are subject to either a “nil” or ad valorem rate. In the same fiscal year the special excise duty is levied at a rate of 16 percent, although there are a number of items sub-ject to a rate of 8 percent; additional duties of excise are imposed at rates ranging from 5 per-cent to 18 perper-cent, or at ad valorem rates. Cess is applied at varying rates (for example, 0.5 percent on spices and agriculture and processed food products, Rs. 25.00 per quintal on cof-fee).
Unless the assessee is a cigarette manufacturer (in which case the assessment is carried out by the authorities), a self-assessment procedure is provided.
3.2.3 Service Tax
Service tax was introduced in India for the first time in 1994. It extends to whole of India ex-cept the state of Jammu and Kashmir. It is levied, collected and appropriated by the union government. Service tax is levied on specified taxable services and the responsibility of pay-ment of the tax is cast on the service provider. The Finance Act 2001 introduced self-assessment for service tax returns, which are expected to be filled half yearly and by the 25th of the month following the half-year15. This is in replacement of the monthly/quarterly returns prescribed earlier.
Initially the service tax was imposed on the following services: telephone, stockbroker, general insurance. Over the years it was extended to other services, as advertising agencies and courier agencies. At present the total number of services on which service tax is levied has gone up to 58, despite withdrawal of certain services from the tax net or grant of exemp-tions. In the budget 2003-04 more services16 have been added to the tax net and the levy of service tax on these services is effective from July 1st, 2003.
15The individual assessees are required to pay the levy only once in a quarter.
16 The services are the following: a) commercial vocational institute, coaching centres and private tutorials; b) technical testing and analysis (excluding health and diagnostic testing) technical inspection and certification ser-vice; c) maintenance and repair services; d) commission and installation services; e) business auxiliary services, namely business promotion and support services (excluding on information technology services); f) internet café; g) franchise services; h) foreign exchange broking services; i) maxi cab repair services; l) minor ports (other than
Service tax is levied on the gross or aggregate amount charged by the service provider on the receiver; only in particular cases the tax is permitted to be paid on the value received. Since the 14th May 2003 it is collected at a rate of 8 percent, while the previous rate was 5 percent.
To reduce the cascading impact of tax on tax and to help restoring competitiveness of service sector, a credit of the service tax paid on the input-service is allowed since 2002. At present the assessee can avail of input credit in respect of any of the categories of the services and utilize the said service tax credit for payment of service tax on any of the out-put services.
3.2.4 Sales Tax
Sales tax is charged under the Central Sales Tax Act, 1956. It is levied on the sale or purchase of goods. There are two kinds of sales tax: 1) central sales tax (CST), imposed by the union government; 2) sales tax, imposed by each state.
Central sales tax is generally payable on the sale of all goods by a dealer in the course of inter-state trade and commerce and it is levied in the state where the movement of goods commences. Although the tax is imposed by the central government, the revenue is adminis-tered by the state in which it is levied.
The taxable base is determined by applying the appropriate rate, depending on the type of transaction, to the dealer’s turnover17.
Sales tax on intra-state sale or purchase of goods (other than newspapers) may only be imposed by the state in which the sale or purchase takes place. Nearly all the states impose sales taxes at rates that range from 4 to 15 percent.
4. Some critical issues of the Indian tax system
4.1 The large prevalence of a complex system of indirect taxes
17 The turnover is defined as the aggregate of the sale prices received by a dealer net of sale tax less the sale price of goods returned within six months of the date of delivery.
We have already noticed that the Indian tax system is still largely made up of a big, complex and entangled bundle of excises and sales taxes. The room of direct taxation, both on indi-viduals and companies, is very smaller. Formal rates are not particularly low, especially for corporations (see par. 3 above) but the wideness of the bases is just so. Such a system -we have already reminded- is not just a consequence of free tax policy choices, but mainly draws its model from the severe constraints - economic, social and administrative in nature -, which limit the room of manoeuvre to build the tax system of developing countries (Musgrave 1969; Burgess and Stern 1993; Tanzi 1994). The large prevalence of a complex system of indirect taxes however raises a number of critical issues that require some discussion.
i. The limited share of direct taxes on individuals – The per capita income is not the only explaining factor of the total fiscal pressure18, as well as of the level of a particular tax. Anyway, it is a key factor and a starting point to compare different countries’ tax levels, not to be disregarded. Put the issue in that way, the current level of personal income tax in India stays about one third below the figure computed by the prevailing literature (e.g. Burgess and Stern 1994)19 with reference to the bracket that encompasses the Indian per capita income. Why not a bigger amount of PIT? Why just 32 million of taxpayers file income’s tax return, over a population of more than 1 billion and sixty five million people?20
A first argument to limit the room of income tax could be the need to preserve poverty incomes from taxation. Otherwise avoiding any taxation of the poor’ consumption is virtually impossible. It is also commonly recognized that consumption taxes tend to be regressive, es-pecially in developing countries, if they are not coupled with commanding and administra-tively costly measures of prices’ subsides, in kind rations and transfers. Furthermore the rates should be scheduled according to a steeply -revenue reducing- increasing tax rates’ profile (e.g. Burgess and Stern 1994). Might well be that a proper behaved structure of larger income taxation could cooperate to do a better redistributive job. Of course also agriculture incomes should be taxed at a non-negligible level, but without burdening poor peasant households. Land tax may be a good solution in terms of both efficiency and equity (Burgess and Stern 1994).
18 Tanzi’s (1994) equation adds the weight of agriculture sector (-), the ratio of imports (+) to GDP, the level of public debt (+). Musgrave (1969) and Burgess and Stern (1993) furthermore add qualitative factors of the same kind. Remind from the previous sections that agriculture’ share is declining since some decades relatively to other economy’s sectors, while Debt/GDP ratio stays high in India.
fig-It also is often assumed that the costs of administration and compliance are higher for direct than for indirect taxes, especially inside the informal setting of developing countries’ economies. Here the true difficulty is more specific but common to the two kinds of taxation: the need to improve the capabilities of both the tax administration and of the taxpayers. In this connection, it has been demonstrated that simple reforms of personnel policy inside the Indian income tax administration can imply significant enforcement and compliance gains (Das-Gupta, Gosh and Mookherejee 2004) so that to reduce the cost of collection per unit of yield. Furthermore, when one looks at the complexity system of the Indian indirect taxes, the un-avoidable suspicion arises of not having to cope with an inexpensive system of tax collection. Finally, according to standard economic theory, consumption taxes would be more sav-ing preservsav-ing and income taxes could induce supply disincentives, especially as steeper is their rates’ schedule. Notice however that these arguments mainly apply to countries where the per capita income is already higher than it is today in India. On the contrary, we may infer that the taxation has little to do with the savings in a still so poor country and with the labor supply in a country where the employed workers are not more than 24 percent of the total population.21
ii) Broadening companies’ tax base – The native literature unambiguously recognizes (e.g. Kwatra 1997) that the corporate backward effective rates are far lower than the legal ones. This is mainly due to tax holidays for new small undertakings and venture capitals, to incentives to exports, to a lot of allowances for FDI, to deductions for particular sectors (e.g. power plants, infrastructures, industrial research). This happens when it is well recognized by a general authoritative opinion (rooted especially inside the international organizations -OECD/WB/IMF-) that playing the field and reducing the standard rate is more incentives in-ducing than the sector allowances, in transition and developing economies too (e.g. Owens 2004).
iii) Rationalizing indirect taxes – We have already noticed that the present large system of indirect taxes is quite complicated and confused. A state sales tax is added to the national excise duties. The national excises hit goods at the production stage, while the services are subject to a different separate tax. Furthermore, the national excises are organized in a multi-classes structure (basic, special, additional excises and cess), according to various types of goods. In its turn, the sales tax (anyway payable to the state) is set by the central government
for the inter-states trade and by the states themselves for the intra-states trade. This system unavoidably raises cascading effects (although partially mitigated by widespread deductions of the taxes paid on inputs and capital goods in the case of the national excises and services taxes) and may result in random ‘all in’ rates charged on final goods and services. Many re-cent government’s reports (e.g. Government of India 2002) underline the need to deeply ra-tionalize the structure of the indirect taxation and to improve the tax administration and the tax-payers compliance, also to reduce the costs of collection. Since some years the long-term strategy is in the direction of a double Vat system (at the central level on manufactured goods and at the state level on retail sales). Just some excise duties on particular goods (tobacco, al-coholic beverages, energy) should survive. Unambiguously the literature favors this move (e.g.: Shome 1997; Rao 2000) whose current steps are reported below. Anyway, the setting of rates will not be easy: the unavoidable trade-off between equity and efficiency (and yield) clearly emerged in a seminal paper devoted just to India (Ahmad and Stern 1984). Finally a deep reform of what accounts for about 60 percent of total taxation will not be easy neither without risk of an, at least temporary, revenue’s losses. All this would make unsustainable the Indian budget position, already suffering a high level deficit (see section 5 below).
4.2 Intergovernmental fiscal relations
As already noted, India is a federal republic22 and its government consists of a central (union) government, 28 state governments and 7 union territories. Many states have autonomous re-gions with regional councils and in different states there are three tiers of local bodies23. There also are 602 districts administered by their respective state/UT government. The Indian federal system is quite centralized. Indian Constitution makers divided the government
21 U.N. data for the late 1990s: 33 percent of active population and 9 percent of total unemployment.
22 India has a federal structure with unitary features. The two essential features of Indian federalism are: a) In-dian federalism is not the result of an agreement by the units; b) the component units have no freedom to secede. For a brief description of the evolution of financial relations from 1858 up to the coming into force of the Consti-tution in 1950 see Vithal and Sastry, 2001.
23 There are two types of local government: urban local government and rural local government. Until 1992, mu-nicipal corporations, mumu-nicipal councils, town area committees and notified area committees formed urban local government. However, the Seventy-Fourth Constitution Amendment Act adopted in 1992 proposes to form a uniform structure of municipal corporations, municipal councils and Nagar Panchayats in transitional areas. Ru-ral local government operates through Zilla Panchayats (Parishads), Taluka Panchayats and Village Pancha-yats. That amendment granted local self-governments a constitutional status and safeguarded their continued ex-istence. Local government bodies are covered in the state list and are governed by the state statutes or, in the case of union territories, by the union parliament. (http://www.unescap.org).
functions in three lists: federal, state and concurrent. Under the Seventh Schedule of the In-dian Constitution, the central government has exclusive powers on foreign policy, defence, communications, currency, taxation on corporations and non-agricultural income, and rail-roads; while state governments have the exclusive power to legislate on such subjects as law and order, public health and sanitation, local government, betting and gambling, and taxation on agricultural income, entertainment, and alcoholic beverages. On some issues both the cen-tral government and state governments may legislate, though a union law generally takes precedence. Among these areas are criminal law, marriage and divorce, contracts, economic and social planning, population control and family planning, trade unions, social security, and education. All residuary issues lie within the exclusive domain of the central government. An exceedingly important power of the central government is that of creating new states, combin-ing states, changcombin-ing state boundaries, and terminatcombin-ing a state's existence. The central govern-ment may also create and dissolve any of the union territories, which have more limited pow-ers than those of the states. Although the states exercise either exclusive or joint control over a substantial range of issues, the Constitution establishes a more dominant role for the union government.
The assignment of tax powers is based on the principle of separation; most broad based taxes are assigned to the centre, whereas in practice the states have a narrower tax base and the consequence is a vertical fiscal imbalance. In 2002-03 the states on average raised about 38 percent of central revenues, but incurred about 58 percent of expenditures. The capacity of the states to finance their current expenditures from their own sources of revenues has de-clined from 69 percent in 1955-56 to 52 percent in 2002-03. Transfers from the centre made up the balance (Singh 2004, p. 7-8).
The inadequacy of the states to meet expenditures from their own resources is recog-nized by the Constitution of India at Articles 275 and 282. Grants-in-aid under Article 275 are need-based, on the recommendations of the Finance Commission, while grants under Article 282 are purpose-based, in the sense that the central government has the power to make discre-tionary grants to the states. The Finance Commission is appointed by the President of India every five years or earlier if needed24 and it is the mechanism provided by the Constitution to regulate the flow of transfers from the central government to the states and their allocation among different states.
Generally, the Finance Commission makes recommendations on the following matters: a) the distribution between the union and the states of the net proceeds of taxes which are to be divided between them under Chapter I Part XII of the Constitution25 and the alloca-tion among the states of the respective shares of such proceeds26;
b) the principles which should govern the grants-in-aid of the revenues of the states out of the consolidated Fund of India27 and the sums to be paid to the states which are in need of assistance by way of grants-in-aid of their revenues under article 275 of the Constitution28;
c) the measures needed to augment the consolidated Fund of a state to supplement the resources of the panchayats and municipalities in the state on the basis of the recommenda-tions made by the Finance Commission of the state29.
Moreover, the Commission reviews the financial situation of the union and the states and suggests a plan by which the governments, collectively and severally, may bring about a restructuring of the public finances restoring budgetary balance, achieving macro-economic stability and debt reduction along with equitable growth.
Over the last fifty years the Finance Commissions have elaborated a sophisticated meth-odology to deal with horizontal and vertical fiscal imbalances. To distribute horizontally the two major taxes that are shared between the centre and the states the Finance Commissions
24 The last Finance Commission appointed is the twelfth and its report must cover a period of five years com-mencing on the 1st April 2005.
25 Before the Eightieth Amendment Act, 2000, the Constitution provided for sharing of two taxes, income tax and union excise duties, with the states. The relevant ratios determining the vertical allocation in tax devolution have remained for many years at 85 percent in the case of income tax and at 45 percent for union excise duties. The Tenth Finance Commission proposed a system of vertical resource sharing in which central taxes are pooled and a proportion of 29 percent of gross proceeds devolved to the states (26 percent to all states and three percent to those where sales tax on sugar, textiles and tobacco was not levied). That recommendation brought forth an amendment to the Constitution (Eightieth Amendment Act 2000). The Eleventh Finance Commission recom-mended the devolution of 29.5 percent (28 percent to all states and 1.5 percent to those which did not levy sales tax on sugar, textile and tobacco) of net proceeds of all shareable taxes. (Government of India 2000). About 20 per cent of the revenue collected by the union is transferred under tax sharing mechanism (Chaubey 2003). 26 For example, the Eighth and Ninth Commissions determined the respective shares of states in the devolution of income tax and union excise duties on the basis of three allocative criteria: a) population; b) distance (meas-ured by the term (yn - yi) where yn is the highest per capita income among all the states); c) inverse of income. 27 The consolidate Fund of India is a part of the government accounts in which are credited all revenues received by government by way of taxation and other receipts flowing to government in connection with the conduct of government business, like receipts from railways, posts, transport etc. (non-tax revenues). Similarly, all loans raised by government by issue of public notifications, internal and external debt and all moneys received by gov-ernment in repayment of loans and interest thereon is also credited into this fund. All expenditure incurred by the government for the conduct of its business including repayment of internal and external debt and release of loans to states/union territory governments for various purposes is debited against this fund.
28 For example, the Eleventh Finance Commission suggested giving grants-in-aid to the states equal to the amount of the deficits as estimated for each of the years during 1995-96 to 1999-2000. Under this head only 3-4 percent of the total revenue receipts of the union are transferred (Chaubey 2003).
used a large number of criteria, among which: population, tax effort, collection assessment, in-come distance, inin-come adjusted total population, indices of social and economic backwardness, territorial area, post-devolution deficits, poverty, revenue equalization, etc. (Singh 2003). The Eleventh Finance Commission set a new benchmark in the centstate fiscal relations: it re-duced weight of population from 20-30 percent in the recent past to 10 percent, maintained weight of income distance criterion at 62.5 percent and chose to allocate 27.5 percent of states’ share of pooled proceeds according to area, infrastructure, tax effort and fiscal discipline (Chaubey 2003).
The central government also distributes substantial grants to the states through its devel-opment plans as elaborated by the Planning Commission30. While the Finance Commission de-cides on tax shares and makes grants-in-aid, the Planning Commission makes grants and loans to implement development plans. It is worth to notice the problem of coordination between the two independent commissions that arises. The loan-grant composition of the assistance given to special category states is 10:90 while that to other states is 70:30. Before 1969, plan trans-fers were project-based; since then, the distribution has been done on the basis of a formula that takes into account population, per capita income, fiscal performance (tax effort, fiscal management, national objectives) and special problems (Singh, 2004). Plan revenue grants make about 7-8 percent of the total revenue receipts of the union (Chaubey 2003).
5.
Tax reforms
5.1 A quick glance at macro economic and budget outlook31
Over the last two decades the Indian economy made significant improvements at an annual average growth rate rising from 2.9 percent in the 1970s to 5.8 percent in the 1990s. Notwith-standing this improvement, the per capita income remains very low in comparison with other East Asian countries, particularly China, which had the same level of per capita income as
29 For a brief description of the main recommendations with respect to local government see, for example, Rao and Sing, 2004.
30 The Planning Commission was not conceived in the Constitution but through a resolution of the cabinet, after 50 days of promulgation of the Constitution.
31 The contents of this section are mainly based on Government of India, Union Budget, various years. and Eco-nomic Survey, various years.
dia in the 1970s32. The progress in growth was accompanied by structural changes quite dif-ferent from those experienced in other developing countries, where a decline in the share of agriculture in GDP was coupled by a remarkable expansion of industry. In India between the 1970s and 2003-04, the share of agriculture and allied sectors in GDP declined from an aver-age of 42.8 percent to 22.1 percent, while that of services rose from an averaver-age of 34.5 per-cent to 51.0 perper-cent. The share of industry showed a little increase from an average of 22.8 percent to 26.9 percent. In 2002-03 the GDP growth decelerated from 5.8 percent of the pre-vious year to 4.0 percent, mainly because of a heavy decline of 5.2 percent in the agriculture and allied sectors, due to a severe drought (the industrial sector growth was 6.4 percent, whereas the services sector growth was 7.1 percent). In 2003-04 real GDP at factor cost has been estimated to have grown by 8.2 percent, sustained by a growth of 9.1 percent in agricul-ture and allied sectors (aided by an abundant monsoon), 6.7 percent in industry sector and 8.7 percent in the services sector. The growth recovery in 2003-04 was accompanied by a relative stability of prices; inflation, as measured by the wholesale price index (WPI), was 5.5 percent on average, while retail price inflation, as measured by the consumer price index for industrial workers (CPI-IW), declined from 5.1 percent in April 2003 to 2.2 percent in April 2004. Higher growth rates are needed for the rapid elimination of poverty, in spite of the fact that there already was a significant decline in the poverty ratio from 36 percent in 1993-94 to 25 percent in 2001-02. In recent years domestic demand was the main driver of growth; during the period 1998-99 to 2002-03, on average, the contributions of private final consumption ex-penditure and investment to growth of GDP at current market prices were 64.2 percent and 21.0 percent respectively.
Since 2001-02 the current account of India’s balance of payments recorded a surplus, indicating that the rest of the world has contributed to support aggregate demand; moreover, a strong balance of payments position in recent years resulted in a steady accumulation of for-eign exchange reserves.
Public finances, which have been under pressure since 1997-98 on account of the pay revision of government employees and the economic slowdown, showed a further deteriora-tion. The fiscal deficit of the central government, in GDP terms, after declining from 6.6 per-cent in 1990-91 to 4.1 perper-cent in 1996-97, started rising to 5.3 perper-cent in 2002-03. The dete-rioration in revenue deficit was sharper: in 1990-91 it reached 3.3 percent of GDP, then