MPRA
Munich Personal RePEc Archive
Who needs credit and who gets credit?
Evidence from the Surveys of Small
Business Finances
Rebel A. Cole
1. May 2008
Online at
http://mpra.ub.uni-muenchen.de/24691/
Who Needs Credit and Who Gets Credit?
Evidence from the
Surveys of Small Business Finances
Rebel A. Cole
DePaul University
Chicago, IL 60604
rcole@depaul.edu
Abstract:
In this study, we use data from the Federal Reserve’s 1993, 1998 and 2003 Surveys of Small Business Finances to classify small businesses into four groups based upon their credit needs and to model the credit allocation process into a sequence of three steps. First, do firms need credit? We classify those that do not as “non-borrowers;” these firms have received scant attention in the literature even though they account for more than half of all small firms. Second, do firms need credit but fail to apply because they feared being turned down? We classify such firms as “discouraged borrowers.” Like non-borrowers, discouraged borrowers have received little attention in the literature and often are pooled with firms who applied for, but were denied, credit. Discouraged borrowers outnumber firms that applied for, but were denied, credit by more than two to one. Third, do firms apply for credit, but get turned down? We classify such firms as “denied borrowers.” Finally, we classify firms that applied for, and were extended, credit as “approved borrowers.” Our results reveal strong and significant differences among each of these four groups of firms. Non-borrowers look very much like approved borrowers, consistent with the Pecking-Order Theory of capital structure. Discouraged borrowers resemble denied
borrowers in many respects, but are significantly different along a number of dimensions. This finding calls into question the results from previous studies that have pooled together these two groups of firms in analyzing credit allocation. Finally, we find strong evidence that denied borrowers differ from approved borrowers across numerous characteristics, as previously documented in the literature. Of particular note, minority owned-firms, and especially Black-owned firms, were denied credit at a far higher rate than firms with owners who were white.
Key words: availability of credit, capital structure, discrimination, entrepreneurship, small
business, SSBF
JEL classification: G21, G32, J71, L11, M13
Who Needs Credit and Who Gets Credit? Evidence from the Surveys of Small Business Finances 1. Introduction
Among small businesses, who needs credit and who gets credit? The answer to this question is of great importance not only to the firms themselves, but also to prospective lenders to these firms and to policymakers interested in the financial health of these firms. The
availability of credit is one of the most fundamental issues facing a small business and, therefore, has received much attention in the academic literature (see, e.g., Petersen and Rajan, 1994; Berger and Udell, 1995; Cole, 1998).
However, many small firms indicate that they do not need credit (“non-borrowers”) while others indicate that they need credit but did not apply for credit—so-called “discouraged
borrowers.” Non-borrowers essentially have been ignored by the existing literature; we know of no studies that have analyzed these firms separately from firms that need credit. Discouraged borrowers have received scant attention in the literature, and the studies that have analyzed them often combine them into potentially inappropriate groups. For example, “discouraged borrowers” are combined with “denied borrowers”—firms that actually applied for credit and were turned down. Yet many “discouraged borrowers” more closely resemble “approved borrowers”—firms that applied for and received credit—than “denied borrowers.”
In this study, we analyze these four groups of firms to shed new light upon how they differ. We utilize data from the Federal Reserve Board’s 1993, 1998 and 2003 Surveys of Small Business Finances (SSBFs) to estimate a sequential set of three logistic regression models, where a firm first decides if it need credit (non-borrowers versus all other firms), then decide if it will apply for credit (discouraged borrowers versus denied borrowers and accepted borrowers), and, finally, learns from its prospective lender whether or not it is extended or denied credit (approved
borrowers versus denied borrowers). As the first rigorous evidence on the differences in these four groups of firms, results of this study provide policymakers with new insights on how to tailor macroeconomic policy and regulations to help small businesses obtain credit when they need credit.
Why is this issue of importance? According to the U.S. Department of Treasury and Internal Revenue Service, there are more than 23 million U.S. sole proprietorships, more than 2 million partnerships with less than $1 million in assets and more than 5 million corporations with less than $1 million in assets.”1 Small firms are vital to the U.S. economy. According to the U.S. Small Business Administration, they account for half of all U.S. private-sector employment and produced more than 60% of net job growth in the U.S. between 1993 and 2008.2 Therefore, a better understanding of who needs credit and who gets credit can help policymakers to take actions that will lead to more jobs and faster economic growth.
We contribute to the literature in at least four important ways. First, we provide the first rigorous analysis of the differences in our four types of firms: non-borrowers, discouraged borrowers, denied borrowers and approved borrowers. We find that non-borrowers look very much like approved borrowers and in ways that are consistent with the pecking-order theory of capital structure.3 This is the first rigorous evidence on how this group of firms compares to the groups of firms that need credit. We also find that discouraged borrowers are significantly different from denied borrowers on a number of dimensions—a result that calls into question the
1 See U.S. Internal Revenue Service statistics at http://www.irs.gov/taxstats.
2See, “Frequently Asked Questions,” Office of Advocacy, U.S. Small Business Administration
(2009). For research purposes, the SBA and Federal Reserve Board define small businesses as independent firms with fewer than 500 employees. We follow that definition in this research. 3 Cole (2008) provides strong evidence that privately held U.S. firms follow the pecking-order theory of capital structure.
results of research that have combined these groups in ways that our results suggest are inappropriate, such as pooling discouraged borrowers with denied borrowers in analyzing availability of credit.
Second, we provide an analysis of credit availability that properly accounts for the inherent self-selection mechanisms involved in the credit application process: who needs credit, who applies for credit conditional upon needing credit, and who receives credit, conditional upon applying for credit. Many previous researchers have ignored firms that do not apply for credit; have pooled firms that do not need credit with those needing credit; and/or have pooled
discouraged borrowers with denied borrowers. Hence, our results shed new light upon the credit-allocation process.
Third, we provide evidence from the 2003 SSBF on the availability of credit to small businesses. This survey includes methodological improvements on the previous SSBFs (1987, 1993 and 1998) that enable us to better address the issue of availability of credit to small firms. One of the most important is the identification of applications to renew existing lines of credit, which enables us, for the first time, to differentiate the availability of new credit from renewals of existing credit. This turns out to be very important because renewals of existing lines of credit account for about 40 percent of all applications, but only about 10 percent of all denials; in other words, new applications are turned down at four times the rate of renewals. Our results indicate that inclusion of these renewals does not qualitatively affect our results, providing support for previous works using the 1993 SSBF, which did not allow researchers to disentangle this effect, and the 1998 SSBF, which excluded renewals altogether.
Fourth, we provide the first comprehensive evidence from the three SSBFs on the availability of credit to minority-owned firms. Previous researchers have analyzed data from the
1993 and 1998 SSBFs separately, and there are no studies of which we are aware that analyze the 2003 SSBF, for evidence on how minority-owned firms fare relative to white-owned firms in their applications for credit, nor are we aware of any studies that analyze each of the three SSBFs for which loan approval data are available for commonalities across time and credit regimes. We provide strong evidence across each of the three SSBFs that minority-owned firms are denied credit at significantly higher rates than non-minority firms, even after controlling for the wide array of control variables available from the SSBFs.4
In section 2, we briefly review the literature on the availability of credit, followed by a description of our date in section 3 and our methodology in section 4. Our results appear in section 5 and we provide a summary and conclusions in section 6.
2. Literature Review
The issue of availability of credit to small businesses has been studied by financial economists for at least sixty years, dating back at least to Wendt (1946), who examines availability of loans to small businesses in California. Since then, scores of articles have addressed this issue. We will limit our review of the literature to the most prominent studies using SSBF data that have appeared in the financial economics literature during the past two decades.
A large body of research has developed around the seminal work of Petersen and Rajan (1994) who were the first to analyze credit availability using data from the Survey of Small Business Finance. This body has focused on the importance of firm-lender relationships in the
4 Of course, there remain numerous potentially important explanatory variables, such as those related to culture and family endowments, which prevent us from interpreting our results as definitive evidence of discrimination against minority-owned firms.
allocation of credit. Because of the relative opacity of small firms, those firms with stronger relationships with their prospective lenders are more likely to receive credit. Petersen and Rajan (1994) use data from the 1987 SSBF to find that close ties with creditors lead to greater
availability of credit at lower rates of interest.
Berger and Udell (1995) were the first to extend Petersen and Rajan, also using data from the 1987 SSBF. These authors focused their analysis only on lines of credit—a type of lending where relationships should be especially important. They find that loan rates are lower when firms have longer pre-existing relationships.
Cole (1998) was the first to analyze data from the 1993 SSBF. He focuses on the lender’s decision whether or not to extend credit, rather than on the rate charged by the lender, and finds that it is the existence, rather than the length, of the firm-lender relationship that affects the likelihood a lender will extend credit.
Several studies have used SSBF data to analyze how race and gender influence the availability of credit. Cavalluzo and Cavalluzo (1998) use data from the 1987 SSBF to find little variation in credit availability by gender but significant differences by race. Cavalluzzo,
Cavalluzzo and Wolken (2002) use data from the 1993 SSBF to find significant differences in availability of credit by race. Blanchflower et al. (2004) use data from the 1993 and also find
significant differences by race. Also using data from the 1993 SSBF, Coleman (2003) finds that black small businesses were less likely to even apply for a loan because they expected to be turned down, i.e., that they were more likely to be a discouraged borrower as well as more likely to be a denied borrower. Most recently, Cavalluzo and Wolken (2005) use data from the 1998 SSBF, which provides information on personal wealth, an important omitted variable in earlier analysis, yet also find significant differences in credit availability by race.
Chakraborty and Hu (2006) use data from the 1993 SSBF to analyze how relationships affect lender’s decision to secure lines of credit and other types of loans. They find that the length of relationship decreases the likelihood of collateral for a line of credit but not for other types of loans. Previously, Berger and Udell (1995) had shown that longer relationships reduced the likelihood of collateral being required for lines of credit, using data from the 1987 SSBF.
3. Data
To conduct this study, we use data from the Federal Reserve Board’s 1993, 1998 and 2003 Surveys of Small Business Finance (“SSBF”).5 In each survey, the firms surveyed constitute a nationally representative sample of small businesses operating in the U.S. as the survey year and at the time of the interviews, which took place during the following year, where a small business is defined as a non-financial, non-farm enterprise employing fewer than 500 employees. The survey data for each year are broadly representative of approximately five million firms operating in the U.S. as of the survey year.
The SSBF provides detailed information about each firm's most recent borrowing
experience. This includes whether or not the firm applied for credit and, if the firm did not apply, did it fail to apply because it feared its application would be rejected (discouraged borrowers). For firms that applied, the SSBF provides information on the identity and characteristics of the potential lender to which the firm applied, other financial services (if any) that the firm obtained from that potential lender, and whether the potential lender approved or denied the firm’s credit
5 We do not analyze data from the 1987 SSBF because it does not provide information on non-borrowers, discourage borrowers or denied borrowers. See Elliehausen and Wolken (1990) for a detailed description of the 1987 survey, Cole and Wolken (1995) for a detailed description of the 1993 survey, Bitler, Robb and Wolken (2001) for a detailed description of the 1998 survey, and Mach and Wolken (2006) for a detailed description of the 2003 survey.
application. The survey data also provide information on each firm’s balance sheet and income statement; its credit history; the firm's characteristics, including standard industrial classification (SIC), organizational form, and age; and demographic characteristics of each firm's primary owner, including age, education, experience, and credit history. Balance-sheet and income-statement data are derived from the enterprise's year-end financial income-statements. Credit history, firm characteristics, and demographic characteristics of each firm's primary owner are taken as of year-end.
We impose a number of restrictions on the SSBFs. First, we exclude the very small number of firms reporting that they were publicly traded in order to focus exclusively on
privately held firms. Second, we exclude firms reporting assets or sales greater than $10 million (some as large as $200 million) because we wish to focus on truly “small” firms; we choose the $10 million threshold because this is the typical cut-off used by bankers to differentiate “small” businesses from “middle-market” businesses. 6 Third, we exclude firms reporting that no owner controlled at least ten percent of the firm’s shares because, for these firms, the SSBF does not collect information on the primary owner, such as age, education and personal wealth. Fourth, we exclude firms reporting that another business is the primary owner of the firm because, again, the SSBF does not collect information about the primary owner of such firms. Finally, we
exclude firms reporting zero assets, as we need a positive value of assets to scale our financial variables. These restrictions leave us with our final samples for 1993/1998/2003.
6 Results obtained when these larger firms are included in the analysis are not qualitatively different from those obtained under this sample restriction.
4. Methodology and Hypotheses
4.1 Methodology
In order to provide new evidence on who needs credit and who gets credit among small businesses, we employ both univariate and multivariate tests. In all of our tests, we use the survey sampling weights because the SSBFs are not simple random samples; rather, they are stratified random samples, where large and minority-owned firms are over-represented relative to smaller and white-owned firms. Failure to account for this non-random sampling would impair our ability to make inferences from our analysis of sample firms to the target population of U.S. small businesses.
First, we classify firms into one of four categories of Borrower Type based upon their
responses to questions regarding their most recent loan request during the previous three years.7
Non-Borrower: the firm did not apply for a loan during the previous three years because
the firm did not need credit.8
Discouraged Borrower: the firm did not apply for a loan during the previous year
because the firm feared rejection, even though it needed credit.
Denied Borrower: the firm did apply for a loan during the previous three years but
was denied credit by its prospective lender(s).
7 Each firm is asked about its most recent applications (approved and/or denied) during the previous three years, excluding applications for credit cards, loans from owners and trade credit with suppliers, as well as applications that were withdrawn or were pending at the time of the interview. Applications for renewals of credit lines were included. We test the impact of their inclusion in Table 5.
8 Note that most of these firms borrowed funds more than three years before the survey, so that they do report outstanding debt in their capital structure.
Approved Borrower: the firm did apply for a loan during the previous three years and
was granted credit by its prospective lender(s).
Once we have classified our sample firms, we calculate descriptive statistics for each group of firms and test for significant differences across categories. We also conduct multivariate tests on the data, estimating a sequence of logistic regression models that explain the sequential selection of the loan application and approval process (Figure 1). First, a firm decides whether or not it needs credit. We include firms from all four groups in this analysis, and define Need Credit
as equal to zero for non-borrowers and a value of one to all other firms (Discouraged Borrowers,
Denied Borrowers and Approved Borrowers). Need Credit =
f (firm characteristics, market characteristics, owner characteristics,
firm-creditor relationship characteristics) (1) Second, a firm that needs credit decides whether or not to apply for credit. We exclude
Non-Borrowers from this model and define Apply for Credit as equal to zero for Discouraged Borrowers and equal to one for firms in one of the two groups that applied for credit (Denied Borrowers and Approved Borrowers).
Apply for Credit =
f (firm characteristics, market characteristics, owner characteristics,
firm-creditor relationship characteristics) (2) Third, a firm that decides to apply for credit is either approved or denied credit. In this stage of the model, we include only those firms that applied for credit and define Get Credit as
Get Credit =
f (firm characteristics, market characteristics, owner characteristics,
firm-creditor relationship characteristics) (1)
Figure 1:
Who needs and who gets credit?
A sequential model
(1) Need Credit? (2) Apply for Credit? (3) Get Credit? No Yes Yes Yes No No Non-Borrower Discouraged Borrower Denied Borrower Approved BorrowerWe estimate this three-step sequential model using a univariate probit model at step 1 and using a bivariate probit selection model (see Van de Ven and Van Pragg (1981) and Greene (1992) and (1996)) at steps 2 and 3. This selection model is an extension of the bivariate probit model, which itself is an extension of the univariate probit model. We use a probit model because our dependent variables are binary (i.e., they take on a value of zero or one), so that ordinary least squares is inappropriate. We use a bivariate probit selection model at steps 2 and 3 in order to account for a non-random selection mechanism operating on those firms that need
credit and on those firms that applied for credit. We cannot use the standard Heckman (1979) selection model because our the dependent variable in our second equation is binary; in Heckman’s model, the dependent variable in the second equation is continuous and can be estimated by ordinary least squares. The bivariate probit model consists of two equations
y*1 = β1 ' x1 + є1, y1 = sign(y*1) (1) and
y*2 = β2 ' x2 + є2, y2 = sign(y*2) (2) where:
є1, є2 ~ Bivariate Normal(0,0,1,1,ρ)
In the bivariate probit selection model, [y1, x1] are only observed when y2 is equal to one, so the error terms in eq. (1) and eq. (2) must be re-specified as єj = exp(γj , zj) uj, where [u1, u2] have the bivariate standard normal distribution. The estimated correlation coefficient ρ (the correlation between error terms є1 and є2) can be used to test for selection bias. If ρ is statistically significant, then we can reject the null hypothesis that selection bias is not present.
In our particular setting, our selection equation at step 2 is the Need Credit equation,
explaining who needs credit, and our primary equation of interest is the Apply for Credit
equation. At step 3, our selection equation is the Apply for Credit equation and our primary
equation of interest is the Get Credit equation. We estimate these models using the LIMDEP
statistical package.
4.2 Hypotheses
For explanatory variables, we generally follow the existing literature on the availability of credit, which hypothesizes that a lender is more likely to extend credit to a firm when that firm
shares characteristics of other firms that historically have been most likely to repay their credits.9 We expect that the same set of characteristics should explain Non-Borrowers relative to
Need-Credit firms and Applied-for-Credit firms relative to Discouraged Borrower, as well as Approved Borrowers relative to Denied Borrowers.
We include a vector of firm characteristics, a vector of market characteristics, a vector of
owner characteristics, and a vector of firm-lender relationship characteristics.
4.2.1 Firm Characteristics
Firm characteristics include public reputation as proxied by firm age; firm size as
measured by annual sales; firm leverage as measured by the ratio of total liabilities to total
assets; firm profitability as measured by return on assets; firm liquid assets as measured by the
ratio of cash to total assets;10 organizational form as measured by dummy variables for
C-Corporations, S-Corporations, Partnerships and Proprietorships; firm credit quality as proxied
by the number of obligations on which the firm has been 60 or more days delinquent during the
previous three years, whether the firm had declared bankruptcy in the past seven years, and a
categorical representation of the D&B credit score;11 and firm industrial classification as
measured by a set of dummy variables for one- or two-digit SIC code.
9 See, for example, Cole (1998) and Cole, Goldberg and White (2004).
10 Financial ratios are winsorized at the 99th percentiles to mitigate the effects of large outliers on the results. Results obtained when these observations are deleted rather than winsorized are not qualitatively different.
11The SSBF variable for the 2003 D&B Credit Score ranges from 1 to 6, with a higher number
indicating better credit quality. For 1998, the SSBF variable for the D&B Credit Score ranges from 1 to 5, with a higher number indicating worse credit quality. The 1993 SSBF does not provide this variable.
Older firms are thought to be more creditworthy because they have survived the high-risk start-up period in a firm’s life cycle and, over time, have developed a public track record that ca be scrutinized by a prospective lender. Larger firms are thought to be more creditworthy because they tend to be better established and typically are more diversified than smaller firms. More profitable firms are thought to be more creditworthy because they have demonstrated their ability to cover future debt service out of earnings. Firms with more liquid assets are thought to be more creditworthy because they are more likely to be able to meet their current financial obligations.
Proprietorships are thought to be more creditworthy than partnerships and corporations, ceteris paribus, because a lender can seize the owner’s personal assets, as well as business assets, to satisfy a claim. Similarly, partnerships are thought to be more creditworthiness than
corporations because a lender can seize the general partner’s personal assets, in addition to the firm’s business assets, in order to satisfy a claim. We have no expectations about the relative creditworthiness of S-corporations relative to C-corporations.
Firms with more delinquent business obligations, firms that have declared bankruptcy during the previous seven years and firms with worse D&B credit scores are thought to be less creditworthy because they have a demonstrated history of being unable to meet their previous financial obligations. Firms in certain industries, such as construction, manufacturing and transportation, are thought to be more creditworthy because they typically have more tangible assets that can be pledged as collateral than do firms in other industries, such as business services and professional services.
4.2.2 Market Characteristics
Market characteristics are as measured by three dummy variables for low, medium and high concentration as measured by a bank Herfindahl Index and a dummy for firms located in
Urban rather than rural areas. We are severely limited with respect to available market
characteristics because confidentiality concerns preclude the SSBF from providing the location of sample firms beyond Census region. However, the SSBF does provide a categorical variable indicating banking-market concentration, and a dummy variable indicating a firm located within an MSA.
We expect that firms would be less likely to be able to obtain credit in less competitive banking markets. To the extent that this variable does not completely capture variation in
banking competition, we expect that firms in rural markets also would be less likely to be able to obtain credit, as these markets tend to be less competitive.
4.2.3 Owner Characteristics
Our vector of owner characteristics includes owner’s reputation as measured by age,
years of business experience and dummy variables for educational attainment (high school, some college, college degree or graduate degree); the race, ethnicity and gender of the controlling
owner as measured by dummy variables for Black-, Hispanic-, Asian- and Female-owned firms;
the primary owner’s credit quality as measured by the number of credit obligations on which the
owner has been 60 or more days delinquent during the past three years, a dummy indicating
whether the owner has declared bankruptcy during the past seven years, and a dummy indicating
measures of the owner’s personal wealth: the value of any home equity and the net worth of the
owner, excluding home equity and equity in the firm.12
Firms with older owners are expected to be more creditworthy because older owners are thought to be wiser and have longer track records than younger owners. Firms with more
experienced owners are thought to be more creditworthy because they have a longer track record in the firm’s line of business. Firms with more educated owners are thought to be more
creditworthy because more educated owners are thought to be better equipped to successfully run a business.
We have no expectations regarding indicators for firms with minority controlling owners (Asian, Black, Female or Hispanic). We include these variables in an effort to ascertain whether minority-owned firms are experiencing disparate outcomes in the credit markets relative to firms whose controlling owners are white, non-Hispanic males.
Firms whose controlling owners have more delinquent personal obligations, have declared bankruptcy during the previous seven years, or have suffered a judgment against them during the previous three years are thought to be less creditworthy because they have a
demonstrated history of being unable to meet their previous personal credit obligations. Finally, firms whose controlling owners have greater personal wealth are thought to be more
creditworthy because they have more personal assets that can be pledged as collateral against firm borrowings.
4.2.4 Firm-Lender Relationship Characteristics
Our fourth and final vector of firm-lender relationship characteristics includes variables
that measure the strength of the firm’s relationship with its primary financial institution (“FI”): the length of the relationship, the distance between the firm and its primary FI, and a set of
dummy variables indicating the types of pre-existing relationships with the primary FI: checking
account, savings account, and/or financial management service). We also include dummy
variables indicating if the primary FI is a commercial bank, a savings bank or some other type of
FI. Finally, we include the total number of financial institutions from which the firm obtains any
financial service, which we further disaggregate into commercial banks and non-banks.
Creditors are expected to look more favorably upon loan applications from firms with which they have had longer relationships because the creditors have more private information about the prospective borrower gleaned from the relationship, such as account balances and payment histories. A creditor is expected to favor firms located closer to the creditor because the creditor can more easily monitor firms in the nearby market areas. Creditors are expected to favor firms with which they have pre-existing checking, savings or financial management
relationships because a creditor can use these relationships to gather valuable private information about the firm’s creditworthiness.
The type of primary financial institution chosen by a firm is expected to influence the availability of credit to that firm. Specialized lenders such as finance companies and savings associations typically make only specialized loans such as mortgages or asset-back loans such as equipment loans. If private information developed by the primary financial institution is valuable in allocating credit, then firms choosing such specialized lenders as their primary source of financial services will be at a disadvantage when applying for types of credit other than those in
which the primary lender specializes. Finally, firms that obtain financial services from more financial institutions have a wider set of potential lenders that have developed valuable private information about the firm and should be more likely to be able to obtain credit when needed.
5. Results
5.1 Descriptive Statistics: Firms that Need Credit versus Firms that Do Not Need Credit
For each of the three SSBFs, Table 1 presents weighted descriptive statistics for the full sample, and then, separately, for firms that Need credit and for firms that have No Need for
credit., along with a t-test for differences in means of these two groups. First, we will discuss the
full-sample means and then we will discuss the differences in the means of the Need and
No-Need firms.
5.1.1 Firm Characteristics
Average firm size as measured by annual sales declined from $566 thousand in 1993 to $529 thousand in 1998 before rising to $624 thousand in 2003. Size as measured by total assets exhibited a similar trend, falling from $278 thousand in 1993 to $249 thousand in 1998 before rising to $307 thousand in 2003. Size as measured by employment was less variable, rising from 6.78 in 1993 to 7.01 in 1998 and 7.02 in 2003.
Profitability as measured by return on assets ranged from 61 percent in 2003 to 88 percent in 1998. Leverage as measured by total liabilities to total assets ranged from 0.559 in 1993 to 0.845 in 2003. The ratio of cash to assets rose from 0.197 in 1993 to 0.257 in 2003.
Organizational form changed dramatically from 1993 to 2003, with S-corporations gaining in popularity at the expense of C-corporations. In 1993, 28 percent of the firms were
organized as C-corporations and 20 percent as S-corporations, but by 2003, S-corporations accounted for 31 percent of the sample while C-corporations accounted for only 14 percent. The portion of firms organized as proprietorships and partnerships remained relatively constant at about 46 percent and 8 percent, respectively.
The average firm had been in business for thirteen to fourteen years. Between 14 and 19 percent of the firms reported at least one delinquent business obligation and between 25 and 36 percent reported paying late on trade credit. The percent of firms reporting previous bankruptcy during the previous seven years (not collected for 1993) was 2.3 percent in 1998 and 1.0 percent in 2003. The average D&B score for 1998 was 2.99, where 1 indicates low risk, 3 indicates medium risk and 5 indicates high risk. The average D&B score for 2003 was 3.6, where 1 indicates high risk and 6 indicates low risk.
Use of business credit cards rose from 29 percent in 1993 to 47 percent in 1998 and 2003. Use of personal credit cards for business purposes fell from 41 percent in 1993 to 34 percent in 1998 and then rose to 48 percent in 2003.
By industry, 20-25 percent of the firms are in business services, 17-21 percent are in professional services, and 19-22 percent are in retail trade. Business and professional services saw the greatest increases from 1993-2003 whereas Transportation and Primary Manufacturing saw the greatest declines.
Most of the firm characteristics are significantly different for the subsamples of firms that
Need credit (discouraged, denied and approved) and firms that have No Need for credit. Need
firms are: much larger as measured by sales, assets and employment; less profitable; more highly levered; hold less cash; are younger; are much less likely to be organized as proprietorships and more likely to be organized as S- or C-Corporations. Need firms have inferior credit quality on
all four measures—business bankruptcy, delinquent business obligations, D&B credit score and trade credit paid late. Finally, Need firms are significantly more likely to use both personal and
business credit cards for business purposes.
In 1993, near the end of the credit crunch that afflicted the U.S. economy following the 1990-91 recession, Need firms accounted for 55 percent of the sample, but in 1998, when the
U.S. was in the middle of a ten-year economic boom cycle, accounted for only 41 percent of the sample. During 2003, as the economy was recovering from 9/11 and the 2001-2002 recession, Need firms accounted for 49 percent of the sample.
5.1.2 Market Characteristics
Almost 80 percent of the firms are located in Urban areas and just under half are located in highly concentrated banking markets. None of the market characteristics are consistently significant in explaining differences in firms that need credit and those that do not need credit.
5.1.3 Primary Owner Characteristics
The average primary owner was 49-52 years old with 18-20 years of experience. and had at least a college education. Between 18-20 percent had a graduate degree and another 26-30 percent had a college degree. By race, ethnicity and gender, 3-4 percent of the primary owners were Black, 3-4 percent were Asian, 4-6 percent were Hispanic and 21-26 percent were female. Only 1-3 percent of the owners had declared bankruptcy during the previous seven years and only 2-5 percent reported a judgment against themselves during the previous three years. On average, 12-14 percent of the firm owners had at least one delinquent personal obligation. The
average value of the owner’s net worth (excluding the value of the firm) was $500 thousand -$700 thousand.
As with firm characteristics, most of the primary owner characteristics are significantly different for the groups of firms that need and don’t need credit across all three SSBFs. Firms that need credit are significantly younger, less experienced and less educated; and have
significantly worse credit quality by all measures—owner bankruptcy, owner delinquencies, and owner judgments. They also have significantly less owner personal wealth. Finally, they are significantly more likely to be Black and Hispanic but not Asian or Female.
5.1.4 Relationship Characteristics
The vast majority of firms (80-82 percent) designate a commercial bank as their primary source of financial services, with 10-13 percent designating a savings association and the remainder designating some other source. The average length of the firm’s relationship with its primary source is between 8-10 years 95-124 months) and the average distance from the firm and its primary source is 14-33 miles. The average firm obtained financial services from 1.2
commercial banks and from 0.8-1.1 non-bank financial institutions.
Firms that need credit were significantly more likely to designate a finance company as their primary financial institution, had significantly shorter lengths of relationships with their primary financial institution, and had significantly fewer bank and nonbank sources of financial services.
5.2 Descriptive Statistics: Discouraged Firms versus Firms that Applied for Credit
For each of the three SSBFs, Table 2 presents weighted descriptive statistics for the full sample of firms indicating that they needed credit and, separately, for Discouraged Firms and
Applied Firms (firms that applied for credit), along with a t-test for differences in means of these
two groups.
5.2.1 Firm Characteristics
When compared with Applied Firms, we find that Discouraged Firms are significantly
smaller, more highly levered, have more cash, are less likely to be organized as corporations and more likely to be organized as proprietorships, are younger and have worse credit quality as measured by firm bankruptcy, firm delinquent obligations and D&B Credit Score. Discouraged
Firms are significantly less likely to use personal credit cards for business purposes 5.2.2 Market Characteristics
When we examine market characteristics, we find that Discouraged Firms are
significantly more likely to be located in an MSA, but we find no consistent differences by banking market concentration.
5.2.3 Owner Characteristics
When compared with Applied Firms, Discouraged Firms have controlling owners that
are younger, have less experience and less education, are more likely to be Black and Female, have worse credit quality as measured by owner bankruptcy and owner delinquent obligations, and have less personal wealth.
5.2.4 Firm-Creditor Relationship Characteristics
When compared with Applied firms, Discouraged Firms are less likely to designate a
relationships with their primary sources, and obtain financial services from significantly fewer sources, both commercial bank and nonbank.
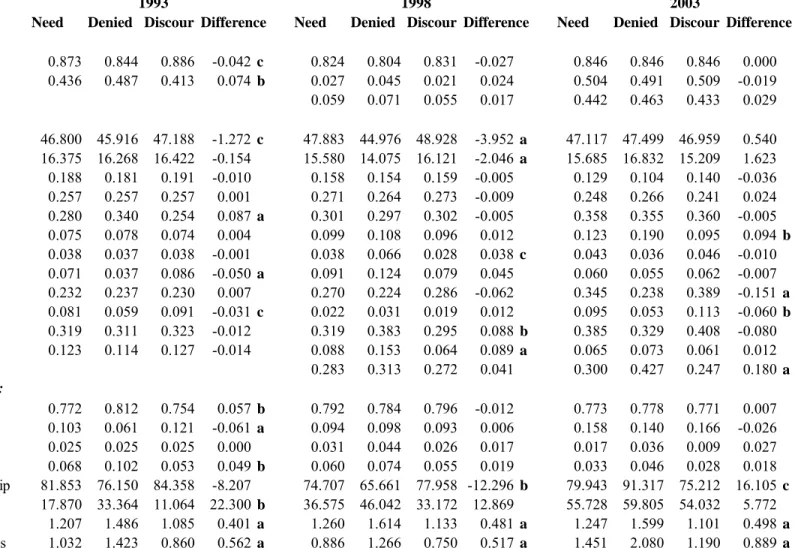
5.3 Descriptive Statistics: Discouraged Firms versus Denied Firms
In Table 3 are descriptive statistics for Discouraged Firms and Denied Firms, along with
t-statistics for tests of differences in means of these two groups. When compared with Denied
Firms, we find that Discouraged Firms are significantly smaller, more profitable, hold more
cash, are less likely to be organized as corporations and more likely to be organized as
proprietorships, are younger, are less likely to use business credit cards, and are less likely to pay late on trade credit. Owners of Discouraged Firms are more likely to be Black and Female, are
more likely to have declared bankruptcy; and have less personal wealth. Discouraged Firms
obtain financial services from significantly fewer commercial bank and nonbank sources. In summary, we find a number of significant differences in Discouraged Firms and
Denied Firms in variables typically used to measure the availability of credit. This finding argues
against pooling these two groups in any study of the availability of credit.
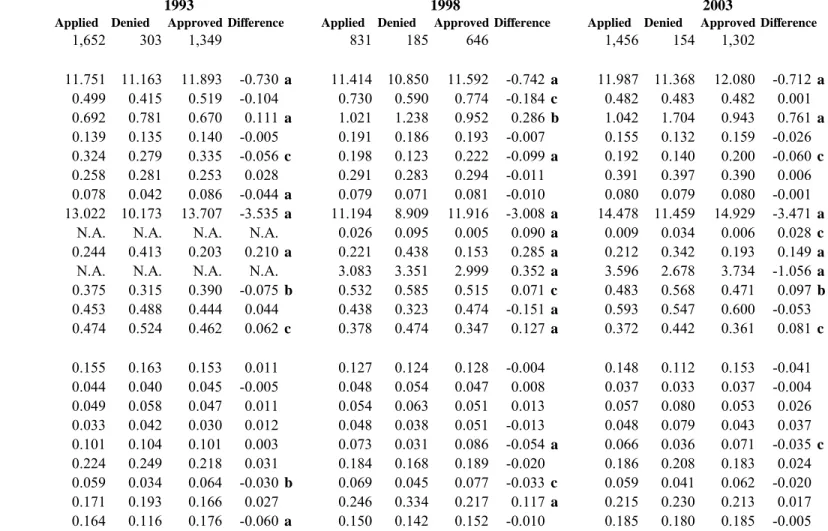
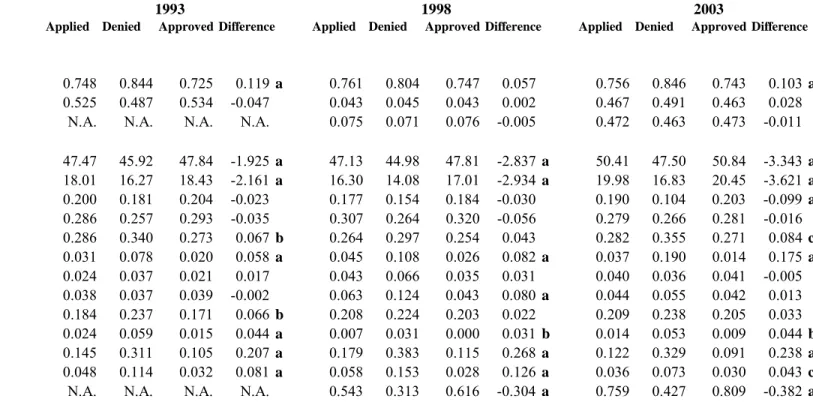
5.4 Descriptive Statistics: Approved Firms versus Denied Firms
For each of the three SSBFs, Table 4 presents weighted descriptive statistics for the full sample of firms that applied for credit and, separately, for Denied Firms (firms that applied for
credit and whose applications were denied) and Approved Firms (firms that applied for credit
and whose applications were approved), along with a t-test for differences in means of these two
When compared with Approved Firms, we find that Denied Firms are significantly
smaller; are more highly levered; are less likely to be C-Corporations and more likely to be Proprietorships; are younger; and have lower credit quality as measured by business
bankruptcies, firm delinquencies, D&B score and Trade Credit Paid Late.
Denied Firms are significantly more likely to be located in urban areas. Owners of Denied Firms are significantly younger; are less experienced; are less educated; are more likely
to be Black; have significantly lower credit quality as measured by owner bankruptcy, owner delinquencies and owner judgments; and have less personal wealth.
A Denied Firm is significantly more likely to use a commercial bank and less likely to
use a finance company when applying for its most recent loan application; has a much shorter relationship with the source of its most recent loan application; is less likely to obtain checking, savings and other financial services from the institution where it made its most recent loan application. In general, most of these results are consistent with those found in previous studies that analyzed data only from the 1993 SSBF.
5.5 Multivariate Analysis
Tables 5, 6, and 8 present the results from estimating the three sequential logistic regression models described in Section IV: Firms that need credit versus firms that don’t need credit (Table 5); Discouraged firms versus firms that applied for credit (Table 6); and Approved firms versus Denied Firms (Table 8). Table 7 presents results for Discouraged versus Denied firms.
5.5.1 Firms that Don’t Need Credit
In Table 5 are the results from estimating a weighted probit regression model where the dependent variable Need Credit is equal to one if the firm indicated that it did not need credit
(Non-Borrowers) and equal to zero otherwise (including Discouraged Firms, Denied Firms and Approved Firms). For each variable, the table shows the marginal effect and the associated
t-statistic.
This analysis reveals that Non-Borrower firms are significantly smaller; are more
profitable; are less levered; are more liquid (holding more cash); are less likely to be organized as corporations and more likely to be organized as proprietorships; are older; have higher credit quality as measured by firm bankruptcy, firm delinquencies, D&B credit score and trade credit paid late. In general, these findings are consistent with the pecking-order theory of capital structure.
Non-Borrower firms are more likely to be located in MSAs.
Owners of Non-Borrower firms are older; are less likely to be Black; have higher credit
quality as measured by owner bankruptcy, owner delinquencies, and owner judgments; and have greater owner personal wealth.
Non-Borrower firms are less likely to designate a finance company as their primary
source of financial services; have longer relationships with their primary source of financial services. Finally, they use significantly fewer sources of financial services, both bank and non-bank.
5.5.2 Discouraged Borrowers
In Table 6 are the results from the second stage of a bivariate probit selection model where Apply for Credit is equal to one if the firm indicated that it needed credit but was
discouraged and did not apply for credit (Discouraged) and equal to zero if it applied for credit (Denied firms and Approved firms). We do not present or discuss the selection equation Need
Credit because it is fundamentally identical to the equation in Table 5 and the estimated
correlation coefficient is not significantly different from zero.
Our analysis reveals that, when compared to Applied firms, Discouraged firms are
significantly smaller; have worse credit quality as measured by firm delinquencies and D&B Credit Score; and are more likely to be located in urban areas.
Owners of Discouraged firms are significantly younger; have worse credit quality as
measured by owner bankruptcy and owner delinquencies; and have less owner personal wealth.
Discouraged firms use fewer sources of financial services—both bank and non-bank.
In Table 7 are the results from the second stage of a bivariate probit selection model where Denied Credit is equal zero if the firm indicated that it needed credit but was discouraged
and did not apply for credit (Discouraged Firms) and equal to one if the firm applied for but was denied credit (Denied Firms). Discouraged firms are significantly smaller, more profitable, and
older.
The owners of Discouraged firms are significantly younger.
Discouraged firms use significantly fewer sources of financial services—both bank and
5.5.3 Approved Borrowers
In Table 8 are the results from the second stage of a bivariate probit selection model where Get Credit is equal to one if the firm indicated that it applied for and was extended credit
(Approved firms) and equal to zero if it applied for credit but was turned down (Denied firms).
Results for the selection equation Applied for Credit are not presented because they are virtually identical to the results in Table 6 and because the estimated correlation coefficient between error terms in the two equations is not significantly different from zero.
This analysis reveals that Approved firms are significantly larger and more profitable; and
have significantly better credit quality as measured by firm bankruptcy, firm delinquencies and D&B credit scores.
The owners of Approved Firms are less likely to be Black; and have higher credit quality
as measured by owner bankruptcy, owner delinquencies and owner judgments.
Approved Firms are significantly more likely to apply for their most recent loan at a
potential source that is other than a commercial bank or savings association, to obtain financial services from significantly fewer non-banks, and to apply for a mortgage, motor vehicle loan or equipment loan—each of which provides collateral for the lender.
Our results regarding the creditworthiness of both the firm and its primary owner have important implications for the growing literature on credit scoring. Berger, Cowan, and Frame (2008) report that banks using credit scoring to evaluate small business loan applications are significantly more likely to use consumer credit scores rather than small business credit scores, but very few banks use both credit scores. Our results suggest that both types of credit scores are useful in evaluating small business loan applications.
5.5.4 Renewals of Credit Lines
A significant portion of the most recent loan applications are, in fact, applications to renew an existing line of credit. There are 573 such renewal applications, which make up almost 40 percent of the total applications, but only 8 percent of denials. In order to see if these renewal applications are driving our results (and those of previous studies using the earlier SSBFs, which did not enable researchers to distinguish between renewal applications and new applications), we rerun our analysis, excluding these 573 renewal applications. (There are too few denials to perform a meaningful analysis of renewal applications by themselves.) The results are
qualitatively unchanged by the exclusion of the line-of-credit renewal applications. Each variable that is significant when they are included remains significant when they are excluded. In fact, significance levels often increase when the renewal applications are excluded.
6. Summary and Conclusions
In this study, we analyze data from the 1993, 1998 and 2003 Surveys of Small Business Finance for new evidence regarding the availability of credit to small and minority-owned firms. We make at least four significant contributions to the literature on the availability of credit.
First, we provide the first rigorous analysis of the differences in our four types of firms: non-borrowers, discouraged borrowers, denied borrowers and successful borrowers. Our findings have important implications for interpreting previous research that has combined these groups in ways that our results suggest are inappropriate, such as pooling discouraged borrowers with denied borrowers in analyzing availability of credit.
Second, we provide an analysis of credit availability that properly accounts for the inherent self-selection mechanisms involved in the credit application process: who needs credit,
who applies for credit conditional upon needing credit, and who receives credit, conditional upon applying for credit. Previous researchers have pooled firms that do not need credit with those needing credit and have pooled discouraged borrowers with denied borrowers. Hence, our results shed new light upon the credit-allocation process.
Third, we provide new evidence on the availability of credit to minority-owned firms by examining three SSBFs spanning more than a decade during which the Community
Reinvestment Act (CRA) became increasingly important in the regulation of depository
institutions. We find that, in each of the three SSBFs, Black-owned firms are disproportionately turned down when applying for credit. Our results indicate that Black-owned firms are 10 to 18 percent more likely to be rejected than other firms, even after incorporating the increasingly extensive set of control variables available from the SSBFs. Moreover, this percentage has increased, rather than decreased with each successive SSBF.
Fourth, we provide new evidence from the 2003 SSBF on the availability of credit to small firms. This survey includes methodological improvements on the previous SSBFs (1987, 1993 and 1998) that enable us to better address the issue of availability of credit to small firms. One of the most important is the identification of applications to renew existing lines of credit, which enables us for the first time to differentiate the availability of new credit from renewals of existing credit.
This study provides both academics and policymakers with new insights on how to tailor regulations to help small businesses obtain needed credit and reach their optimal capital
structures. Of especial interest is the new evidence brought to light by the sequential model of the credit application process regarding why a significant percentage of firms choose not to borrow—the non-borrowers and the discouraged borrowers. This is critically important because
evidence from the SSBFs reveals almost half of all firms do not appear to “need” credit and that as many as one out of seven small firms has a negative ratio of debt to equity because their debt exceeds their assets. Theory suggests that poorly capitalized firms are less likely to hire new employees or make new long-term investments that could improve economic growth, so policies that help these firms improve their capitalization should lead to higher growth in both
employment and output (GDP). Our evidence suggests that a significant portion of the “discouraged” firms would be successful in obtaining credit if only they would apply.
REFERENCES
Ang, J., Cole, R., Lin, J. 2000. Agency costs and ownership structure. The Journal of Finance
55, 81-106
Berger, A., Cowan, A., Frame, S. 2009. The Surprising Use of Credit Scoring in Small Business Lending by Community Banks and the Attendant Effects on Credit Availability and Risk. Federal Reserve Bank of Atlanta Working Paper 2009-9.
Berger, A., Frame, S., Miller, N. 2005. Credit Scoring and the Availability, Price and Risk of Small Business Credit. Journal of Money, Credit and Banking 37(2), 191-222.
Berger, A., Miller, N., Rajan, R., Stein, J., Petersen, M. 2005. Does Function Follow
Organizational Form? Evidence From the Lending Practices of Large and Small Banks." Journal of Financial Economics 76 (2): 237-269.
Berger, A., Udell, G. 1995. Relationship Lending and Lines of Credit in Small Firm Finance.
Journal of Business 68, 351-381.
Berlin, M., Mester, L. 1999. Deposits and Relationship Lending. Review of Financial Studies
12(3), 579-607.
Bitler, M., Robb, A., Wolken, J. 2001. Financial Services Used by Small Businesses: Evidence from the 1998 Survey of Small Business Finances. Federal Reserve Bulletin 87 (April), 183-205.
Bitler, M., Moskowitz, T., Vissing-Jorgensen, A. 2005. Testing Agency Theory with Entrepreneur Effort and Wealth. Journal of Finance 60(2), 539-576.
Black, S., Strahan, P., 2002. Entrepreneurship and Bank Credit Availability. Journal of Finance
57(6), 2807-2833.
Blanchflower, D., Levine, P., Zimmerman, D. 2003. Discrimination in the Small Business Credit Market.Review of Economics and Statistics 84 (4), 930-943.
Carey, Mark, Mitch Post, and Steven Sharpe. “Does Corporate Lending by Banks and Finance Companies Differ? Evidence on Specialization in Private Debt Contracting.” Journal of Finance, 53
(1998), 845-878.
Cavalluzzo, K., Cavalluzzo, L. 1998. Market Structure and Discrimination: The Case of Small Businesses. Journal of Money, Credit and Banking 30 (4), 771-92.
Cavalluzzo, K., Cavalluzzo, L., Wolken, J. 2002. Competition, Small Business Financing, and Discrimination: Evidence From a New Survey. Journal of Business 75(4), 641-679.
Cavalluzzo, K., Wolken, J. 2005. Small Business Loan Turndowns, Personal Wealth and Discrimination. Journal of Business 78(6): 2153-2178.
Chakraborty, A., Hu, C. 2006. Lending Relationships in Line-of-Credit and Non-Line-of- Credit Loans: Evidence from Collateral Use in Small Business.Journal of Financial Intermediation. 15 (1), 86-107.
Cole, R. 1998. The importance of relationships to the availability of credit. Journal of Banking and Finance 22, 959-997.
Cole, R. 1998. The Availability of Credit to Small and Minority-Owned Businesses: Evidence from the 1993 Survey of Small Business Finances.
Available at http://ssrn.com/abstract=1007077.
Cole, R., Goldberg, L. and White, L. 2004. Cookie-cutter versus character: The micro structure of small-business lending by large and small banks. Journal of Financial and Quantitative Analysis 39, 227-251.
Cole, R., Wolken, J., 1995. Financial Services Used by Small Businesses: Evidence from the 1993 National Survey of Small Business Finances. Federal Reserve Bulletin 81 (July), 630-67.
Cole, R., Wolken, J., Woodburn, L. 1996. Bank and non-bank competition for small business credit: Evidence from the 1987 and 1993 National Surveys of Small Business Finances. Federal Reserve Bulletin 82 (November), 983-995.
Coleman, S. 2002. The Borrowing Experience of Black and Hispanic-Owned Small Firms: Evidence from the 1998 Survey of Small Business Finances.The Academy of Entrepreneurship Journal 8 (1), 1-20.
Coleman, S. 2004. Access to Debt Capital for Small Women- and Minority-Owned Firms: Does Educational Attainment Have an Impact? Journal of Developmental Entrepreneurship 9 (2),
127-144.
Elliehausen, G., Wolken, J. 1990. Banking markets and the use of financial services by small and medium-sized businesses. Federal Reserve Bulletin 76 (October), 801-817.
Greene, W. 1992. A statistical model for credit scoring. NYU Working Paper # EC-92-29. Greene, W. 1996. Marginal effects in the bivariate probit model. Working paper available at
http://ssrn.com/abstract=1293106.
Greene, W. 1996. LIMDEP Version 7.0 User’s Manual. Bellport, NY: Econometric Software,
Inc.
Greene, W. 2003. Econometric Analysis, 5th Ed. Upper Saddle River, Prentice Hall.
Jen, F., 1964. The determinants of the degree of insufficiency of bank credit to small business.
Mach, T., Wolken, J. 2006. Financial services used by small businesses: Evidence from the 2003 Survey of Small Business Finance. Federal Reserve Bulletin Oct 2006, 167-195.
Petersen, M., Rajan, R. 1994. The benefits of lending relationships: Evidence from small business data. Journal of Finance, 46(1), 3-37.
Petersen, M., Rajan, R. 1995. The Effect of Credit Market Competition on Lending Relationships. Quarterly Review of Economics, 110, 407-443.
Petersen, M., Rajan, R. 2002. Does Distance Still Matter? The Information Revolution in Small Business Lending. Journal of Finance 57, 2533-2570.
Van de Ven, W., Van Praag, B., The demand for deductibles in private health insurance: A probit model with sample selection. Journal of Econometrics 17, 229-252.
Wendt, P. 1947. The Availability of Capital to Small Businesses in California. The Journal of Finance 2 (2), 43-54.
Appendix Table 1 Panel A: Definitions of Explanatory Variables
Data are from the 1993, 1998 and 2003 Surveys of Small Business Finances. Variable
Firm Characteristics
Sales Annual Sales Revenues Assets Total Assets
Employment Number of Employees
ln(Assets) Natural Logarithm of Total Assets
ROA Return on Assets (Net Income divided by Total Assets), winsorized at 99th percentiles Liabilities to Assets Total Liabilities to Total Assets
Cash to Assets Cash to Total Assets
C-Corp Firm is Organized as a C-Corporation S-Corp Firm is Organized as an S-Corporation Partnership Firm is Organized as a Partnership
Firm Age Number of Years since the Firm was Founded, Purchased or Acquired Bus Bankruptcy Firm declared Bankrupcy During Past Seven Years
Bus Delinquencies Firm was Delinquent on a Business Obligation During the Previous Three Years D&B Bus Credit Score Dun&Bradstreet Credit Score converted to Categorical Variable
Use Bus Credit Card Firm Uses Business Credit Card to Pay Business Expenses
Use Own Credit Card Firm Uses Owner's Personal Credit Card to Pay Business Expenses Trade Credit Paid Late Firm Paid Late on Trade Credit During the Previous Three Years
Industry
SIC 1 Firm is in Construction & Mining SIC 2 Firm is in Primary Manufacturing SIC 3 Firm is in Secondary Manufacturing SIC 4 Firm is in Transportation
SIC 51 Firm is in Wholesale Sales SIC 52 Firm is in Retail Sales
SIC 6 Firm is in Finance or Real Estate (Financial Institutions are excluded from the SSBFs) SIC 7 Firm is in Business Services
Appendix Table 1 Panel B: Definitions of Explanatory Variables
Data are from the 1993, 1998 and 2003 Surveys of Small Business Finances. Variable
Market Characteristics
MSA Firm is located in a Metropolitan Statistical Area
HHI High Firm is located in a Banking Market with High Herfindahl Concentration Ratio HHI Medium Firm is located in a Banking Market with a Medium Herfindahl Concentration Ratio
Owner Characteristics
Owner Age Age of the Primary Owner
Owner Experience Years of Experience of the Primary Owner Owner Graduate Degree Primary Owner has a Graduate Degree Owner College Degree Primary Owner has a College Degree Owner Some College Primary Owner Attended College Black Owner Primary Owner is Black
Asian Owner Primary Owner is Asian Hispanic Owner Primary Owner is Hispanic Female Owner Primary Owner is Female
Owner Bankruptcy Primary Owner has declared Bankruptcy During Past Seven Years
Owner Delinquencies Primary Owner has been delinquent on Personal Obligations During Past Three Years Owner Judgement Primary Owner has had a Judgment Rendered against her During Past Three Years Owner Personal Wealth Personal Wealth of Primary Owner
Firm-Creditor Relationships
Primary is Comm Bank Firm's Primary Source of Financial Services is a Commercial Bank Primary is Savings Assoc Firm's Primary Source of Financial Services is a Savings Association Primary is Finance Co Firm's Primary Source of Financial Services is a Finance Company Primary is Other Firm's Primary Source of Financial Services is a Other
Primary Length of Relationship Number of Years that the Firm has had a Relationship with its Primary Source of Financial Services Primary Distance Distance in miles between the Firm's Primary Location and Location of its Primary Source
Number of Bank Sources Number of Banks from which the Firm Obtains Financial Services Number of Non-Bank Sources Number of Non-Banks from which the Firm Obtains Financial Services
Appendix Table 1 Panel C: Definitions of Explanatory Variables
Data are from the 1993, 1998 and 2003 Surveys of Small Business Finances.
Variable
Relationship Characteristics:
MRL Source is a Comm Banks Most Recent Loan Source is a Commercial Bank MRL Source Savings Assoc Most Recent Loan Source is a Savings Association MRL Source Finance Co Most Recent Loan Source is a Finance Company MRL Source Other Most Recent Loan Source is Other
MRL Length of Relationship Number of Years that the Firm has had a Relationship with its Most Recent Loan Source MRL Distance from Firm Distance in miles between the Firm's Primary Location and its Most Recent Loan Source Number of Bank Sources Number of Bank Sources for Financial Services
Number of Non-Bank Sources Number of Non-Bank Sources for Financial Services
MRL Checking Relationship Firm has a Checking Account at its Most Recent Loan Source MRL Savings Relationship Firm has a Savings Account at its Most Recent Loan Source
MRL Fin'l Svcs Relationship Firm obtains other Financial Services from its Most Recent Loan Source MRL Line of Credit Relationship Firm has a Pre-Existing Line of Credit at its Most Recent Loan Source MRL Loan Relationship Firm has a Pre-Existing Loan at its Most Recent Loan Source
MRL is a Credit Line Most Recent Loan Application was for a New Line of Credit or a Renewal of a Line of Credit MRL is a New Credit Line Most Recent Loan Application was for a New Line of Credit
MRL is a Lease Most Recent Loan Application was for a Lease
MRL is a Mortgage Most Recent Loan Application was for a Mortgage Loan MRL is a Motor Vehicle Loan Most Recent Loan Application was for a Motor Vehicle Loan MRL is an Equipment Loan Most Recent Loan Application was for an Equipment Loan MRL is an Other Loan Most Recent Loan Application was for Other Loan Type
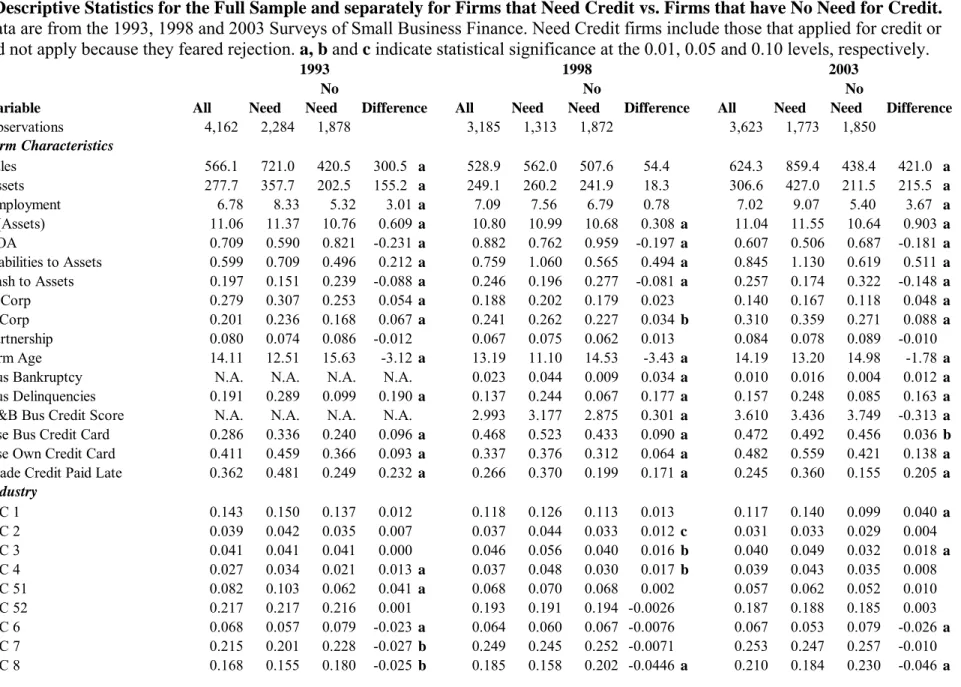
Table 1 Panel A:
Descriptive Statistics for the Full Sample and separately for Firms that Need Credit vs. Firms that have No Need for Credit.
Data are from the 1993, 1998 and 2003 Surveys of Small Business Finance. Need Credit firms include those that applied for credit or did not apply because they feared rejection. a,b and c indicate statistical significance at the 0.01, 0.05 and 0.10 levels, respectively.
No No No
Variable All Need Need Difference All Need Need Difference All Need Need Difference
Observations 4,162 2,284 1,878 3,185 1,313 1,872 3,623 1,773 1,850 Firm Characteristics Sales 566.1 721.0 420.5 300.5 a 528.9 562.0 507.6 54.4 624.3 859.4 438.4 421.0 a Assets 277.7 357.7 202.5 155.2 a 249.1 260.2 241.9 18.3 306.6 427.0 211.5 215.5 a Employment 6.78 8.33 5.32 3.01 a 7.09 7.56 6.79 0.78 7.02 9.07 5.40 3.67 a ln(Assets) 11.06 11.37 10.76 0.609a 10.80 10.99 10.68 0.308 a 11.04 11.55 10.64 0.903a ROA 0.709 0.590 0.821 -0.231a 0.882 0.762 0.959 -0.197 a 0.607 0.506 0.687 -0.181a Liabilities to Assets 0.599 0.709 0.496 0.212a 0.759 1.060 0.565 0.494 a 0.845 1.130 0.619 0.511a Cash to Assets 0.197 0.151 0.239 -0.088a 0.246 0.196 0.277 -0.081 a 0.257 0.174 0.322 -0.148a C-Corp 0.279 0.307 0.253 0.054a 0.188 0.202 0.179 0.023 0.140 0.167 0.118 0.048a S-Corp 0.201 0.236 0.168 0.067a 0.241 0.262 0.227 0.034 b 0.310 0.359 0.271 0.088a Partnership 0.080 0.074 0.086 -0.012 0.067 0.075 0.062 0.013 0.084 0.078 0.089 -0.010 Firm Age 14.11 12.51 15.63 -3.12 a 13.19 11.10 14.53 -3.43 a 14.19 13.20 14.98 -1.78 a
Bus Bankruptcy N.A. N.A. N.A. N.A. 0.023 0.044 0.009 0.034 a 0.010 0.016 0.004 0.012a
Bus Delinquencies 0.191 0.289 0.099 0.190a 0.137 0.244 0.067 0.177 a 0.157 0.248 0.085 0.163a
D&B Bus Credit Score N.A. N.A. N.A. N.A. 2.993 3.177 2.875 0.301 a 3.610 3.436 3.749 -0.313a
Use Bus Credit Card 0.286 0.336 0.240 0.096a 0.468 0.523 0.433 0.090 a 0.472 0.492 0.456 0.036b
Use Own Credit Card 0.411 0.459 0.366 0.093a 0.337 0.376 0.312 0.064 a 0.482 0.559 0.421 0.138a
Trade Credit Paid Late 0.362 0.481 0.249 0.232a 0.266 0.370 0.199 0.171 a 0.245 0.360 0.155 0.205a
Industry SIC 1 0.143 0.150 0.137 0.012 0.118 0.126 0.113 0.013 0.117 0.140 0.099 0.040a SIC 2 0.039 0.042 0.035 0.007 0.037 0.044 0.033 0.012 c 0.031 0.033 0.029 0.004 SIC 3 0.041 0.041 0.041 0.000 0.046 0.056 0.040 0.016 b 0.040 0.049 0.032 0.018a SIC 4 0.027 0.034 0.021 0.013a 0.037 0.048 0.030 0.017 b 0.039 0.043 0.035 0.008 SIC 51 0.082 0.103 0.062 0.041a 0.068 0.070 0.068 0.002 0.057 0.062 0.052 0.010 SIC 52 0.217 0.217 0.216 0.001 0.193 0.191 0.194 -0.0026 0.187 0.188 0.185 0.003 SIC 6 0.068 0.057 0.079 -0.023a 0.064 0.060 0.067 -0.0076 0.067 0.053 0.079 -0.026a SIC 7 0.215 0.201 0.228 -0.027b 0.249 0.245 0.252 -0.0071 0.253 0.247 0.257 -0.010 SIC 8 0.168 0.155 0.180 -0.025b 0.185 0.158 0.202 -0.0446 a 0.210 0.184 0.230 -0.046a 1993 1998 2003
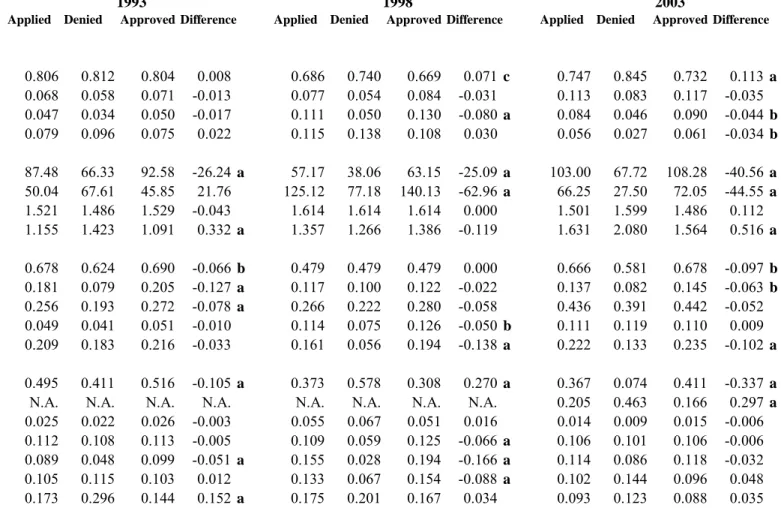
Table 1 Panel B:
Descriptive Statistics for Full Sample and separately for Firms that Need Credit vs. Firms that have No Need for Credit.
Data are from the 1993, 1998 and 2003 Surveys of Small Business Finance. Need Credit firms include those that applied for credit or did not apply because they feared rejection. a,b and c indicate statistical significance at the 0.01, 0.05 and 0.10 levels, respectively.
No No No
Variable All Need Need Difference All Need Need Difference All Need Need Difference
Market Characteristics
MSA 0.786 0.790 0.783 0.007 0.798 0.789 0.803 -0.014 0.793 0.778 0.806 -0.028b
HHI High 0.487 0.490 0.483 0.007 0.039 0.034 0.043 -0.008 0.479 0.477 0.481 -0.004 HHI Medium N.A. N.A. N.A. N.A. 0.063 0.067 0.061 0.006 0.461 0.463 0.459 0.004
Owner Characteristics
Owner Age 49.30 47.38 51.09 -3.712a 50.07 47.85 51.50 -3.648 a 51.51 49.58 53.03 -3.441a
Owner Experience 18.70 17.52 19.81 -2.286a 18.06 16.23 19.23 -3.000 a 19.61 18.84 20.22 -1.373a
Owner Graduate Degree 0.202 0.197 0.206 -0.009 0.184 0.170 0.193 -0.023 c 0.208 0.178 0.232 -0.054a
Owner College Degree 0.260 0.277 0.244 0.033b 0.300 0.293 0.304 -0.011 0.291 0.270 0.307 -0.036b
Owner Some College 0.255 0.276 0.236 0.040a 0.279 0.279 0.279 0.001 0.267 0.300 0.241 0.059a
Black Owner 0.030 0.044 0.016 0.028a 0.041 0.066 0.025 0.041 a 0.039 0.051 0.030 0.021a Asian Owner 0.036 0.028 0.043 -0.014b 0.043 0.037 0.047 -0.010 0.044 0.042 0.046 -0.005 Hispanic Owner 0.043 0.053 0.034 0.019a 0.057 0.069 0.050 0.019 b 0.044 0.048 0.040 0.008 Female Owner 0.209 0.198 0.219 -0.020 0.241 0.239 0.243 -0.004 0.263 0.252 0.271 -0.019 Owner Bankruptcy 0.027 0.044 0.011 0.034a 0.006 0.012 0.002 0.010 a 0.025 0.038 0.015 0.023a Owner Delinquencies 0.137 0.199 0.078 0.122a 0.126 0.226 0.062 0.164 a 0.121 0.190 0.066 0.124a Owner Judgement 0.051 0.072 0.030 0.042a 0.038 0.060 0.023 0.037 a 0.023 0.042 0.008 0.034a
Owner Personal Wealth N.A. N.A. N.A. N.A. 0.524 0.435 0.581 -0.146 a 0.700 0.637 0.749 -0.112a
Firm-Creditor Relationships
Primary is Comm Bank 0.821 0.823 0.819 0.004 0.823 0.818 0.826 -0.008 0.801 0.811 0.793 0.018 Primary is Savings Assoc 0.096 0.095 0.096 0.000 0.097 0.082 0.107 -0.025 b 0.128 0.129 0.126 0.003
Primary is Finance Co 0.014 0.022 0.006 0.015a 0.018 0.030 0.011 0.019 a 0.010 0.016 0.006 0.010a
Primary is Other 0.041 0.045 0.038 0.008 0.036 0.058 0.021 0.037 a 0.035 0.037 0.034 0.004
Primary Length of Relationship 110.1 94.6 124.8 -30.2 a 95.1 79.3 105.2 -26.0 a 123.8 109.8 134.8 -25.0 a
Primary Distance 13.86 15.45 12.37 3.08 32.48 51.27 20.41 30.86 a 32.91 45.77 22.75 23.02a
Number of Bank Sources 1.244 1.387 1.110 0.277a 1.215 1.421 1.082 0.339 a 1.229 1.405 1.090 0.316a
Number of Non-Bank Sources 0.822 1.065 0.595 0.470a 0.819 1.114 0.630 0.484 a 1.142 1.526 0.839 0.687a