Small business finance in two Chicago minority neighborhoods
Paul Huck, Sherrie L. W. Rhine,Philip Bond, and Robert Townsend
Paul Huck and Sherrie L. W. Rhine are economists at the Federal Reserve Bank of Chicago. Philip Bond is a visiting lecturer at the London School of Economics. Robert Townsend is a professor of economics at the University of Chicago and a consultant to the Federal Reserve Bank of Chicago. This project was originally funded by the Center for the Study of Urban Inequality of the University of Chicago, with Richard Taub, Marta Tienda, and Robert Townsend as principal investigators, and is cosponsored by the University of Chicago and the Federal Reserve Bank of Chicago. Robert Townsend also receives financial support from the National Science Foundation. The authors would like to thank Dan Aaronson, David Marshall, and Alicia Williams for helpful comments on an earlier draft.
Introduction and summary
Chicago is enlivened by the presence of many ethnic neighborhoods, which are reflected in the citys small business sector. This makes Chicago an excellent loca-tion for studying small business finance in ethnic communities. The topic is important because the availability of capital may depend, in part, on ethnic differences in factors such as the use of informal financing (loans or gifts from family, friends, or busi-ness associates) as opposed to formal financing from banks and other financial institutions. We still have much to learn about business access to capital in an ethnic context. To shed some light on these matters, the Federal Reserve Bank of Chicago and researchers from the University of Chicago conducted surveys in two Chicago neighborhoods, Little Village, a nantly Hispanic community, and Chatham, a predomi-nantly Black community. These communities were chosen because they are distinct and well-recognized ethnic neighborhoods with viable small business sec-tors. Although most of the business owners inter-viewed are either Black or Hispanic, other ethnic groups are represented. One of the important features of the surveys is that they shed light on informal and formal sources of financing for both households and businesses.
Small business access to capital is an important policy issue because business owners may face funding limits, known to economists as liquidity con-straints. Although many observers might take funding limits as self evident, studies have shown that liquid-ity constraints affect entrepreneurs both upon start-up and after the business is underway.1 These constraints deter entry into self-employment and force would-be owners to save for longer periods before launching a business. The effects of start-up constraints extend to ongoing businesses, because starting with more capital increases an owners prospects of developing a viable, growing business.2 Thus, entrepreneurs
ultimate success depends, in part, on how successful they are in obtaining adequate capital and credit.
Loan guarantees and other programs offered by the U.S. Small Business Administration are examples of government policies aimed at increasing access to credit for small businesses. Considering access to capital and credit across neighborhoods and across ethnic and racial groups raises other policy issues. Owning a successful business builds personal wealth, and self-employment historically has been an impor-tant means for raising the economic status of some ethnic groups. Promoting the success of small busi-ness is an important part of community economic development strategies, particularly for minority neighborhoods that have suffered from a lack of investment in the past. The purpose of the Community Reinvestment Act is to encourage depository institu-tions to help meet the credit needs of the communities in which they operate, consistent with sound bank-ing practices. While racial discrimination in residential mortgage markets has been the subject of a number of empirical studies, the effect of racial discrimination on access to capital for minority business owners and neighborhoods has received little attention to date from researchers.3
In practice, owners meet the challenge of obtain-ing capital to start and run their businesses by usobtain-ing informal sources, as well as personal assets and loans from formal sources. Thus, informal financing via net-works can substitute for borrowing in the formal sector, either because formal credit is not offered or because informal financing is preferred. Credit offered by a supplier, or trade credit, is another alternative to bor-rowing from financial institutions. Businesses form networks with their suppliers, and there may be an eth-nic dimension to these networks, in that the etheth-nicity of the supplier may matter for some transactions.
The main contribution of this article is to provide information about the use of formal and informal sources of financing. We confirm the importance of personal savings and informal sources of credit in meeting the entrepreneurs need for start-up funding. There are pronounced ethnic differences in the amount of start-up funding used by businesses in the sample. In particular, we find that Black owners start their businesses with significantly less capital than Hispanic owners. This difference persists after controlling for industry types and various measures of human capital (such as the skills, abilities, and training of business owners in the sample). The Black Hispanic gap in total start-up funding is due to differ-ent levels of nonpersonal sources of funding rather than different amounts of personal savings put up by the owner.
Turning to the use of trade credit, our most strik-ing findstrik-ing is that Black owners are much less likely to owe their suppliers than owners in other ethnic groups. This is partly because Black owners are less likely to be offered credit by their suppliers, and be-cause they are less likely to use trade credit if it is offered. Trade credit can be a relatively expensive source of ongoing credit, and it is not clear whether using less trade credit indicates a constraint or a lack of need. However, being offered credit by a supplier, whether or not it is used, is clearly desirable. We find that comparing the ethnicity of owners and their sup-pliers does not explain ethnic differences in the use of trade credit.
If these results hold beyond the Little Village and Chatham neighborhoods, the findings have important implications for understanding ethnic differences in business survival and growth, the decision to become self-employed, and income and wealth accumulation. The importance of informal sources of funding sug-gests that this type of funding has features that meet the needs of small businesses in these communities. Informal funding may be more flexible and better suited to providing relatively modest amounts of capital
than the formal sector. However, an important advan-tage of formal credit institutions is their ability to effi-ciently mobilize large amounts of capital. Recognition of the strengths of both informal and formal sources of financing should be a part of programs and policies aimed at encouraging the flow of capital to small businesses.
In the next section, we briefly discuss some of the theoretical issues involved in understanding the use of formal and informal sources of capital and credit. We hope that data from the Little Village and Chatham studies may better inform the process of building more useful theoretical models of financial intermediation. Measurement of the use and nature of informal networks is particularly important because, as discussed below, the theoretical treatment of infor-mal financing is still in its infancy.
Theoretical overview
Why do individuals borrow or save to go into business?
In a world with perfect information, completely specifiable and enforceable contracts, and no trans-action costs, borrowing, lending, and insurance con-tracts essentially allow a separation of household consumption and saving decisions from occupational choice and investment decisions. That is, a potential business entrant would evaluate present and future profitability, buy options against future contingencies, and convert income streams into a single present value number. That number, when compared with alternatives, will determine for the individual which occupation, technology, or type of enterprise to take up, if any. That number plus existing wealth will deter-mine, in turn, household consumption and saving decisions. These two types of decisions are separate from one another. In practice, however, household consumption/saving decisions and occupation and business investment decisions appear to be related, very much so in the present study.
One branch of existing theory argues that credit contracts for business start-ups and ongoing financ-ing are very much limited. Some researchers, for exam-ple, Bernhardt and Lloyd-Ellis (1993), assume that there are no credit possibilities at all, in which case start-ups and operations are limited to accumulated saving and past profitability and to the entrepreneurs own educational investments and experience. In other cases, such as Evans and Jovanovic (1989), Hart and Moore (1997), and Banarjee and Neumann (1993), acquisition of some credit is possible, but it is limited, for example, to some multiple of accumulated wealth or available collateral, as in the use of personal collat-eral or trade credit backed by the goods supplied.
More recent studies describe in greater detail how credit markets function and the impediments to exchange that limit the amount or type of credit avail-able. Some researchers emphasize moral hazard prob-lems, that repayment of principal and interest in times of stress leaves the household with little or no liquid-ity. Essentially the lender, for example, a bank, takes so much of project returns away from the borrower/ entrepreneur that it is not worthwhile for the borrow-er/entrepreneur to work hard or exercise appropriate diligence. Yet the rational lender can figure all this out and, with ultimate profitability in doubt, will lend even less, if not nothing at all. Those who do manage to borrow, or those relying exclusively on savings, may choose technologies or businesses with lower variance but lower mean returns. For example, see Stiglitz and Weiss (1981), Morduch (1990), and Lehnert, Ligon, and Townsend (1999).
Other recent studies, for example, Kehoe and Levine (1996) and Ligon, Thomas, and Worrall (1997), identify willingness to repay as the potential problem. In this scenario, credit and insurance markets might seem to operate well over the realizations of a broad range of economic and social risk factors. But, ironi-cally, the temptation to renege when a business does well would limit credit overall.
These kinds of obstacles to the smooth operation of credit markets clearly can make a difference in occu-pational choice. Yet the story doesnt stop there. Lim-ited entry can mean that successful entrants accrue unusually large profits. Some will reinvest those profits in their businesses. They were, after all, relatively un-derfinanced in the first place. The economy-wide cap-ital stock will grow. Others may be stuck in low-wage labor markets, sometimes as employees of the suc-cessful small business enterprises. This can be a nontrivial source of economy-wide employment. Thus, we might see growth with increasing inequality, even within ethnically homogenous communities. The level of inequality, the overall rate of growth, and the level of employment are all functions of the nature of the credit markets. In other words, improvements in credit markets could have beneficial implications for growth, employment, and the distribution of income. (See Lehnert, 1998.)
Why does intermediation arise, and how do we distinguish formal intermediaries from informal networks?
It is by no means obvious why institutions arise that specialize in lending and other insurance services. In a world of perfect information, individuals would simply write contracts directly with each other. Theories
of intermediation typically depend on information be-ing available only at a cost: Intermediaries arise either because they minimize the amount of informa-tion producinforma-tion (that is, not all individuals need to do it) or because they have lower costs of intermediation production than other agents. Key papers in this field include Diamond (1984) and Krasa and Villamil (1991). However, these studies force a formal structure on the intermediary by allowing at most one central point of information collection. They do not distin-guish convincingly between a formal structure and an informal network linking individuals (see Bond, 1999), although there are no established theoretical reasons for supposing that when intermediation exists it will take the form of a formal institution. Boyd and Prescott (1986) is an important exception.
Recent work continues to try to remedy that defi-ciency. The idea is to model networks as groups of households or business that have some natural or acquired advantage relative to a formal financial inter-mediary. Some of these models emphasize a priori selection, that is, individual joint liability for loans would screen out bad apples, or individuals choose to link to others from whom they can learn. See, for example, Rai (1996), Becker and Murphy (1994), Ghatak (1998), and Varian (1990). Other models empha-size better internal risk contingencies, better informa-tion on project returns or underlying effort, better internal enforcement of implicit or explicit agreements, or some combination of the three. See Prescott and Townsend (1996), Holmstrom and Milgrom (1990), and Itoh (1991).
We are only beginning to understand from theory how networks might operate, but it seems clear that networks can be important for the welfare of their members. Networks can be important alternatives to more formal and more distant institutions. Another possibility is suggested by theory: Institutions can lend in an evident, measurable way to a handful of individuals, yet as network members, the intermediary and its funds now make their way to the larger com-munity. These theories do suggest the importance of measurement, specifically measurement of the use and nature of networks.
Neighborhood and survey description
Little Village, on the southwest side of Chicago, became a predominantly Hispanic area in the 1970s, due to a substantial inflow of immigrants, mostly of Mexican origin, during the 1960s. As of the 1990 Census, the community had a population of 81,155 and a median family income of $23,259. Chatham, on the citys south side, became a predominantly Black
community during the 1950s (Chicago Fact Book Consortium, 1995). In 1990, Chatham had a population of 36,779 and a median family income of $29,258.
The household and business survey instruments were developed for a multi-ethnic survey that was implemented for the Little Village study and adapted, with very minor modifications, for the Chatham project.4 In both communities, the survey universe was constructed by canvassing and enumerating all identifiable existing businesses. A stratified random sample was then drawn. In Little Village, relatively common businesses (including eating and drinking places, auto repair shops, and hair salons) were drawn at a rate of 35 percent; relatively uncommon business (including bridal shops, bakeries, iron works, and fac-tories) were drawn at a rate of 100 percent; and all other businesses were drawn at a rate of 50 percent. Relatively common businesses in Chatham (including eating places and hair salons) were drawn at a rate of 22.5 percent; and all other businesses were drawn at a rate of 45 percent. In both surveys, medical and legal professionals were excluded from the sample, on the grounds that the educational requirements for these fields result in entrance and financing decisions that have little in common with those of other small businesses. Field staff, bilingual in the case of Little Village, contacted the businesses in the selected samples for an interview that required about one-and-a-half hours. The response rates were 70 percent for Little Village and 57 percent for Chatham. About
one-third of all enumerated businesses were inter-viewed in Little Village and one-quarter in Chatham.5
Business and owner characteristics
Table 1 shows the types of businesses by ethnic group. (Asian owners are primarily Korean, and Other is made up of owners from the Middle East, India, and Pakistan.)6 For example, column 1 of table 1 indicates that 5.3 percent of all the businesses in the sample are in the manufacturing and wholesale category. For all ethnic groups combined, the bulk of the firms fall into some form of retail or service sector. Black owners are relatively concentrated in the service sector. Man-ufacturing firms are more common for White owners than for other groups, and Asians have a marked concentration in other retail. Hispanic firms are rela-tively balanced across industry types, with no single category containing more than 25 percent of the total (although total retail accounts for 68.9 percent of His-panic businesses). Franchises are relatively
uncommon and make up 5.8 percent of the entire sample. The average age of businesses for all groups is about nine years, and firms owned by Blacks (13 years) and Whites (16 years) tend to be older than the firms in the remaining groups. Most firms in these communities employ relatively few workers; the aver-age is 4.5 employees for businesses in all groups. White-owned firms and, to a lesser extent, Black-owned firms tend to employ more workers on average than firms in the other groups.
TABLE 1
Characteristics of businesses in Little Village and Chatham, percent
All Hispanic Black White Asian Other
Manufacturing/wholesale/
constr uction/transpor tation 5.3 6.6 1.8 22.0 2.3 7.9
Retail total 64.3 68.9 49.2 54.2 92.8 89.0
Eating/drinking places 16.8 23.6 11.4 16.6 5.1 20.5
Food stores 11.1 13.3 8.4 3.9 2.6 26.4
Auto ser vice/sales 8.0 11.0 6.0 5.5 2.3 9.9
Other retail 28.4 21.0 23.4 28.2 82.8 32.2
Business/personal ser vices 30.6 24.6 49.1 23.9 4.9 3.1
Franchise 5.8 5.3 6.2 7.7 0.0 13.4
Age of business in years 9.2 6.9 12.6 16.3 4.2 5.8
Number of employees 4.5 3.9 5.1 9.2 2.3 3.6
Obser vations 4 1 6 1 8 3 1 4 8 2 5 3 4 2 5
Notes: These results are weighted to reflect sample stratification. Retail total is the sum of eating/drinking places, food stores, auto service/sales, and other retail. The Other category is made up of owners from the Middle East, India, and Pakistan. Source: Authors’ calculations based on Federal Reserve Bank of Chicago and University of Chicago, 1993–94, Little Village Survey and Federal Reser ve Bank of Chicago and University of Chicago, 1997–98, Chatham Survey.
Table 2 shows selected demographic and human capital variables. The average firm owner for all groups is about 47 years old, with Black and White owners tending to be a bit older than owners in the remaining groups. About one-third of all owners are women; Hispanic and, especially, Black owners are more likely to be women. The majority of business owners are married, 72 percent overall; Black proprietors are somewhat less likely to be married than those in the other groups.
Most business owners are at least high school graduates, and about one-third have a college degree. However, educational attainment varies across racial/ ethnic groups. The proportion of Hispanics in the sample who do not have a high school diploma (42.5 percent) is more than twice as high as the proportion for Blacks (18.1 percent), the group with the next highest figure. Hispanic owners are the least likely to have a college degree (only 18.1 percent have a degree), followed by Black owners (34.9 percent). Hispanic owners (71.2 percent) are less likely to be moderately or extremely proficient in English than the Asian (89.7 percent) and Other groups (91.1 percent). Finally, an appreciable proportion of the entrepreneurs owned a business previously, ranging from 25.7 percent for Blacks to 51.0 percent for Asians.
For comparison, table 3 provides selected figures from the 1992 Characteristics of Business Owners Survey (CBO), a national survey produced by the Bureau of the Census. Of course, when comparing these results, we must keep in mind important differ-ences in survey design. For example, the CBO survey, based on tax returns, includes home-based businesses,
which are not included in the Little Village and Chatham neighborhood surveys. As mentioned earlier, our neighborhood surveys also exclude legal and medical services. Finally, the CBO survey categorizes the data differently. Thus, table 3 reports results for Blacks, Hispanics, Asians and Native Americans, and White males.
A comparison of tables 1, 2, and 3 shows that retail businesses are much more common in the Little Village and Chatham surveys than in the CBO survey. This may well be due to the CBOs inclusion of home-based businesses, which are unlikely to be retail. Franchise businesses are somewhat more common in the neighborhood sample (5.8 percent) than in the CBO sample (3.1 percent). The proportion of owners who are married is slightly higher in the CBO survey (77.7 percent) than in the neighborhood surveys (72.0 percent). Hispanic owners in Little Village have less education than Hispanics in the CBO survey. In Little Village, 42.5 percent of business owners do not have at least a high school diploma, compared with 27.2 percent for the CBO survey; similarly, the proportions for high school and college graduates are lower in the Little Village sample than in the CBO Hispanic sample. We see the opposite pattern for Blacks, with Black owners in Chatham more likely to have a college de-gree or beyond (34.9 percent) than Blacks in the CBO sample (26.7 percent). Finally, owners in each of the ethnic groups in Little Village and Chatham are substan-tially more likely to have previously owned a business than owners in the CBO sample.
TABLE 2
Characteristics of owners in Little Village and Chatham, percent
All Hispanic Black White Asian Other
Average age, years 46.9 42.3 52.5 54.3 45.3 41.4
Female 33.0 31.4 43.1 13.2 21.8 16.8
Married 72.0 81.0 59.3 74.0 80.8 76.4
No high school diploma 26.1 42.5 18.1 8.6 3.3 13.1
High school diploma or
some college 42.9 40.6 47.0 27.1 45.2 42.1
College degree or beyond 32.0 18.8 34.9 70.2 51.5 44.8
Proficient in English 86.5 71.2 100.0 100.0 89.7 91.1
Previously owned business 31.1 32.1 25.7 39.2 51.0 24.0
Obser vations 4 1 6 1 8 3 1 4 8 2 5 3 4 2 5
Note: These results are weighted to reflect sample stratification.
Source: Authors’ calculations based on Federal Reserve Bank of Chicago and University of Chicago, 1993–94, Little Village Survey and Federal Reserve Bank of Chicago and University of Chicago, 1997–98, Chatham Survey.
Ethnic differences in start-up financing
Levels of funding
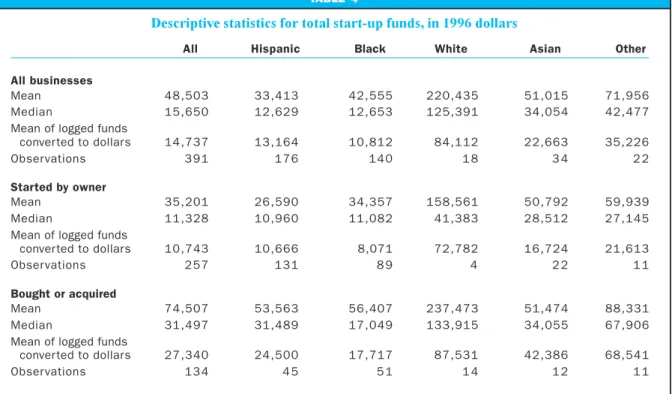
An important result of our research is that His-panic- and especially Black-owned firms have lower levels of total start-up financing than firms owned by individuals in the other racial/ethnic groups.7 Table 4 presents descriptive statistics for total start-up funds. The mean amounts are much higher than the medians, indicating that a few businesses with large amounts of start-up funding are pulling the mean away from the median. Thus, a comparison of mean amounts would put a great deal of weight on a few observa-tions involving large dollar amounts. We avoid this problem by recognizing that start-up funding follows an approximately log-normal distribution. Accordingly, table 4 reports the means of the natural logarithm of start-up costs after conversion to dollar amounts. Comparing the means of logged start-up funds con-verted to dollars, we see that the average start-up funding for our sample was fairly modest at $14,737. Further, the amount of start-up funds varies widely by ethnic group. Hispanics ($13,164) and Blacks ($10,812) start their businesses with lower amounts of funds on average than the remaining groups.8
Table 4 also shows that the distinction between firms started from scratch by the current owner and those that were bought or acquired may be important. The level of start-up funding for owners in all ethnic groups that started their business from scratch is
only $10,743, compared with $27,340 for firms that were bought or acquired. This gap holds for each of the ethnic groups. The ethnic differences noted above also hold. That is, Hispanic- and Black-owned firms have lower levels of funding than the other groups for businesses started from scratch and for businesses bought or acquired. In both cases, Black owners start their businesses with about 25 percent less funding than Hispanic owners.9
These results are incomplete, in that other factors beyond ethnicity may affect the level of start-up funding. For example, a grocery store with a require-ment for an extensive stock of inventory on the shelves will likely require more start-up funding than a firm that provides a service largely based on the human capital embodied in the owner and key employ-ees. The next step is to control for some differences in demographics, human capital, and industry type to see what ethnic differences emerge.10
To account for systematic differences in the required levels of start-up costs across industries, we use a number of industry indicator variables, ranging from manufacturing and wholesaling to ness and personal services. The ease with which busi-ness assets acquired at start-up may be used for collateral may also vary by industry type, which might affect the amount of start-up capital that can be ob-tained. 11 Human capital differences might also account for differences in start-up funding. We would expect
TABLE 3
Characteristics of businesses and owners from the 1992 Characteristics of Business Owners Survey
(percent)
Asian, White
All Hispanic Black Native American male
Manufacturing/wholesale/
constr uction/transpor tation 20.8 23.5 17.8 15.1 26.1
Retail 14.4 14.0 14.0 21.9 11.8
Business/per sonal ser vices 56.4 51.4 60.2 55.8 52.8
Agriculture/unclassified 8.5 11.1 8.0 7.2 9.2
Franchise 3.1 2.8 4.1 4.8 2.9
Married 77.7 75.1 65.8 80.9 80.4
No high school diploma 10.0 27.2 17.8 12.5 9.5
High school diploma or
some college 52.9 50.1 55.7 39.4 51.7
College degree or beyond 37.2 22.7 26.7 47.8 38.6
Previously owned business 23.9 17.9 13.5 28.4 26.7
Notes: Figures for the All category include data for women-owned businesses, which are not reported here. Percentages are calculated excluding non-responses. The survey universe includes entities filing tax reports as sole proprietorships, partnerships, or subchapter S corporations.
that more qualified entrepreneurs, all else being equal, would be able to attract more funding. The personal wealth available to entrepreneurs to start a business would also depend, in part, on their human capital. The variables we use to account for this human capital include education, English proficiency, previous expe-rience owning a business, and age at start-up. We include a variable that measures how long ago the owner started the business to account for the possi-bility that there has been a shift over time in the level of start-up costs.12 Indicator variables for ethnicity and gender capture ethnic and gender differences not due to the industry and human capital variables.
Table 5 reports the ordinary least square (OLS) regression results for logged total start-up costs for firms started from scratch. To illustrate the economic effect of the regression coefficients, we calculate esti-mated levels of start-up funding for each ethnic group using the following baseline characteristics: eating/ drinking place, high school education, proficient in English, no previous experience as an owner, aged 37 years, male, and business started 12 years ago. For example, the estimated start-up cost for a Hispanic owner with these baseline characteristics is $20,414.13 For owners in the other groups, the estimated costs are: $11,104 for Blacks, $54,564 for Whites, $26,921
for Asians, and $30,479 for Others.14 Thus, a Black owner with the baseline characteristics starts a busi-ness with an estimated 46 percent smaller pool of funds than a comparable Hispanic. A White owner with the baseline characteristics starts with 167 per-cent more funding than a comparable Hispanic; an Asian owner starts with 32 percent more; and an owner in the Other category starts with 49 percent more.15 These results show that the raw differences in start-up funding shown in table 4 are still present after accounting for industry type and several mea-sures of human capital. However, table 5 indicates the differences between Hispanics and White, Asian, and Other owners are not statistically significant at con-ventional significance levels.16
The regression results in table 5 also show that women, owners who do not have a high school diplo-ma, and owners who lack proficiency in English have lower start-up funding, whereas those who previous-ly owned a business start the current business with more funds. With regard to the economic importance of these differences, note that the coefficient estimates for all these effects (ranging from 0.57 to 0.70) are roughly comparable to the difference between Hispanic and Black owners. Thus, the differences in the esti-mated dollar amount of start-up costs due to these
TABLE 4
Descriptive statistics for total start-up funds, in 1996 dollars
All Hispanic Black White Asian Other
All businesses
Mean 48,503 33,413 42,555 220,435 51,015 71,956
Median 15,650 12,629 12,653 125,391 34,054 42,477
Mean of logged funds
conver ted to dollars 14,737 13,164 10,812 84,112 22,663 35,226
Obser vations 3 9 1 1 7 6 1 4 0 1 8 3 4 2 2
Started by owner
Mean 35,201 26,590 34,357 158,561 50,792 59,939
Median 11,328 10,960 11,082 41,383 28,512 27,145
Mean of logged funds
conver ted to dollars 10,743 10,666 8,071 72,782 16,724 21,613
Obser vations 2 5 7 1 3 1 8 9 4 2 2 1 1
Bought or acquired
Mean 74,507 53,563 56,407 237,473 51,474 88,331
Median 31,497 31,489 17,049 133,915 34,055 67,906
Mean of logged funds
conver ted to dollars 27,340 24,500 17,717 87,531 42,386 68,541
Obser vations 1 3 4 4 5 5 1 1 4 1 2 1 1
Notes: These results are weighted to reflect sample stratification.
Source: Authors’ calculations based on Federal Reserve Bank of Chicago and University of Chicago, 1993–94, Little Village Survey and Federal Reserve Bank of Chicago and University of Chicago, 1997–98, Chatham Survey.
factors would be roughly comparable to the Hispanic Black difference discussed above.
Table 6 reports the OLS regression results for logged total start-up costs for businesses that were bought or acquired. Again, we use the regression results to illustrate ethnic differences by calculating estimated start-up costs. Here the start-up cost for a Hispanic owner with the same baseline characteristics as above is $23,119. The estimated start-up costs for other owners with the baseline characteristics are as follows: $10,091 for Blacks, $43,792 for Whites, $50,474 for Asians, and $34,168 for Others. Thus, a Black owner with the baseline characteristics starts a busi-ness with an estimated 56 percent lower level of funding
than a comparable Hispanic owner. By comparison, a White owner starts with 89 percent more funding than a compara-ble Hispanic; an Asian owner starts with 118 percent more; and an owner in the Other category starts with 48 percent more. As in the case of businesses started from scratch, for acquired firms the raw dif-ferences in start-up funding shown in table 4 remain after accounting for indus-try type and several measures of human capital. Table 6 shows that the differences between Hispanics and White, Asian, and Other owners are not statistically signifi-cant at conventional significance levels.17 Table 6 also shows that owners with a college degree buy or acquire their businesses with more start-up funding than the baseline owner, which is not the case for businesses started from scratch. Owners who lack proficiency in English begin with less funding.18 Also unlike the results for businesses started from scratch, the results for businesses bought or acquired show no funding disadvan-tage for women.19
To explore the ethnic differences noted above, we look at the sources of up funding used by owners in start-ing their businesses. We group the fund-ing sources listed in the surveys into four categories. Personal savings repre-sent entrepreneurs personal resources; informal funding includes loans, gifts, or equity from family, friends, or busi-ness associates; loans from financial in-stitutions make up the formal financing category; and miscellaneous sources, including trade credit, are included in the other sources category.
We analyze the amount of funding from personal savings in a similar way to the total start-up costs dis-cussed above. That is, we run a regression analysis, including variables for ethnicity, industry types, and various measures of human capital. The results of these regressions, not reported here, show that the difference between personal funding provided by Black and Hispanic owners is small and statistically insignificant both for businesses started from scratch and businesses bought or acquired.20 In addition, the results provide no evidence that Black and Hispanic owners use significantly less personal funding than owners in the other ethnic groups.21 The results of
TABLE 5
Regression results for total start-up funds: Businesses started by owner
Standard Coefficient error Intercept 9.2622 0.6264** Black owner –0.6089 0.2856** White owner 0.9831 0.8929 Asian owner 0.2766 0.4592
Owner in remaining ethnic groups 0.4007 0.5544
All other retail –0.2070 0.3679
Manufacturing/wholesale –0.7959 0.5970
Grocery and other food store 0.5905 0.4356
Auto/gas sales or service –0.4338 0.4963
Business and personal services –0.2052 0.3826
Less than high school degree –0.6377 0.2779**
College degree or beyond –0.0067 0.2749
Proficient in English 0.5738 0.3141*
Previously owned a business 0.5707 0.2347**
Owner’s age at start-up 0.0041 0.0117
Female owner –0.6951 0.2460**
Years since star t-up –0.0055 0.0132
Number of obser vations 2 5 3
R2 0.1697
Adjusted R2 0.1134
**significant at the 5 percent level. *significant at the 10 percent level.
Notes: This table reports ordinary least squares (OLS) regression results for the logged level of total start-up costs. The omitted ethnic category is Hispanic; the omitted industry category is eating/drinking place; and the omitted education category is high school diploma or some college. Thus, the coefficients for the other ethnic groups measure differences in start-up funding relative to Hispanics, the coefficients for the other industry types measure differences relative to eating/drinking places, and the coefficients for the other education levels measure differences relative to a high school diploma or some college.
Source: Authors’ calculations based on Federal Reserve Bank of Chicago and University of Chicago, 1993–94, Little Village Survey and Federal Reserve Bank of Chicago and University of Chicago, 1997–98, Chatham Survey.
similar regressions on the level of start-up funding provided by sources other than personal savings show that Black owners begin their businesses with less nonpersonal funding than Hispanic owners.22 Proportions of funding
To complement the view provided by our analysis of funding levels from each source above, we examine the proportion of total funding from each source. We calculated the proportion of funding from each source for every owner in the sample, then averaged the results. For example, the first entry in table 7 shows that personal savings, on average, are the most impor-tant source of funding64 percent of total funding for all enterprises. There are marked ethnic differences in
the proportional use of personal savings, with Hispanic, Black, and Asian owners tending to depend more on personal savings than White and Other owners. Highlighting the importance of personal savings, 55 percent of Black owners, 51 percent of Hispanic owners, and 45 percent of Asian owners in the sample started their businesses using only sonal savings. By comparison, 36 per-cent of Other owners and 19 perper-cent of White owners depended solely on per-sonal savings.
As reported in table 7, informal financ-ing is the second most important source of funding, at 18.9 percent for all firms. Black and Hispanic owners depend less on informal financing than owners in the other ethnic categories. Formal financing from banks and other formal lenders, at 10.5 percent, is less important for all firms, on average, than personal and informal funding, except for White owners. Formal financing accounts for a relatively high proportion of funding for White and Other owners. The last funding category, other sources, is the least important for all firms at 6.5 percent. Hispanic and Asian owners, for whom formal financing provides the smallest proportion of start-up funding, use other sources more than White and Black owners.
Focusing on Black and Hispanic differences, table 7 shows that Black owners begin their businesses with a somewhat higher proportion of start-up funding from personal resources (69.6 percent) than Hispanic owners (66.0 per-cent). Black-owned businesses begin with a lower proportion of start-up funding from in-formal sources (14.9 percent) than Hispanic-owned businesses (19.0 percent).23 Black owners also start their businesses with a lower proportion of funding from other sources (3.5 percent) than Hispanic own-ers (7.4 percent). However, the average proportion of formal funding for Black-owned businesses (12.1 per-cent) is higher than that of Hispanic-owned businesses (7.2 percent).24
How does this evidence relate to the regression results that Black owners begin their businesses with less funding than Hispanic owners, both for businesses started from scratch and businesses that are bought or acquired? Regression analysis of the funding from
TABLE 6
Regression results for total start-up funds: Businesses bought/acquired by owner
Standard Coefficient error Intercept 8.4491 0.8154** Black owner –0.8290 0.4026** White owner 0.6387 0.5750 Asian owner 0.7808 0.5605
Owner in remaining ethnic groups 0.3906 0.5963
All other retail –0.8675 0.4693*
Manufacturing/wholesale 1.0028 0.6152*
Grocery and other food store 0.5157 0.4872
Auto/gas sales or service 1.0639 0.6125*
Business and personal services 0.3859 0.4521
Less than high school diploma 0.4047 0.3554
College degree or beyond 1.0595 0.3447**
Proficient in English 0.8768 0.4927*
Previously owned a business 0.1239 0.3107
Owner’s age at start-up 0.0088 0.0151
Female owner 0.3719 0.3243
Years since star t-up 0.0329 0.0167*
Number of obser vations 1 3 0
R2 0.3555
Adjusted R2 0.2642
**significant at the 5 percent level. *significant at the 10 percent level.
Notes: This table reports ordinary least squares (OLS) regression results for the logged level of total start-up costs. The omitted ethnic category is Hispanic; the omitted industry category is eating/drinking place; and the omitted education category is high school diploma or some college. Thus, the coefficients for the other ethnic groups measure differences in start-up funding relative to Hispanics, the coefficients for the other industry types measure differences relative to eating/drinking places, and the coefficients for the other education levels measure differences relative to a high school diploma or some college.
Source: Authors’ calculations based on Federal Reserve Bank of Chicago and University of Chicago, 1993–94, Little Village Survey and Federal Reserve Bank of Chicago and University of Chicago, 1997–98, Chatham Survey.
personal savings shows that Black and Hispanic owners use similar amounts of personal savings to start their businesses. This result suggests that we must look elsewhere to explain the gap in start-up funding. Unfortunately, the sample size and the rela-tive infrequency with which the remaining sources of funding (informal, formal, and other sources) are used do not allow us to establish conclusively how each source contributes to the BlackHispanic funding gap. However, some patterns emerge from the average proportions of start-up costs provided by each source of funding, as reported in table 7.
For example, table 7 shows that, on average, Black owners use a higher proportion of formal financ-ing and lower proportions of informal and other sources of funding than Hispanic owners. This evidence sug-gests that less use of funding from informal and other sources plays an important role in accounting for lower levels of start-up funding for Black-owned businesses relative to Hispanic-owned businesses.
Despite the differences in funding between Black and Hispanic businesses, these businesses share some characteristics that differentiate them from oth-er entoth-erprises. For example, as shown in table 4 and by the regression analysis, Black and Hispanic owners start their businesses with less funding than owners in the other ethnic groups. Black and Hispanic owners also depend on personal savings for a higher propor-tion of their start-up funding (table 7) and are more likely to use personal savings as their only source of start-up funding.
Interpreting the start-up results
Evidence from other studies indicates that the amount of financial capital available at start-up is important, because more capital increases an enter-prises chances of survival. To explore whether start-up
funding is important for the businesses in Little Village and Chatham, we compare ongoing performance, measured by annual profit, to the level of start-up capital. Since profit will likely depend on other factors beside start-up capital, we also include variables for ethnic group, industry type, education, and business age in the regression analysis. We include business age as a control because we expect the impact of start-up funding on future profit to vary with time. Our analysis indicates that (depending on the func-tional form) the yearly rate of return on another dollar of start-up capital ranges from 5 percent to 20 percent at the sample means.25 This result suggests that the quantity of start-up capital matters for the future per-formance of the businesses in our sample.
There are a variety of reasons owners in different ethnic groups might begin their businesses with ent levels of funding. Possibly, there are cultural differ-ences in attitudes toward risk, or some groups may lack experience or certain business skills and simply choose to begin small and learn through doing. Never-theless, the evidence suggests that some owners are constrained in the amount of start-up funding that they are able to obtain and are forced to begin their businesses with less than the optimal amount of capi-tal. Ethnic differences in the level of start-up funding could be the result of differences in personal wealth, or they could be due to some groups facing greater funding constraints than others.
Many of the owners in our sample who began their businesses using only personal resources did not feel constrained by a lack of access to other sources of funding. Of those who started with only personal funds, 65.1 percent of Hispanic owners and 52.6 percent of Black owners cited lack of need as the reason that they did not seek loans or other finan-cial assistance. Some owners wanted outside sources
TABLE 7
Average proportion of start-up costs by source of funds, percent
All Hispanic Black White Asian Other
Personal 64.0 66.0 69.6 33.2 60.1 44.2
Informal 18.9 19.0 14.9 26.5 23.4 28.9
Formal 10.5 7.2 12.1 35.4 3.1 18.5
Other sources 6.5 7.4 3.5 4.8 13.4 8.4
Obser vations 3 8 6 1 7 6 1 3 6 1 8 3 3 2 2
Notes: These results are weighted to reflect sample stratification. Numbers in columns may not total to 100 percent due to rounding.
Source: Authors’ calculations based on Federal Reserve Bank of Chicago and University of Chicago, 1993–94, Little Village Survey and Federal Reserve Bank of Chicago and University of Chicago, 1997–98, Chatham Survey.
of funding3.5 percent of Hispanics and 11.8 percent of Blacks actively tried to get financial assistance. The remainder, 31.5 percent of Hispanic owners and 35.6 percent of Black owners, were discouraged from asking for assistance for some reason.
To the extent that funding constraints are impor-tant for some owners in Little Village and Chatham, then start-up costs will depend on an entrepreneurs personal wealth. More wealth allows more personal funding of the business. More wealth also means more collateral for borrowing, so it potentially increases the amount of borrowed funds available at start-up.26 Unfortunately, the survey results do not provide direct evidence of the owners personal wealth at start-up, so we are not able to test directly for the effects of wealth on start-up funding.27 Thus, the observed ethnic differences in the level of start-up funding may be the result of differences in wealth not cap-tured by the human capital variables included in our regressions. Given that the literature shows that Whites tend to have more wealth than Blacks with similar levels of human capital, it is not surprising that our results indicate that White owners begin their businesses with more start-up funding than Black owners. However, differences in wealth between Blacks and other minority groups have not been as much studied. In particular, there is little reason to believe that Hispanics have more personal wealth than Blacks for a given level of human capital.28 Thus, it is doubtful that wealth differences explain our cen-tral finding that Black owners begin their businesses with less start-up funding than Hispanic owners for a given level of human capital.
Although not conclusive, the available evidence suggests that Black owners use less financing from informal sources than Hispanic owners. An interpre-tation of the funding shortfall that is consistent with the evidence presented here is that Black owners, for some reason, have less access to networks that pro-vide informal financing.
Trade credit and other ongoing financing
Once in operation, a business may need ongoing financing to meet working capital needs or to expand. Trade credit is an important source of ongoing credit; according to a national survey, 60.8 percent of small businesses in 1993 had outstanding trade credit and trade credit accounted for 31.3 percent of total debt.29 As shown in table 8, trade credit is widely used by businesses in Little Village and Chatham, with 38.2 percent of the respondents owing money to one or more suppliers.
Whether or not a business uses trade credit de-pends on the supplier as well as the business owner,
because the supplier must be willing to extend credit. Presumably, a supplier would weigh the costs and benefits of extending trade credit to a particular busi-ness rather than demanding cash. There are a number of reasons suppliers may have advantages relative to other lenders in supplying credit to their customers. For example, suppliers may extend credit to attract future orders, especially from growing businesses. Suppliers may also have an advantage in assessing credit risk, monitoring the borrower, or liquidating collateral.30 Table 8 shows that 56.7 percent of the businesses in the sample have at least one supplier who offers credit, indicating that a substantial number of them do not have access to trade credit. A majority (66.6 percent) of the businesses that are offered trade credit make use of it, and owed a supplier at the time of the survey. The median amount owed was $3,176. There are substantial ethnic differences in the use of trade credit. As shown in table 8, the proportion of Black owners who owe a supplier (20.1 percent) is much lower than that of the other ethnic groups, whereas the proportion of Asian owners (66.7 percent) is relatively high. Using the proportion of Hispanic owners owing suppliers (44.4 percent) as a basis for comparison, the HispanicBlack and HispanicAsian differences in the use of trade credit are statistically significant at conventional levels.31
These ethnic differences are due, in part, to dif-ferences in the proportion of owners in the various groups that are offered credit by suppliers. Hispanic (57.6 percent) and, especially, Black owners (44.8 per-cent) are less likely to be offered credit by a supplier than other owners. Again, using the proportion of Hispanic owners who are offered credit as a basis of comparison, the differences between Hispanic owners and the remaining ethnic groups are statistically signif-icant at the 10 percent level.32 Thus, part of the reason Black and Hispanic owners are less likely to owe a supplier than owners in other ethnic groups is that they are less likely to be offered trade credit by a supplier.
Once trade credit is offered, business owners must decide whether to take advantage of it. Table 8 shows that about two-thirds of all the businesses that are offered credit owe a supplier, confirming that trade credit is widely used when available. Among businesses that are offered trade credit, Black-owned enterprises are less likely to owe a supplier (44.9 per-cent) than the other groups. For the other ethnic groups, the range is from 64.3 percent for White owners to 83.6 percent for Asian owners.33 Note that Hispanic owners tend to use trade credit when it is availableat 75.3 percent, Hispanic owners lag only Asian owners.
These findings indicate that the relatively low proportion of Black owners who owe a supplier (20.1 percent) reflects both that they are less likely to be offered trade credit and that they are less likely to take on trade credit when it is available. By contrast, Asian owners have a high propensity to owe a supplier (66.7 percent), because they are often offered credit and they tend to use it when it is offered. Hispanic owners are an intermediate case in that, like Black owners, they are less likely to be offered credit than owners in the other ethnic groups, but they tend to use it when it is offered.
Compared with the widespread use of trade credit, a relatively small proportion of businesses (17.6 per-cent) used other ongoing credit at the time of the sur-vey (see table 8). This proportion is relatively low compared with the use of formal credit in a national sample of small businesses in 1993. Even if we only consider businesses with fewer than two employees from that national sample (to make it more comparable to the neighborhood sample), the results indicate that formal credit is used by 41.9 percent of small busi-nesses.34 Ethnic differences are not that apparent in the prevalence of other ongoing credit, except that Asian owners are more likely than other owners to have creditors other than suppliers.35 Most of the lenders that extend this ongoing credit are part of the formal sector; 69.4 percent of all lenders listed by respondents are financial institutions, primarily com-mercial banks.36 This finding holds in general for busi-nesses in both Little Village and Chatham. However, there are some ethnic differences in the sources of ongoing credit. Credit cards, whether issued to an in-dividual or a business entity, can be used for business purposes. The use of credit cards is more common among Black owners35.4 percent of their lenders are credit card issuerswhereas no credit card issuers are mentioned by Hispanic owners. Loans from indi-viduals, clearly an informal source of funds, are found in Little Village; 16.7 percent of the lenders listed by Hispanic owners are identified as individuals. By con-trast, no individual lenders are identified in Chatham. This finding echoes the evidence that Black owners are less likely to obtain funds from informal sources during start-up than owners in the other ethnic groups.
Interpreting the ongoing credit results
We observe some patterns in these results. Be-cause trade credit can be a relatively expensive source of ongoing credit, high levels of trade credit have been used in the literature as an indicator that firms are constrained from borrowing at the lower interest rates available from financial institutions (Petersen
and Rajan, 1994). Thus, it is not clear whether using less trade credit indicates a constraint or a lack of need. However, being offered credit by a supplier, whether or not it is used, is clearly desirable as a potential source of funds. In addition, an owners attitude toward risk and desire to expand the business may have a bearing on how much ongoing credit is demanded.
A possible explanation for these patterns is that ethnic groups may differ in their access to ethnic net-works formed by businesses and their suppliers. To test this explanation, we look at the ethnic relation-ship between businesses and their suppliers. Since a given business may have up to three suppliers listed on the survey, we look at each combination of business and supplier.37 We find that Asian owners are more likely to deal with suppliers of the same ethnicity; 46.8 percent of their suppliers are also Asians. This proportion is lower for Hispanic (31.5 percent), Black (27.5 percent), and Other (20.5 percent) owners.
This finding might suggest that the relatively high proportion of Asian owners who use trade credit is due to some unique features of an ethnic supply network. For example, involvement in an ethnic net-work may provide superior information on which to base credit decisions, give more incentive for each side to carry out their contractual obligations, or aid in monitoring the credit relationship.
However, looking beyond the ethnic identity of a given supplier undermines this line of reasoning. In general, suppliers of the same ethnicity as the business owner are not substantially more likely to offer trade credit. In addition, minority business owners are not more likely to take up trade credit from a supplier of the same ethnicity than from a supplier of a different ethnicity. Thus, the differences across ethnic groups in the use of trade credit shown in table 8 are not explained by a simple ethnic relationship between the supplier and the business owner. For example, a rela-tively high proportion of Asian owners owe a supplier for two reasons: because they are likely to be offered credit, regardless of the ethnicity of the supplier, and because they are likely to use credit if it is offered, again regardless of the ethnicity of the supplier.
We gain more information about financial con-straints for small businesses from two survey ques-tions dealing with the owners willingness to bear risk to start another business and how they would spend an unexpected windfall. Table 9 shows the aggregated responses to the question, How willing would you be to risk your house and all your posses-sions in borrowing money to start another business? Since we would expect owners nearing retirement age
to be less willing to undertake a new business, the figures apply to owners under 55 years of age. (This will also mute the effect of systematic differences in age across ethnic groups.) This measure of willing-ness to bear risk ranges from 37.9 percent for Asian owners to 69.3 percent for White owners. The propor-tion of Black owners willing to risk all (49.4 percent) is somewhat lower than that of Hispanic owners (60.5 percent).
Table 9 also shows the aggregated responses to a question on how owners (under age 55) would spend a windfall gift of $20,000. Economic theory predicts that if an entrepreneur is financially uncon-strained, an increase in assets will have little effect on the amount of capital invested in the business, because the business is already operating with the optimal amount of capital.38 A business owner who is financially constrained, on the other hand, will use the windfall to increase the capital employed in the business. The proportion of owners who say they would invest the windfall assets in the business
ranges from 38.5 percent for White owners to 78.3 percent for owners in the Other category. The rela-tively high proportion of owners who make this response is consistent with the widespread percep-tion of financial constraints for established business-es.39 Interestingly, Hispanic owners (62.3 percent) are more likely to invest the windfall in a business than Black owners (46.8 percent).
How does this evidence relate to the ethnic differ-ences in the use of trade credit presented in table 8? We would expect that owners who are more willing to risk all on a new business would be more willing to take on additional ongoing credit. If ongoing credit constraints are indicated by investing a windfall in the business, then we would expect more constrained firms to use more trade credit. However, the results are not consistent across ethnic groups.
Relative to Hispanic owners, Black owners are less willing to risk all in a new business and less will-ing to invest a windfall in a new or existwill-ing business.
TABLE 8
Use of trade and other ongoing credit, percent
All Hispanic Black White Asian Other
Owes a supplier—total sample 38.2 44.4 20.1 47.6 66.7 53.8
(393) (176) (135) (24) (32) (25)
A supplier offers credit 56.7 57.6 44.8 74.1 79.8 73.0
(393) (176) (135) (24) (32) (25)
Owes a supplier, credit is offered 66.6 75.3 44.9 64.3 83.6 73.8
(229) (101) (65) (18) (26) (19)
Has credit other than trade credit 17.6 15.5 18.6 16.6 32.7 6.4
(415) (183) (148) (25) (34) (24)
Notes: These results are weighted to reflect sample stratification. Observations are in parentheses. Source: Authors’ calculations based on Federal Reserve Bank of Chicago and University of Chicago, 1993–94, Little Village Survey and Federal Reserve Bank of Chicago and University of Chicago, 1997–98, Chatham Survey.
TABLE 9
Measures of entrepreneurial disposition, percent
All Hispanic Black White Asian Other
Willing to risk all on new business 56.6 60.5 49.4 69.3 37.9 69.6
Would invest windfall in business 57.2 62.3 46.8 38.5 48.3 78.3
Obser vations 3 0 4 1 6 2 7 7 1 3 2 9 2 3
Note: Proportion willing to risk all in new business includes those who answered somewhat or very willing to risk all. The sample was limited to those owners less than 55 years of age.
Source: Authors’ calculations based on Federal Reserve Bank of Chicago and University of Chicago, 1993–94, Little Village Survey and Federal Reserve Bank of Chicago and University of Chicago, 1997–98, Chatham Survey.
These results are consistent with the finding that Black owners use less trade credit. Asian owners, who are generally less likely to be willing to risk all in a new business and to invest a windfall than most of the other ethnic groups, are more likely to use trade credit, which is the opposite of what we would expect. Thus, these indicators of willingness to bear risk and invest a windfall are consistent with the Black Hispanic differences in the use of trade credit, but not consistent with the relatively heavy use of trade credit by Asian owners.
Conclusion
Our results confirm the importance of personal savings and informal sources of credit in meeting the need for start-up funding for small businesses. Credit from financial institutions is little used by small enter-prises in the start-up phase. There are pronounced ethnic differences in the amount of start-up funding used by businesses in our sample. In particular, we find that Black owners start their businesses with sig-nificantly less capital than Hispanic owners. After ad-justing for industry type and some demographic and human capital variables, we estimate that a Black owner uses about one-half of the start-up capital obtained by a comparable Hispanic owner. When we look at the sources of funding, we find that the
BlackHispanic gap in total start-up funding is due more to differences in the use of informal sources of funding than in the amount of personal savings put up by the owner. We also find that Black owners are much less likely to owe their suppliers than owners in the other ethnic groups. The evidence indicates that Black owners are somewhat less likely to be offered credit by suppliers and that they are much less likely to use trade credit if it is offered. This result can not be explained by comparing the ethnicity of owners and their suppliers.
The importance of informal sources of funding suggests that it is worth exploring ways to combine the presumed flexibility and informational advantages of informal networks with the formal sectors ability to mobilize capital. Community development financial institutions and micro-lending pools are examples of institutions that, in some ways, combine the strengths of formal and informal sources of capital.
The ethnic differences in the amount of capital used and the sources of capital illustrate the importance of learning more about how formal and informal capi-tal and credit markets work with regard to ethnic net-works and ethnic neighborhoods. These results have important implications for ethnic differences in business survival and growth, the decision to become self-employed, and income and wealth accumulation.40 NOTES
1Empirical tests of the presence of liquidity constraints can be found in Evans and Jovanovic (1989) and Holtz-Eakin, Joulfa-ian, and Rosen (1994a,b). Note that liquidity constraints were found for White males and higher-income individuals in these studies. Presumably, constraints would be even more evident for minority groups.
2Evidence for a positive relationship between start-up capital and survival and growth can be found in Brüderl and Preisendörfer (1998) for a sample of German businesses and Bates (1990, 1991) for a sample of Black and White owners in 1982. 3Cavalluzzo and Cavalluzzo (1998) examine a national sample of small businesses and find that minorities fare worse than Whites in some respects. See Munnell et al. (1996) for an influ-ential study of discrimination in mortgage markets.
4See Bond and Townsend (1996), Raijman (1996), and Tienda and Raijman (1996) for a description and some findings from the Little Village Surveys for households and businesses. 5The survey fieldwork was conducted during 199394 in Little Village and 199798 in Chatham.
6White, Asian, and Other owners are represented in both Little Village and Chatham, but Black owners are almost exclusively located in Chatham and Hispanic owners in Little Village.
7It is important to note that all the results presented here are conditioned on the survival of businesses to the survey date. 8The average start-up costs for firms owned by Whites, Asians, and Others are statistically different from Hispanic firms at the 10 percent level of significance or less (based on a t-test). 9The significance level for the t-test of the difference in means between Hispanic- and Black-owned firms started from scratch is 26 percent; the corresponding figure for bought or acquired firms is 32 percent.
10Preliminary regression analysis established that splitting the sample according to how the business was started results in eco-nomically and statistically significant differences in coefficient estimates. Thus, we report regression results for the split sample. 11This would be the case if some industries require start-up costs that are lumpy in the sense of not being completely adjustable. An example would be a manufacturing process that requires a particular piece of equipment to be economically viable. 12Some sample selection issues are raised by the fact that the sample includes firms that by definition have survived to the survey date. Another reason to include a trend term is as a crude way of accounting for the possibility that older firms survive because they begin with more start-up financing. A variable capturing the state of the business cycle at start-up was found to be without value in preliminary regressions.
13The logged value of the estimated start-up costs (9.92398) is calculated as follows: Estimated costs = Intercept + Proficient in English coefficient + Owners age coefficient × 37 years + Years since start-up coefficient × 12 years. The values for owners age and years since start-up are sample means. 14For example, the logged value of start-up costs for a Black owner (9.315061) is calculated by adding the Black coefficient (0.608927) to the baseline logged value (9.92398). This value converted to dollars equals $11,104.
15It is possible that the ethnic differences noted here partly re-flect location or neighborhood differences. We are not able to test this directly for Black and Hispanic owners because they are not represented in both neighborhoods. The results of a re-gression analysis for White, Asian, and Other owners (who are represented in both neighborhoods) indicate that the location effect is economically small and statistically insignificant. 16The differences between Blacks and all other ethnic groups are statistically significant at the 10 percent level, or less. 17The differences between Blacks and all other ethnic groups are statistically significant at the 10 percent level, or less. 18The differences in start-up funding implied by the coefficients for college degree and proficiency in English are somewhat larger than the difference between Black and Hispanic owners discussed above.
19The coefficient for female is positive but not statistically significant at the usual confidence levels.
20We do not use an OLS regression because a number of busi-nesses report using no start-up funding from personal savings, thus piling up observations on the lower bound of zero. We use a tobit estimation to take this into account. See Greene (1997, pp. 962974).
21In fact, these regressions provide evidence that owners in the White and Other categories use less start-up funding from per-sonal resources than Black and Hispanic owners.
22Although the ethnic differences in nonpersonal funding tend to be economically large, they generally are not statistically significant because of high standard errors, probably due to the relatively small number of observations.
23Data from the 1982 Characteristics of Business Owners Survey confirm that these general findings apply to a national sample of businesses. Asian owners were more likely to have obtained loans or equity from friends and family than Black and Hispanic owners, and, in turn, Hispanics obtained more than Blacks. See Bates (1989) and Fratoe (1988).
24Comparison of the means of the logged amounts of start-up funding for the various sources of funding provides the same picture as the mean proportions discussed here. The means of logged funding from informal and other sources are higher for Hispanic-owned businesses than for Black-owned businesses, and the means of logged funding from personal and formal sources are higher for Black owners. Splitting the sample into businesses that were started from scratch and those that were bought or ac-quired does not affect the general results presented here. 25We use a tobit regression because profit is not reported for businesses in Little Village that lost money the previous year, resulting in censored observations. The coefficient for start-up funding is statistically significant for the specification in
levels but not for the semi-log and log-log versions. The results are only suggestive in that we do not account for the selection effects of having only ongoing firms in our sample.
26The assumption that the borrowing constraint depends on personal assets can be found in standard models of entrepre-neurial choice, such as Evans and Jovanovic (1989) and Holtz-Eakin, Joulfaian, and Rosen (1994a). Avery, Bostic, and Samolyk (1998) find that personal collateral and guarantees are widely used as backing for small business loans. However, they find no consistent relationship between wealth and the use of these personal commitments.
27Education and other human capital variables plausibly capture differences in permanent income. However, Blau and Graham (1990), Smith (1995), and Menchik and Jianakoplos (1997) provide evidence indicating that income and demographic vari-ables do not fully explain BlackWhite differences in wealth. 28Smith (1995) reports that the coefficients for Black and Hispanic indicator variables in mean and median wealth regres-sions are quite similar, indicating that relative to White house-holds, Black and Hispanic households have similar levels of wealth conditioned on the variables included in the regression. These results are based on the Health and Retirement Study and so reflect the experience of older households.
29The figures come from the 1993 National Survey of Small Business Finance, which defines small businesses as those with fewer than 500 employees. See Cole and Wolken (1995, table A.2) and Berger and Udell (1998, table 1) for the cited figures on the use of trade credit.
30See Petersen and Rajan (1996) and Mian and Smith (1992) for discussions of the theory and practice of managing trade credit.
31The statistical significance is based on a logit regression using the ethnic variables. The ethnic differences noted here remain after controlling for a number of factors that might matter for the use of trade credit. We test this using a logit regression, in-cluding the ethnic variables, industry types, and human capital and demographic variables used in the regressions on total start-up costs reported above. In addition, we include the age of the business (logged) and the number of employees (logged) to account for some of the differences among the ongoing businesses. A tobit regression of the log of the dollar amount of trade credit shows that Black owners owe significantly less taking these variables into account.
32After controlling for industry types, human capital and demo-graphic variables, and business characteristics in a logit regres-sion using Hispanic owners as the reference group, only the HispanicAsian ethnic difference is statistically significant. If Black owners are the reference group, Black owners are statis-tically significantly less likely to be offered credit than Asian and Other owners.
33The ethnic differences between Black owners and owners in the other ethnic categories reported here are statistically sig-nificant, with the exception of the difference between Black and White owners. This result also holds after controlling for industry types, human capital variables, and business charac-teristics.
34Figures from the 1993 National Survey of Small Business Finances (Cole and Wolken, 1995). The cited figure does not include credit card debt.