Financial Sustainability of Microfinance Institutions (MFIs) in Ethiopia
Bayeh Asnakew Kinde
Lecturer, College of Business and Economics, Haramaya University, P.O. Box 324, Dire Dawa, Ethiopia *E-mail: basnakew@yahoo.com
Abstract
The microfinance paradigms focus on reduction of poverty through improving access to finance and financial services. However, the positive impacts of microfinance institutions on the welfare of the poor can only be sustained if the institutions can achieve a good financial performance. The purpose of this study, therefore, aimed at identifying factors affecting financial sustainability of MFIs in Ethiopia. The study followed a quantitative research approach using a balanced panel data set of 126 observations from 14 MFIs over the period 2002-2010. The study found that microfinance breadth of outreach, depth of outreach, dependency ratio and cost per borrower affect the financial sustainability of microfinance institutions in Ethiopia. However, the microfinance capital structure and staff productivity have insignificant impact on financial sustainability of MFIs in Ethiopia for the study periods.
Key words: Ethiopian microfinance institutions, financial sustainability, outreach
1. Introduction
Microfinance institutions have evolved since the late 1990s as an economic development tool intended to benefit low-income people. Ledgerwood (1999) points out that the goals of microfinance institutions as development organizations are to service the financial needs of unserved or underserved markets as a means of meeting development objectives such as to create employment, reduce poverty, help existing business grow or diversify their activities, empower women or other disadvantaged population groups, and encourage the development of new business. In short, microfinance institutions have been expected to reduce poverty, which is considered as the most important development objective (World Bank, 2000). However, the positive impacts of microfinance institutions on the socio-economic welfare of the poor can only be sustained if the institutions can achieve a good financial and outreach performance. Throughout the world, financial sustainability of microfinance institutions has been one of the issues that has recently captured the attention of many researchers due to its importance in the livelihood of microfinance institutions. The financial sustainability of microfinance institutions is a necessary condition for institutional sustainability (Hollis & Sweetman, 1998). As it has been argued “unsustainable MFIs might help the poor now, but they will not help the poor in the future because the MFIs will be gone” (Schreiner, 2000, p. 425). Moreover, it has been reported that it may better not have MFIs than having unsustainable ones (Ganka, 2010). This shows how indispensable the sustainability of MFIs is, and studying factors that affect sustainability of MFIs and how MFIs can become financially sustainable becomes imperative. Hence, this study is designed to determine the factors affecting the financial sustainability of MFIs in Ethiopia where the level of poverty is wide and deep.
Provided the incidence of poverty, financing is seen as crucial in achieving the poverty reduction goal. As Ganka (2010) states the microfinance paradigms focus on reduction of income poverty through improving access to finance and financial services. However, an enduring problem facing microfinance institutions is how to attain financial sustainability (Dunford, 2003). This problem has attracted the attention of numerous researchers in recent decades, and as a result many strategies have been put in place to ensure that MFIs are sustainable as Randhawa and Gallardo (2003) states; the same is true in Ethiopia, but it is questionable that they will be able to sustain their operation without continued donor supported for funding and technical assistance. Thus, means should be researched to make these MFIs sustainable and hence ensure sustainable provision of microfinance services and sustainable poverty reduction. The first step, therefore, in doing this is to understand the factors affecting their financial sustainability.
Several studies have also been conducted, as well, to determine factors affecting the financial sustainability of MFIs using large and well developed MFIs in various countries. The level of significant of these factors in affecting the financial sustainability of MFIs, however, varies with studies. Some of the determinants are found to be significant in one economy or applicable to a set of MFIs, some are not significant (Cull et al., 2007 & Christen et al., 1995). Moreover, no such study has been conducted empirically in Ethiopia exclusively focused on factors affecting financial sustainability. Even if they report the result of some performance measures, they did even without doing statistical test of significance. This study, therefore, investigates empirically the factors affecting the financial sustainability of MFIs in Ethiopia over the period 2002-2010, and gets started to fill this knowledge gap after having the various statistical manipulations. The next sub-section
looks at review of literature on the subject. Section three presents the research methodology. Discussion of the results is included in section four. Finally, section five gives the conclusions.
2. Review of Literature
This section discusses the literature concerning the financial sustainability of microfinance institutions in Ethiopia. This review of literature establishes framework for the study and highlights the previous studies, which in turn, helps in clearly identifying the gap in the literature.
2.1. The Concept of Microfinance
The definitions of microfinance institutions proposed by some scholars and organizations are seemingly different from one another. However, the essence of the definitions is usually the same. Microfinance is the provision of small scale financial services to low income or unbanked people (Hartarska, 2005). It is about provision of “a broad range of financial services such as deposits, loans, payment services, money transfers and insurance to the poor and low income households and their farm or non-farm micro-enterprises” (Mwenda and Muuka, 2004, p.145). Similarly, the Asian Development Bank (ADB) defines microfinance as the provision of a broad range of financial services such as deposits, loans, payment services, money transfers, and insurance to poor and low-income households and their micro-enterprises (ADB, 2000).
In practice, in addition to financial intermediation, some microfinance institutions provide social intermediation services such as group formation, development of self confidence, and training in financial literacy and management capabilities among members of a group intended to benefit low-income women and men (Ledgerwood, 1999). This means that the skills and confidence of low-income people have to be developed in addition to giving them access to credit provision. Therefore, the microfinance approach is not a minimalist approach offering only financial intermediation but an integrated approach offering both financial intermediation and the other services mentioned above (Ledgerwood, 1999).
Microfinance institutions are considered as a tool for poverty alleviation through improving access to finance and financial services. According to Basu et al. (2004) MFIs complement effectively the formal banking sector in providing financial services to the poor. The rationale of improving finance comes from the premise that empowerment of the poor through creating income generating capacity enables the poor to access all development requirements to get out of multifaceted dimensions of poverty and reduce their vulnerability to unexpected events (Davis et al., 2004).
However, studies (e.g. Ahlin and Jiang, 2008) suggest that these benefits of microfinance can only be realized as long as the poor continue to be clients of microfinance institutions. Thus, it is suggested that microfinance institutions should consider further enabling the average borrower to graduate from the continual dependence on them to enhance long run development. This will make MFIs as the weapon to eradicate poverty.
2.2. Financial Sustainability of Microfinance Institutions
Financial sustainability of microfinance institutions is probably the key dimension of microfinance sustainability. It refers to the ability of MFIs to cover all its costs from its own generated income from operations (Thapa et al., 1992) without depending on external support or subsidy. Dunford (2003) also defines financial sustainability as the ability to keep on going towards microfinance objective without continued donor support. These definitions center on one point, that is, the ability to depend on self-operation. The definitions also imply the possibility of making profit out of the microfinance operations.
Financial sustainability can be measured in two stages namely operational sustainability and financial self-sufficiency. According to Meyer (2002) operational sustainability refers to the ability of the MFI to cover its operational costs from its operating income regardless of whether it is subsidized or not. On the other hand, MFIs are financially self- sufficient when they are able to cover from their own generated income, both operating and financing costs and other form of subsidy valued at market prices.
The above definitions of financial sustainability imply that a loss making MFI (MFI with poor financial performance) will not be classified as financially sustainable. Again a profit making MFI, whose profitability is determined after covering some of the operating costs by subsidized resources or funds, will also not be considered as financially sustainable.
2.3. Subsidy and Sustainability
Subsidy is a crucial factor in analyzing sustainability of microfinance in general and MFIs in particular. Majority of microfinance programs in the world are subsidized in different ways; sustainability of the programs poses a question in the
mind of academics and researchers. Even front line institution like Grameen Bank of Bangladesh may experience a high repayment rate, but also depends on subsidies due to higher value towards social sector (Morduch, 2000).
A study by Peter (2007) shows a negative relationship between the financial sustainability of an institution and the level of subsidies received each quarter. As the level of subsidy income rises, the respective institution’s financial sustainability falls. Many have argued that subsidies help microfinance institutions reach the needed operational size. However, as discussed in many previous studies, these institutions may actually be doing less good as they receive more assistance. Besides, institutions with more subsidy income have higher level of loans outstanding that is greater scale. This result may reflect the crowding out effect described above - an increasing amount of grants and other subsidies are being directed to microfinance institutions that have already achieved a level of operations needed for their own continued success. Likewise, Kereta (2007) found that there is a negative relationship between dependency ratio and financial sustainability, and he further explains as reduction in dependency ratio (as dependency ratio measured by the ratio of donated equity to total capital) decline over the years in the MFI industry is an indication that MFIs can be self-sustainable, profitable, and meet their social missions and letting the industry to be financial self-sufficient.
2.4. Breadth of Outreach
The breadth of outreach refers to the number of poor served by a microfinance institution (Hishigsurem, 2004). Various studies have used the number of borrowers as a measure of microfinance breadth of outreach (Ganka, 2010; Mersland and Strom, 2009; Harmes et al., 2008). It is generally assumed that the larger the number of borrowers the better the outreach. According to LOGOTRI (2006) larger number of borrowers found to be the biggest sustainability factor, on the contrary, Ganka (2010) on Tanzanian microfinance institutions reports negative and significant relationship between breadth of outreach and financial sustainability. Ganka concludes on the result that increased in number of borrower itself does not improve financial sustainability of microfinance institutions. The reason could be increased inefficiency as a result of increased number of borrowers. However, Hartarska (2005) reports that number of borrowers had no significant impact on financial sustainability.
2.5. Depth of Outreach
Hulme and Musley (1996) assert that without the poor the supposed MFI is no longer different from a bank. Their argument is that outreach should not be measured by just total number of clients but it should rather be based on the number of poor clients. Besides, according to Ledgerwood (1999) the number of borrowers or clients as a measure of outreach considers only the total number of clients served from various products of MFIs without their relative level of poverty. Thus, average loan size has been used as a proxy measure of depth of outreach using relative level of poverty. Smaller loans indicate poorer customers (Mersland and Strom, 2009; Cull et al., 2007). However, they argue that average loan size does not consider the relative number of the poorest with small loan sizes. Moreover, the majority of microfinance clients may be average poor or non poor whose loan sizes are relatively large and, therefore, could easily influence the computed average loan size figure.
According to Woller and Schreiner (2002) the relationship between depth of outreach and financial self-sustainability is multidimensional. In their study they found that depth of outreach has a positive relationship with financial self-sustainability. Woller and Schreiners’ finding put evidence against a wide spread belief that small loans are highly risky and associated with lower financial sustainability. Moreover, Cull et al., (2007) indicates that institutions that make small loans are not less profitable compared to those making bigger loans, and the study by Paxton (2003) confirms that there is a negative correlation between depth of outreach and subsidy dependency index. This exhibits that there is a positive relationship between profitability and depth of outreach. Contrary to the above, Hulme and Musley (1996) state that delivering small loans to the poor and the relatively hard-to-reach clientele is inherently costly.
2.6. MFIs Capital Structure
The combination of various sources of capital could affect profitability and, therefore, sustainability of microfinance institutions. The various sources includes loans, savings, deposits and shares (Woller and Schreiner, 2002). Several studies have been conducted to explain whether the capital structure determines the sustainability of microfinance institutions. For instance, Kyereboah (2007) found that highly leveraged microfinance institutions have higher ability to deal with moral hazards and adverse selection than their counterparts with lower leverage ratios. Moreover, Ganka (2010) states that although how the capital has been structured affects the financial sustainability, having different sources of capital do not improve financial sustainability. Ganka also identified that equity is a relatively cheaper source of financing and, therefore, improves financial sustainability.
2.7. Efficiency
The efficiency refers to the ability to produce maximum output at a given level of input, and it is the most effective way of delivering small loans to the very poor in microfinance context (Woller, 2000). This involves cost minimization and income maximization at a given level of operation, and it has an enduring impact on financial sustainability of microfinance institutions. Thus, efficiency can be measured by its productivity (for instance, number of borrowers per staff) and cost management (for instance, cost per borrower) dimensions.
A study by Woller (2000) on financial viability of village banking to reassess the past performance and future prospects of village banking indicates that the number of borrowers and cost per borrower were found to be among the variables most highly correlated with financial sustainability. Later Woller and Schreiner (2002) examined the determinants of financial sustainability and it was found that productivity was significant determinant of profitability. Moreover, a recent study by Ganka (2010) on Tanzanian rural microfinance found a negative and strongly statistically significant relationship between number of borrowers per staff and financial sustainability. He justified that microfinance staff for rural MFIs are not efficient as a result they fail to manage borrowers when their number grows causing microfinance institutions’ unsustainability. However, Christen et al. (1995) found no association between productivity and financial sustainability. Besides, Ganka (2010) indicated statistically insignificant relationship between cost per borrower and financial self-sustainability.
3. Data and Methodology
The study examines financial sustainability of microfinance institutions in Ethiopia. The data used for this study is purely secondary taken from the national bank of Ethiopia and MIX Market Inc. website over the period of 2002-2010 as most MFIs do not have organized information before 2002.
There are 16 Ethiopian MFIs in the MIX market website to which the researcher has access to their data although their actual number as per the National Bank of Ethiopia database are nearly 30. From this total, 14 did not have the information for the required period to calculate their financial sustainability. Therefore, the sample size for this study reduced to 16. Normally, this number does not violate the general rule of thumb that for the generalizability, a ratio of number of observations to number of variables should never fall below 5:1. That is five observations are made for each independent variable (Hair et al., 2006). Moreover, Hair et al. (2006) states that although the minimum is 5:1, the desired level is between 15 to 20 observations for each independent variable to be representative.
Applying the general rule of thumb as a desired level (that is between 15:1 and 20:1); this required the number of observations to be between 90 and 120. With nine years data from each MFI, the above required a minimum of 10 study units or microfinance institutions. The planned sample of 16 relatively large; which increases fifty four observations above the minimum requirement.
In this study financial sustainability of MFIs was the dependent variable. But it is difficult to measure financial sustainability of MFIs, as almost all MFIs are subsidized, where some subsidies are in kind form. Kereta (2007) states that operational sustainability examination, as component of financial sustainability measurement, revealed that MFIs as industry are operational sustainable measured by return on asset and return on equity. However, many previous studies have used the MIX market definition of financial sustainability.
To remain consistent with previous studies and see the result in the Ethiopian context and for the meaningful comparison of findings with prior empirical studies in developed and developing countries, measures pertaining to factors affecting financial sustainability were taken from reviewing previous studies. Thus, the MIX market definition to measure financial sustainability was used in this study since data were obtained from the MIX market website with the incomplete information obtained from the national bank of Ethiopia. Thus, financial self-sufficiency (FSS) = Adjusted Revenue / Adjusted Expense. However, Micro Banking Bulletin (MBB) policy makes only small adjustments to revenue, so the adjustments primarily affect the denominator of this indicator. Thus, we have the following approximation:
FSS = Revenue/ (Adjustments + Expenses), while FSS is centered around 1 (Institutions with FSS > 1 are financially self-sufficient.
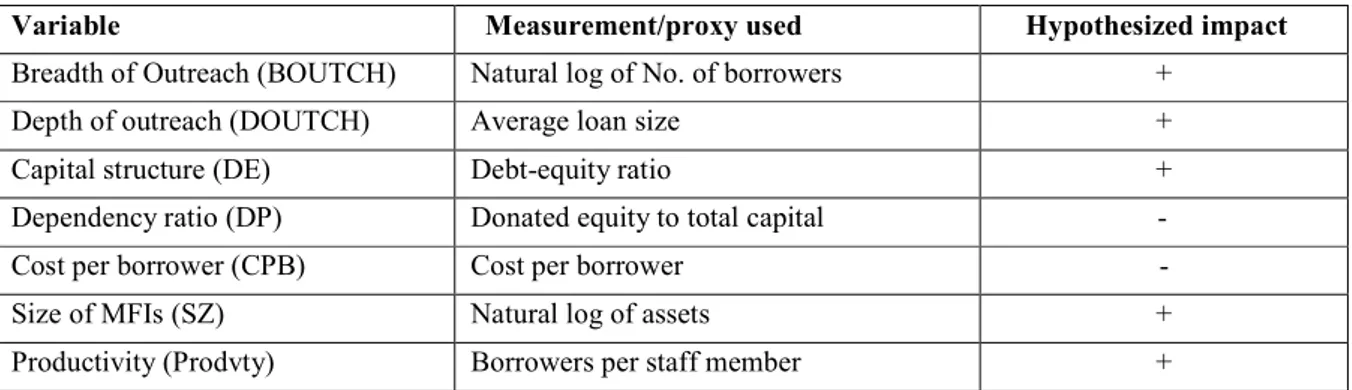
Table 1 also presents the potential factors that influence financial sustainability of MFIs considered in this study with their hypothesized impact.
The nature of data used in this study enables the researcher to use panel data model which is deemed to have advantages over cross section and time series data methodology. It involves the pooling of observations on a cross-section of units over several time periods. A panel data approach is more useful than either cross-section or time-series data alone. As Brook
(2008) states the advantages of using the panel data set; first it can address a broader range of issues and tackle more complex problems. Besides, by combining cross-sectional and time series data, one can increase the number of degrees of freedom, and thus the power of the test. It can also help to mitigate problems of multicollinearity among explanatory variables that may arise if time series are modeled individually. However, the variable size of MFIs was dropped from the regression model due to high multicolliniarity problem existed between size and breadth of outreach with correlation coefficient of around 0.98 (VIF of 16 and 14, respectively). The significance of other independent variables was quite different with magnified R-square when size was included in the regression model.
Given the size of the sample, the study estimated the association between independent and dependant variables by ordinary least square reduced-form equations of the form:
Yit= ơi + β’Xit+ εit
Where Yitis the value of the dependent variable for cross section unit i, at time t, where i = 1… N; ơiisa heterogeneity or individual effect. It contains a constant term and set of individual or group specific variables which may be observed, such as type of MFIs, lending type, MFIs zone or unobserved such as MFIs specific characteristics (like skill of MFI personnel or preference and so on) which are taken to be constant over time. Xit is the explanatory variable with a coefficient β, and εit the error term. Observations are at the MFI level, and do not represent individual borrowers. The dependent variable is always an indicator of financial sustainability and the independent variables are possible determinants of financial sustainability. Therefore, the operational model for the empirical investigation used in this study is given as:
FSSit = β0 + β1(BOUTCHit) + β2(DOUTCHit) + β3(DEit) +β4(DPit) + β5(CPBit) + β6(Prodvtyit)+ έ
Where: FSSit, ratio of total revenue to adjusted expense for firm i in period t; BOUTCHit, log of number of borrowers for firm i in period t; DOUTCHit, average loan size for firm i in period t; DEit, debt to equity for firm i in period t; DPit, donated equity to total capital for firm i in period t; CPBit, cost per borrower for firm i in period t; Prodvtyit, borrowers per staff member for firm i in period t; and έ the error term.
With the above multivariate regression equation, the impact of each of the explanatory variables on financial sustainability estimate was assessed in terms of the statistical significance of the coefficients 'βi'. However, coefficients derived from the multiple regression models may be subject to omitted variables bias. This is when some variables which were not included in the model affect the dependent variable and, therefore, estimating the coefficients without controlling for these variables lead to omitted variables bias (Woodridge, 2006). How the control is done will depend on the nature of the omitted variables. That is whether they are constant or changing over time and whether they are constant or changing over cases. These are also known as the time specific and individual specific effects of unobservable or omitted variables, and the econometrics literature suggests two common methods of dealing omitted variables. These are the fixed effect and random effect (Hsiao, 2007).
In choosing between random effect (RE) and fixed effect (FE) models the study employed the Hausman test which compares the coefficients of two estimators where RE is considered consistent under null hypothesis. Thus, the test result shows that the RE provides consistent estimates compared to FE model. The Hausman test statistic was not significant and therefore, we could not reject the null hypothesis. This indicated that the RE model gives consistent result. The study further checked the appropriateness of using the RE model as opposed to pooled OLS using the Breusch and Pagan multiplier test. The test results indicated that the p-value of the test statistics to be statistically significant which indicated the existence of random effects and this implies that the pooled OLS regression wouldn’t have been appropriate. Thus, the study used the RE model.
4. Empirical Results
This section links the various variables included in the model and financial sustainability in order to identify factors affecting financial sustainability of microfinance institutions in Ethiopia.
4.1. Descriptive Statistics
Table 2 reports the descriptive statistics of the variables included in the analysis of financial sustainability including their mean, standard deviation, minimum and maximum values for the sample of 16 MFIs during the period 2002-2010.
The financial sustainability (FSS) indicates the ability of MFI to cover all of its operating costs and costs of capital without depending on subsidies. As indicated in (table 2) the mean of FSS is 1.184 (118.4%) indicating financial sustainability. The standard deviation for this variable is relatively high (0.492), an indication of the existence of dispersion in the sustainability of microfinance institutions studied. In total, the study included 144 observations out of which 90 (62.5%) indicated sustainable MFIs and the remaining 54 observations (37.5%) of the MFIs were not financially sustainable.
The mean of breadth of outreach (BOUTCH) measured in number of borrowers is 103,510. The average outreach indicates the breadth of providing services to the poor. The MIX bench mark methodology categorized the breadth of outreach as large (> 30, 000 numbers of borrowers), medium (10,000 – 30,000 number of borrowers), and small (< 10,000 number of borrowers). Thus, the breadth of outreach for Ethiopian microfinance institutions is large with the mean of 103,510 borrowers. However, the standard deviation is larger than the mean value indicating that there are MFIs in Ethiopia that have smaller breadth of outreach.
The average loan size indicates the depth of outreach (DOUTCH). The average balances of outstanding loans are proxy indicators used to indicate a client’s socioeconomic level. According to the Micro Banking Bulletin (2008), among reporting African MFIs the weighted average outstanding loan per borrower is USD 307. In absolute terms, these loans are somewhat larger than those offered by MFIs in the regions of East Asia and Pacific, and South Asia but significantly smaller than those offered in the Eastern Europe and LAC regions. However, the mean for this variable is USD 116 which is low end depth of outreach under the MIX bench mark methodology (average loan size <USD 150). The highest average loan size USD 374 is an indication of serving relatively non poor clients. These statistics tend to suggest that MFIs in Ethiopia perform better in the depth of outreach reflected in their lower average loan size than the MIX bench mark. The mean capital structure (DE) is 2.27. This indicates that the predominant debt financing scheme of MFIs in Ethiopia. The proportion of equity is around 33.33% of which around 25% is donated equity (mean DP is 0.2479). Thus, average dependency ratio of microfinance institutions in Ethiopia was around 25% for the study periods.
The cost per borrower (CPB) is to explain the contribution of efficiency in reducing the components of cost per borrower namely, administrative expenses, financial expenses, and staff or personnel related expenses. Efficient institutions minimize costs of delivering services. The efficiencyof MFI can be calculated in various ways; this study analyzes costs per borrower as indicators of efficiency. The mean of cost per borrower in this study is USD 4.96 with the maximum value of USD 58. The average cost per borrower among reporting African MFIs is USD 72, which is higher than MFIs in other global regions (Anne-Lucie et al., 2005). Anne-Lucie et al. (2005) further states that within Africa, East African MFIs are highly efficient in absolute terms because they spend only USD 58 per borrower. In contrast, MFIs in the Indian Ocean region spend the most, at more than USD 240 to maintain each loan. Thus, Ethiopian microfinance institutions are more efficient in terms of cost per borrower. However, there may be some limitations in comparing efficiency of microfinance institutions in different countries as it has been reported that there are country effects like operating and regulatory environments that affect their efficiency (Harmes et al., 2008; Balkenhol, 2007).
Productivity (Prodvty)is a combination of outreach and efficiency; it is often measured in terms of borrowers per staff member and saver per staff member. However, serving a loan client can be more labor intensive and costly than serving a depositor; because it implies a series of interviews and site visits before the loan can be disbursed. Thus, in this study borrower per staff member was used as a measure of productivity. All things being equal, the higher number of borrowers per staff would indicate efficiency of MFI staff, as they comparatively handle more borrowers. The descriptive statistics shows the mean number of borrower per staff for Ethiopian MFIs was 177. The minimum and maximum borrowers per staff were 44 and 388 respectively. Anne-Lucie et al. (2005) found that MFIs in Africa are among the most productivein terms of borrowers (143) per staff member compared with the global averages (139) borrower per staff member. Ethiopian MFIs staffs were more productive even above the African average productivity over the study periods.
The reason for more productivity of MFIs in Ethiopia may be the group lending methodology. Though limited information is available about the methodologies and product description of Ethiopian MFIs, Micro Banking Bulletin 11; however, indicates that more than 85 percent of participating MFIs from Africa offer group loans through solidarity groups or village banks. These lending methodologies imply economies of scale through group transactions.
4.2.
Econometric Results
In this section the study presents the econometric results on factors affecting the financial sustainability of microfinance institutions in Ethiopia.
From the econometric result, the R2 value indicates that the proportion of variance in the dependent variables which can be explained by the independent variables is 58.4%. That is, about 42% of the variations in the dependent variable are not explained by the independent variables included in the model. However, (Cameron, 2009 cited in Ganka, 2010) expresses that for panel data, the R2 above 0.2 is still large enough for reliable conclusions. The results and comments for each of the independent variables are given here below. The econometrics results are given in Table 3.
The number of borrowers which measures the breadth of outreach (BOUTCH) improves the financial sustainability of microfinance institutions. The econometric result for this variable indicates positive relationship between the number of borrowers and MFIs’ financial sustainability. The relationship was highly statistically significant at 1% significant level.
This is due to the fact that increasing number of borrowers will increase the volume of sell; and increasing volume of sell is one means to maximize profitability, and then financial sustainability. Besides, Kereta (2007) confirms that outreach and financial sustainability are complimentary this is because as the number of clients increase MFIs enjoy economies of scale and hence reduce costs which help them to financial sustainable. Contrary to this finding, Ganka (2010) reported a negative relationship between number of borrowers and financial sustainability as inefficiency increases as a result of increased number of borrowers. Moreover, Hulme and Mosely (1996) argue that there is inverse relationship between breadth of outreach and financial sustainability. Here the argument is higher outreach means higher transaction cost in order to get information about creditworthiness of clients and hence make MFI financially unsustainable.
The average loan size also measures the depth of outreach (DOUTCH). The coefficient for the average loan size is positive and statistically significant at 5% significant level. This indicates that microfinance profitability is associated with higher loan sizes since larger loans are associated with higher cost efficiency and, therefore, profitability. The finding substantiates the mission drift where MFIs serves relatively non poor clients. The finding is also in line with Ganka (2010) and Adongo and Stork (2006) that profitability relates selling bigger loans. However, Cull et al., (2007) argue that institutions that make smaller loans are not less profitable on average compared to those making bigger loans, and they incline to a conclusion that profitability and depth of outreach can not be attained simultaneously.
The capital structure (DE) variable here represents the percentage of debt to equity. The result from the econometric analysis indicates the variable has a negative and statistically insignificant impact on financial sustainability. This implies that the combination of various sources of capital of microfinance institutions does not improve their financial sustainability; and thus, the negative coefficient indicates that the more MFI is debt financed compared to other sources of finance, the more they be deficient in their sustainability. In other words, equity financing improves financial sustainability. The reason could be caused by the fact that owners benefit not from debt but rather from loans given to them. This makes equity a relatively cheaper source of finance and, therefore, improves financial sustainability.
Similarly the econometrics result indicates negative and statistically significant at 1% relationship between dependency ratio (DP) and financial sustainability. This demonstrates that donated equity helps microfinance institutions until they reach to a certain point but it does not guarantee their sustainability. Vicki (2008) found causal evidence to support the assertion that the use of donation drives down operational self-sufficiency, and then financial sustainability. This reinforces the view that the long term use of grants may be related to inefficient operations due to lack of competitive pressures associated with attracting market funding. Notably, the results do not indicate that donations are related to greater or more costly outreach. Thus, grants could hinder the development of MFIs into competitive, efficient, and sustainable operations. Vicki (2008) further argues that even development and donor organizations such as the International Finance Corporation realize that only by weaning off donor dependency and adopting a commercial orientation can these MFIs truly attract the capital and savings base they need to scale up their microloan portfolios, increase sustainability, lower lending rates, increase outreach, and start meeting the demand.
The study also measured the effect of cost per borrower (CPB) on the financial sustainability of microfinance institutions in Ethiopia. The result from the analysis indicates that the increase in cost per borrower reduces the financial sustainability of microfinance institutions. This variable has a negative coefficient which was statistically significant at 10% significant level. This result is in line with Ganka (2010) findings. The cost per borrower measures the MFI effectiveness in cost reduction given the number of borrowers they are serving. This implies the role of cost reduction in improving financial sustainability.
Measure of productivity (Prodvty) is computed by dividing active borrowers by the number of loan officers (CGAP, 2003). However, some duties of loan officers overlap with other microfinance staff duties, and thus productivity can be measured by dividing the number of borrowers to staff members. It is called personnel productivity. All things held constant, the higher the number of borrowers per staff would indicate microfinance efficiency in utilizing its staff. Similarly, the econometric result indicated that the number of borrowers per staff was positively related to the financial sustainability but not significant even at 10% significant level. The positive coefficient of this variable indicates that, though the impact was not material, the increase in number of borrowers per staff increase the financial sustainability of MFIs in Ethiopia. This implies that the more the number of borrowers to be served by a staff, the more the financially sustainable the microfinance will be. Although contradicts with the finding of Ganka (2010), the findings in this study is in line with Christen et al. (1995).
5. Conclusion
Based on the empirical evidence from the econometrics analysis, the conclusion would be that breadth of outreach, depth of outreach, dependency ratio and cost per borrower were found to be important variables in determining financial
sustainability of microfinance institutions in Ethiopia. However, no significant association was found between capital structure and financial sustainability of microfinance institutions, and the same is true for staff productivity.
The conclusions made in this study imply that microfinance institutions in Ethiopia should first minimize their dependency on donated capital to be operationally competent in the market, and then financially sustainable. This, however, should be done with caution considering the impact of departure from donation on their sustainability as most microfinance institutions’ fate of existence depend on donated equity or subsidized income, especially from the very beginning of their infant stage. Second, they should increase number of borrowers (breadth of outreach) so that they could increase the volume of sell (loan). However, selling high volume of loan alone may not guarantee financial sustainability. It should be accompanied by effective follow-ups to ensure higher repayment rate and strive to operate at relatively lower operating cost per borrower. Likewise, microfinance institutions should increase the average loan size (depth of outreach) to be sustainable. That is, larger average loan size will improve financial sustainability, however; it increases the level of risk in case of defaults of repayments. Thus, MFIs should make every effort to thump to balance the average loan size. They should also be aware of that, as the econometrics result indicates the profitability and then sustainability of these microfinance institutions had been growing hand in hand with the average loan size, implying less depth of outreach, which indicates the sign of mission drift. Therefore, microfinance institutions in Ethiopia should ensure their profitability growth to go in line with their objectives if the MFIs still have to make their initial mission sustain.
Further Research Directions
Further study may also consider MFIs’ geographical location, growth stages, ownership, age, and MFIs product deliver methodology. Moreover, this study concentrated on only financial sustainability component. Therefore, further study can also examine other dimensions of sustainability (mission sustainability, program sustainability, and human resource sustainability) of MFIs in Ethiopia.
References
Adongo, J. and Stork, C. (2006), “Factors influencing the financial sustainability of selected microfinance institutions in Namibia”, The Namibian Economic Policy Research Unit, Research Report No. 39.
Ahlin,C. and Jiang, N. (2008), “Can micro-credit bring development?”, Journal of Development Economics, vol. 86, pp. 1-21.
Anne-Lucie, L., Jennifer I., Patricia, M. and Matthew, B. (2005), “Overview of the outreach and financial performance of microfinance institutions in Africa”, Microfinance Information Exchange (MIX).
Asian development bank (2000), “Bangladish: rural livelihood project”, [Online] Available: http://www.adb.org/documents/pdf (November 20, 2011).
Balkenhol, B. (2007), “Microfinance and public policy: Outreach, performance and efficiency”, Working paper, Palgrave Macmillan, Geneva.
Basu, A., Blavy, R. and Yulek, M. (2004), “Microfinance in Africa: Experience and lessons from selected African countries”, Working Paper, International Monetary Fund.
Brooks, C. (2008), Introductory Econometrics for Finance, 2nd ed., the ICMA Centre, University of Reading.
CGAP (2003), “Microfinance consensus guidelines: Guiding principles on regulation and supervision of microfinance”, Washington, DC.
Christen, P., Rhyne, E., Vogel, R. and McKean, C.(1995), “Maximizing the outreach of microenterprise finance”, [Online] Available: http://www.microfinancegateway.org/files/150701507/pdf (October 25, 2011).
Cull, R., Demirguc-Kunt, A. and Morduch, J. (2007), “Financial performance and outreach: A global analysis of leading micro banks”, The Economic Journal, vol. 117, pp. 107-133.
Davis, R., Onumah, G. and Butterworth, R. (2004), “Making rural finance work for the poor”, DFID, unpublished mimeo, [Online] Available: http://dfid-agriculture-consultation.nri.org/pdf (November 29, 2011).
Dunford, C. (2003), “The Holy Grail of Microfinance: Helping the poor and sustainable: Microfinance evolution, achievements and challenges”, ITDG, London.
Ganka, D. (2010), “Financial sustainability of rural microfinance institutions in Tanzania”, PhD thesis, University of Greenwich, Australia.
Hair, F., Black, C., Babin, J., Anderson, E. and Tatham, L. (2006), Multivariate data analysis, 6th ed., Pearson education, New Jersey.
Harmes, N., Lensink, R. and Meesters, A. (2008), “Outreach and efficiency of microfinance Institutions”, [Online] Available: SSRN: http://ssrn.com/abstract (October 27, 2011).
Hartarska, V. (2005), “Government and performance of microfinance institutions in Central and Eastern Europe”, World Development, vol. 33, pp. 1627-43.
Hishigsurem, G. (2004), “Evaluating mission drift in microfinance: Lessons for programs with social mission”, Evaluation review, vol. 31, pp. 203-260.
Hollis, A. and Sweetman, A. (1998), “Micro-credit: What can we learn from the past?”, World Development, vol. 26, pp. 1875-91.
Hsiao, C. (2007), Analysis of panel data. 2nd ed., Econometrics society monographs, Cambridge University press, New York.
Hulme, D. and Mosley, P. (1996), Finance against poverty, Routledge London.
Kereta, B. (2007) “Outreach and financial performance analysis of Microfinance Institutions in Ethiopia”, African Economic Conference, Addis Ababa.
Kyereboah, A. (2007), “The impact of capital structure on the performance of microfinance Institutors”, Journal of Risk Finance, vol. 8, pp. 56-71.
Ledgerwood, J. (1999), “Microfinance handbook: An institutional and financial perspective”, the World Bank publications, USA.
LOGOTRI (2006), “Building sustainable microfinance system: A growth of catalyst for the poor”, Local government training and research institute, society for development studies, [Online] Available: http://www.logotri.net (September 10, 2011).
Mersland, R. and Strom, R. (2009), “Performance and governance in microfinance institutions”, Journal of Banking and Finance, vol. 33, pp. 662-9.
Meyer, J. (2002), “Track record of financial institutions in assessing the poor in Asia”, ADB research institute paper, No. 49, [Online] Available: http://www.esocialsciences.com/articles (September 30, 2011).
Micro Banking Bulletin (2008), “The premier source of industry benchmarks”, Microfinance Information Exchange (MIX), issue 15.
MIX (2009), “Microfinance in Ethiopia”, Microfinance Information Exchange (MIX) market, [Online] Available: http://www.mixmarket/mfi/country/Ethiopia ( October 2, 2011).
Morduch, J. (2000), “The microfinance schism”, World Development, vol. 28, pp. 617-29.
Mwenda, K. and Muuka, N. (2004), “Towards best practices for finance institutions engagement in Africa rural areas: selected cases and agenda for action”, International Journal of Social Economics, vol. 31, pp. 143-8.
Paxton, J. (2003),“A poverty outreach index and its application to microfinance”, Economics Bulletin,vol.9, pp.1-10. Peter, C. (2007), “The Success of microfinance: What really sustains this poverty relief effort”, free market forum discussion, School of Business, Nazarene University.
Randhawa, B. and Gallardo, J. (2003), “Microfinance regulation in Tanzania: Implications for development and performance of industry”, working paper, Tanzania.
Schreiner, M. (2000), “Ways donors can help the evolution of sustainable microfinance organizations”, Savings and Development, vol. 24, pp. 423-37.
Thapa, B., Chalmers, J., Taylor, W. and Conroy, J. (1992), “Banking with the poor, report and recommendations prepared by lending Asian banks and non-governmental organizations”, Brisbane, Australia.
Vicki, B. (2008), “Microfinance institutions: Does capital structure matter?”, working paper, Cornell University.
Woller, G. (2000), “Reassessing the financial viability of village banking: Past performance and future prospects”, Micro Banking Bulletin, Microfinance Information Exchange (MIX).
Woller, G. and Schreiner, M. (2002), “Poverty lending, financial self-sufficiency, and the six aspects of outreach”, working paper, Washington, DC, USA.
Wooldridge, M. (2006), Introductory economics: A modern approach, International student edition, Canada. World Bank (2000), “World development report 2000/2001”, Washington, DC, World Bank.
Table 1: Potential Determinants, Measures and Hypothesized Impact
Variable Measurement/proxy used Hypothesized impact
Breadth of Outreach (BOUTCH) Natural log of No. of borrowers +
Depth of outreach (DOUTCH) Average loan size +
Capital structure (DE) Debt-equity ratio +
Dependency ratio (DP) Donated equity to total capital
-Cost per borrower (CPB) Cost per borrower -
Size of MFIs (SZ) Natural log of assets +
Productivity (Prodvty) Borrowers per staff member +
Table 2: Descriptive Statistics for Dependent and Explanatory Variables
Variable Mean SD Minimum Maximum
FSS 1.183756 0.491742 0.073900 2.317900 BOUTCH 103510 163844 661 710576 DOUTCH 116.0179 60.4084 22.0000 374.000 DE 2.2719 6.4263 0.0100 67.1200 DP 0.2479 0.2280 0.0000 0.89643 CPB 14.9553 8.8840 4.0000 58.0000 Prodvty 176.8839 68.1285 44.000 388.00
Table 3: Econometric Results for Determinants of Financial Sustainability
Variable Coefficient t-statistics Prob. BOUTCH 0.121123 3.518883 0.0006*** DOUTCH 0.000606 2.611813 0.0103** DE -0.000304 -0.506642 0.6135 DP -0.825968 -4.566385 0.0000*** CPB -0.004950 -1.796321 0.0754* Prodvty 0.000425 0.454844 0.6502 Adj. R2 = 0.58428; S.E. regression = 0.186080; Prob(F-statistics = 0.0000)