Are Asset Securitization Bonds
different in W.E. vis-à-vis with
the U.S.
Rafael Ferrão
Católica Porto Business School Agosto de 2018
Are Asset Securitization Bonds
different in W.E. vis-à-vis with
the U.S.
Trabalho Final na modalidade de Dissertação apresentado à Universidade Católica Portuguesa
para obtenção do grau de mestre em Finanças
por
Rafael Ferrão
sob orientação de Professor João Pinto
Acknowledgements
Having finished this research study and knowing that it was the last chapter
of my Master’s degree I feel really motivated to continue studying this topic and to increase my knowledge in the financial world.
Since my choice for this topic was with no doubts the first and unique one, not just because of the exciting topic but also because I knew that the teacher who would help in this study was the best, I expected to do a very good job. However, working at a full-time job at the same time I carried out this study was a very demanding and sometimes very difficult task. Therefore, my words of gratitude are to Professor João Pinto. I really want to thank the Professor for all the time spent, his dedication and his constant support and presence for this study to be done.
Finally, I also want to express my gratitude to all of my teachers, Master’s
colleagues and the university for one of the knowledge that I received during this course as well as all the support they gave to improve my learning skills in Finance.
Abstract
The main objective of this empirical analysis is to provide some evidence in the differences in pricing between Asset Securitization bonds such as: Asset Backed Securities (ABS), Mortgage Backed Securities (MBS) and Collateralized Debt Obligations (CDOs) issued in the United States and in the Western European market. Using micro and macroeconomic variables as controls the study pretends to show the effect that the 2008 financial crisis as well as the deal region had in the credit spread of these securities between January 1st, 2000 and
December 31st, 2016. The sample used, contains 66,354 observations, divided in
35,453 ABS, 19,941 MBS, and 10,960 CDOs.
After performing the econometric analysis, it was evident that the 2008 financial crisis increased the value of the spreads especially in the U.S. Moreover, the sovereign debt crisis that occurred in Europe, starting in 2009 with the first Covered Bonds Purchase Programme (CBPP) launched by the ECB led to a reduction of the credit spreads of these securities with a large reduction until 2013 and an increase from 2013 to 2016.
It was also concluded that: (i) a better rating reduces the credit spread for all types of AS bonds; (ii) rated AS bonds have lower spreads than not rated ones; (iii) higher bond maturities reduce the credit spread of the bond; (iv) higher government yields are related to a reduction in the pricing of AS bonds; (v) issuances in the UK turned out to have a higher credit spread. In addition, this research provides robustness checks with issuer parent details and key ratios that helped to confirm the conclusions achieved by the statistical analysis.
Keywords: Asset Securitization Bonds, Asset Backed Securities, Mortgage Debt Securities, Collateralized Debt Obligations, Credit Spread, Financial Crisis
Resumo
O principal objetivo deste estudo empírico é o de fornecer provas entre as diferenças de preço entre “Asset Securitization bonds” (AS bonds) tais como:
“Asset Backed Securities” (ABS), “Mortgage Backed Securities” (MBS) e Collateralized Debt Obligations”(CDOs) emitidas nos Estados Unidos da
América e na Europa Ocidental. Usando variáveis micro e macroeconómicas como variáveis independentes este estudo tem o principal objetivo de mostrar o efeito que a crise financeira de 2008 e a região onde estas obrigações foram emitidas tiveram no preço destas obrigações entre 1 de Janeiro de 2000 e 31 de Dezembro de 2016. A amostra utilizada tem 66,354 observações (tranches emitidas), dividas em 35,453 ABS, 19,941 MBS e 10,906 CDOs.
Depois de feita a análise ecnométrica, foi claro o impacto que a crise financeira de 2008 teve no aumento do preço destas obrigações, com especial relevância nos Estados Unidos. Mais ainda, verificou-se que a crise de dívida soberana que ocorreu na Europa, começando em 2009 com o primeiro programa de compra de obrigações por parte do Banco central Europeu, levou a uma redução do preço destes instrumentos financeiros, nomeadamente até 2013, ano a partir do qual os preços começaram a subir até 2016.
Também se conclui que: (i) um rating melhor traduz-se numa redução do preço para os três tipos de obrigações analisadas neste estudo; (ii) AS bonds com rating têm preços menores do que aquelas sem rating; (iii) obrigações com uma maturidade maior traduz-se numa redução do preço das mesmas; (iv) quanto
maior a “yield” das obrigações do país onde as AS bonds são emitidas, menor é
o preço das AS bonds; (v) emissões de AS bonds no Reino Unido revelam ter um preço maior. Adicionalmente, este estudo fornece uma análise robusta, inserindo algumas características relativas aos bancos que emitiram AS bonds durante o
período de análise, tendo como objetivo confirmar as conclusões atingidas durante a análise estatística.
Palavras-chave: Asset Securitization Bonds, Asset Backed Securities, Mortgage Backed Securities, Collateralized Debt Obligations, Preço das Obrigações, Crise Financeira
Table of
Contents
Acknowledgements ... v
Abstract ... vii
Resumo ... ix
Table of Contents ... xi
List of Figures ... xiii
List of Tables ... xv
Introduction ... 17
1 Literature Review ... 23
1.1 What is asset securitization? ... 23
1.2 Asset securitization structures and securities ... 24
1.2.1 Structures ... 27
1.2.2 Classes of securities ... 28
1.3 Advantages and disadvantages of using asset securitization ... 29
1.3.1 Advantages ... 30
1.3.2 Disadvantages ... 32
1.4 Asset Securitization and the 2007/2008 financial crisis ... 33
1.5 Western European markets versus the US market ... 37
1.6 The pricing determinants of AS bonds ... 39
2 Hypotheses and Sample Selection ... 42
2.1 Hypotheses ... 42 2.2 Sample Selection ... 43 2.2.1 Databases ... 43 2.2.2 Description of variables ... 44 3 Univariate Analysis ... 52 3.1 Market Evolution ... 52
3.2 Credit Spread Analysis ... 58
3.3 Descriptive Statistics ... 64
4 Multivariate Analysis ... 78
4.2 Robustness Checks ... 94
5 Answers to the formulated hypotheses ... 113
6 Conclusion ... 120
Bibliography ... 122
List of Figures
Figure 1.1.: Financial flows in a securitization transaction _________________ 24 Figure 1.2.: Basic securitization process _________________________________ 25 Figure 1.3.: Securitization instruments __________________________________ 29
Figure 3.1.1.: Number of deals per security and region... 53
Figure 3.1.2.: Amount issued in $B by security and region ... 53
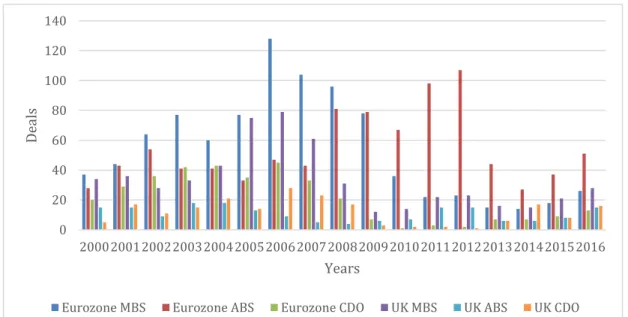
Figure 3.1.3.: Number of deals per security in W.E. ... 54
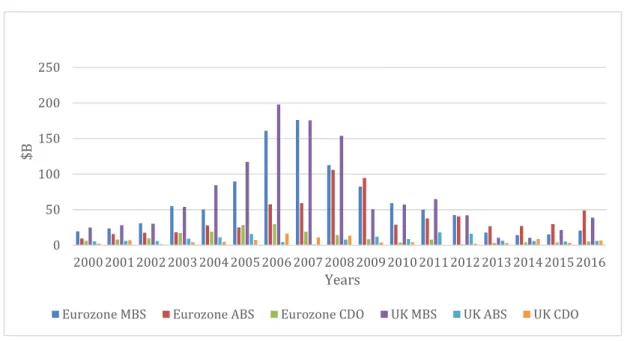
Figure 3.1.4.: Amount issued per security in W.E. in $B ... 55
Figure 3.1.5.: Number of tranches issued by investment grade rating categories per region ... 57
Figure 3.1.6.: Number of tranches issued by investment grade rating categories in W.E. ... 57
Figure 3.2.1.: Average credit spread in bps by region (U.S. and W.E.) ... 59
Figure 3.2.2.: Average credit spread by security from 2000 to 2016... 60
Figure 3.2.3.: Average credit spread in bps by region (U.K. and Eurozone.) ... 61
Figure 3.2.4.: Average credit before and during crisis in the U.S. and W.E. ... 62
Figure 3.2.5.: Average credit spread on the investment grade rating class between the U.S. and W.E. ... 63
List of Tables
Table 3.1.: Number of deals and amount issued in $M per country in W.E. __ 56 Table 3.2.:Tranches’ details in Credit Spread Sample_____________________ 58 Table 3.3 1.: Descriptive Statistics for tranches in the U.S. and W.E. ... 64 Table 3.3.2.: Descriptive Statistics for ABS, MBS, and CDOs in the U.S. and W.E.
... 67
Table 3.3.3.: Descriptive Statistics for ABS, MBS, and CDOs in the U.S. and W.E.
before and crisis ... 71
Table 4.1 1.: Regression analysis on the impact of the independent variables on the credit spread ... 80
Table 4.1 2.: Regression analysis on the impact of the independent variables on
the credit spread for each security type, ABS, MBS, and CDOs ... 86
Table 4.2.1.: Regression analysis on the impact of the independent variables on the adjusted spread ... 95
Table 4.2.2: Regression analysis on the impact of the independent variables on
the adjusted spread for each security type, ABS, MBS, and CDOs ... 101
Table 4.2.3.: Regression analysis on the impact of the independent variables
plus the issuer parent details on the adjusted spread ... 108
Table 7.1.: Rating Scale ... 128 Table 7.2.: Laporta’s Creditor Rights ... 129 Table 7.3.: Regression analysis on the impact of the independent variables on
the credit spread ... 129
Table 7.4.: Regression analysis on the impact of the independent variables on
Introduction
Asset Securitization products were very popular until the 2007-2008 financial
crisis. Indeed, in the “golden age” of financial markets development, that started
in the early 1970s, the securitization process added value to the economy, verifying a fast growth in volumes between 2002 and 2006 (Choudhry and Landuyt, 2009). Afterwards, the use of these structured finance products decreased exponentially because of the important role played by securitization in the 2007-2008 financial crisis, mainly through the issuance of CDOs and other types of synthetic securitization.
The financial crisis that started in the U.S. shortly arrived in Europe and the problem became even worse because of the banking credit, real estate and mortgages markets just collapsed. These markets were pillars of the economy and they directly influenced the bankruptcy of some big investment banks like Lehman Brothers on September 15th, 2008 and financial institutions that received
a bailout, like Northern Rock and Bradford & Bingley (both British banks). After these events, investors completely lost the confidence in the financial markets and the governments had to intervene. It was in that moment that measures implemented after the crisis by governments and central banks in Europe and in the US were completely different. On the one hand, the European Central Bank (ECB) first measure was to decrease the reference interest rates, followed by an increase in the maturity of long term refinancing operations, an increase in the number of assets used as collateral in fixed income deals, and finally the launch of covered bonds purchasing programmes (in total three) in the aftermath of the financial turmoil. On the other hand, the Federal Reserve in the U.S. implemented programmes in order to restore liquidity in the financial institutions, with the purchase of long-term securities aiming to decrease the long-term interest rates.
The tools applied by the FED can be divided into three categories. Firstly, FED approved bilateral currency swap agreements with several foreign central banks to assist these entities in their provision of dollar liquidity. Secondly, FED provisioned liquidity directly to borrowers and investors in the most important financial markets. Thirdly, with the goal of decreasing long-term interest rates, FED started buying MBS in 2012 ($40 billion on average per month), followed by the purchase of longer-term Treasury securities ($45 billion on average per month) in 2013. In October 2014, FED announced the ending of these purchasing programmes.
Europe was affected by the financial crisis in the U.S, due to the large amount of business between the two regions, specially the banking system (the most affected area). However, this was not the only problem that Europe faced after 2008. Actually, just after the financial crisis, Europe faced another big problem, the sovereign debt crisis, which severely affected Greece, Portugal, Italy, and Spain. This happened because after bailing out the banks, the revenues of the governments became lower, the cost of funding increased, the commodities prices also incremented, and the government’s deficit jumped as well. Adding up this sovereign debt crisis with the failure of the banking system in Iceland, determined one of the toughest challenges of the European Union.
In order to restore bank funding, the ECB launched three covered bonds purchase programmes (CBPP) announced in 2009, 20011, and 2014 and one asset backed securities purchase programme (ABSPP), announced in 2014. The objective of these programmes was to promote the ongoing decline on money
market term rates to avoid the potential risk of low inflation. Actually, “CBPP
has led to a very rapid tightening of covered bond spreads in the secondary market and a narrowing of bid-offer spreads” (Beirne, Dalitz, et al., 2011). In addition, it has contributed to:
i) a fall in money market term rates;
ii) better funding conditions for credit institutions and enterprises; iii) incentive banks and other credit lenders to keep and try to
increase their lending amounts to clients;
iv) improve market liquidity in important segments of the private debt securities market.
Surprisingly, the ECB launched an ABS purchase programme (ABSPP), even though knowing that these securities were on the roots of the financial crisis. However, it is important to understand that securitization is an important tool when the aim is to provide short-term liquidity. Therefore, is important to highlight that if each securitized tranche of ABS, MBS or CDOs issuances is correctly priced, securitization starts to be a way of restoring liquidity in the market.
Using a sample of 24,727 asset securitization bonds issued in the U.S. and Western Europe by financial institutions between 2000 and 2016, I cleaned it, and achieved a total of 84,580 tranches within those 24,727 AS bonds issued. Furthermore, the above-mentioned sample of tranches can be split in 42,705 ABS tranches, 26,535 MBS tranches and 15,340 CDOs.
Consequently, the main purpose of this research is to examine the impact of some microeconomic and macroeconomic variables on credit spreads of ABS, MBS, and CDOs.
Securitization is a recent topic. It was introduced in the U.S. in the late 1970s, peaked by volume in the 2007, and felt significantly with the 2007-2008 financial crisis (Choudhry and Landuyt, 2009). It is, namely in Europe, crisis relatively understudied field. Thus, the main intention of this study is to compare the pricing of AS bonds between the U.S. market and W.E. market (Euro zone and the UK) and also in what extent the financial crisis affected the pricing of these operations.
From 2000 to 2016, with special insights from 2008 to 2016, that represents the end of our sample of AS bonds, we intend to understand what impact the ECB policies and the financial crisis had (adding other variables such as credit rating and other controls) on the pricing of this operations.
Considering the previous literature on the pricing characteristics of corporate bonds, this research project intends to contribute to the literature by raising the following questions:
1. How do common pricing characteristics compare between AS bonds in the United States (U.S.) and Western Europe (W.E.)?
2. Is the credit spread on AS bonds in the U.S. higher than the credit spread on AS bonds in W.E.?
3. To what extent are AS bonds issued in the U.S. and W.E. priced by common factors?
4. Are the credit spread and pricing processes of AS bonds significantly affected by the 2007-2008 financial crisis and the subsequent European sovereign debt crisis?
5. What was the impact of the Central Banks’ Quantitative Easing programmes on AS bond credit spreads?
The structure of this work is designed as follows. Next section (section 2) presents the literature review, where the extant theoretical and empirical works about securitization are reviewed. In section 3, the hypotheses to be carried out in this study are presented, as well as the description of the variables chosen to perform the empirical analyses. Section 4 provides a descriptive statistics of AS bonds, a description of the U.S. and W.E. markets as well as a detailed analysis of the credit spread. In section 5, the results of the empirical analyses are presented and discussed and some robustness checks are also presented and discussed. Afterwards, in section 6,the answers to the formulated hypotheses are
presented. Finally, in section 7, the main conclusions are presented, along with some gaps that can be used in future studies about securitization.
1
Literature Review
1.1
What is asset securitization?
Asset securitization is a form of structured finance “… where monetary assets with predictable cash flows are pooled and sold to a specially created third party that has borrowed money to finance the purchase.” [Roever and Fabozzi (2003)]. The financial assets and the respective cash flows, after being pooled together, are converted into negotiable securities to be sold in the market; i.e., it is a technique used to transform illiquid assets into securities [Fabozzi et al. (2006) and Pinto (2014)] and it can be done in two ways.
On the one hand, we have the most used securitization process (funded securitization), in which a bank or a financial institution creates a Special Purpose Vehicle (SPV) or a Special Purpose Entity (SPE), where it allocates its financial assets as well as their respective cash flows, with the purpose of taking out these assets from its balance sheet by selling them to the SPV. The objective with this strategy is to increase liquidity, reduce funding costs and improve risk management.
On the other hand, the synthetic securitization process is also used, and in this case, the sale of assets to the SPV does not happen, since the underlying assets remain on the balance sheet of the originator, and only the risk of that assets is transferred to the SPV, by buying credit default swaps and other derivatives over these assets (Tasca and Zambelli, 2005). Henceforth, according to the fact that in this method of securitization the sale of assets does not take place, the seller does not receive any cash flows and the SPV is not the owner of the pool of assets but, indeed, the entity that supports the credit risk.
According to Pinto (2014), in this form of structured finance, the key element is that the obligation that the issuer has to repay investors is backed by the value of a pool of financial assets or credit support provided by a third party to the transaction.
1.2
Asset securitization structures and securities
In a typical securitization transaction, we have the transfer of assets from the
originator to the SPV, “which then issues securities in the form of debt instruments, to be placed in the market through a private or public offering”
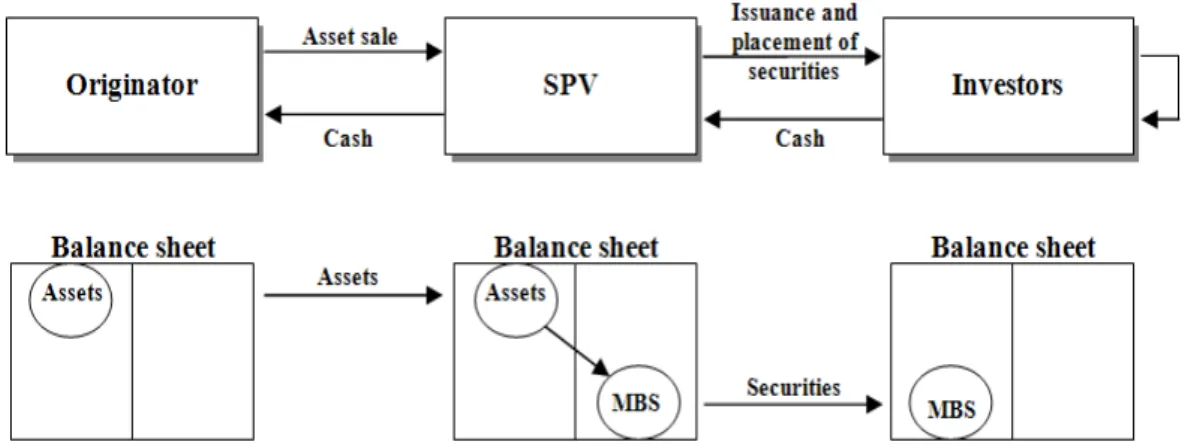
(Joao M. Pinto, 2014). In order to better perceive the securitization transaction process, Figure 1.1 shows a simple diagram with the main asset and cash flow transfer between the parties involved.
Note: Adapted from Roever and Fabozzi (2003), Tasca and Zambelli (2005) and Pinto (2014)
In this figure we can see two essential deals: the asset sale (1) and the issuance of securities (2). To better detail the elementary securitization process, it is actually divided in four distinct steps: the originator sells the assets (loans, mortgages, etc) to the SPV (1); the SPV converts these assets into negotiable securities to be sold in the market (2); these securities have as collateral the assets bought by the SPV to the originator (3); the interests, principal and other cash
flows generated by the assets are used to repay the investors that bought the negotiable securities (4). In addition, the securitization process has to be analysed before the issuance of securities. Thus we have the following steps before the issuance: “assessing the collateral (1); modelling cash flows (2); quantifying risk
factors via stress tests or other techniques (3); and structuring the transaction,
taking into account some factors as the client’s specifications, the type of assets,
the rating agencies’ opinion, the availability of data, and the investor’s interest in
the deal (4)” (Joao M. Pinto, 2014).
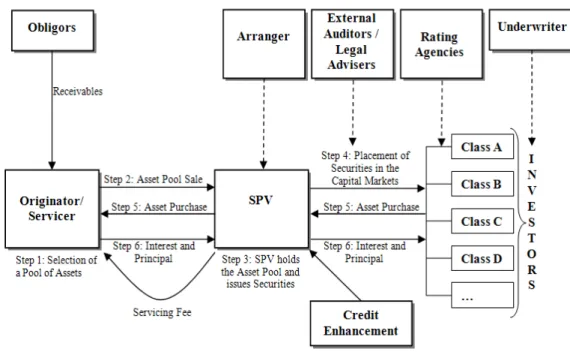
In Figure 1.2, is possible to understand the whole securitization process.
Note: Adapted from Pinto (2014)
Detailing the image, in Step 1: the originator creates a pool of assets in order to start the securitization process; Step 2: the created pool of assets is sold to the SPV (this happens in all types of securitization types except synthetic securitization); Step 3: the SPV is now the owner of the pool of assets and the proceeds obtained from its issued securities guarantee the payment of those assets; Step 4: the securities are branched into tranches according to the rating
and they can start being traded; Step 5: the investors that buy these securities divided into tranches, normally institutional ones, pay to acquire the securities; Step 6: the SPV receives the money paid by issuing the securities and the cash flows are transferred to the issuer as of the initial purchase of the pool of assets (Joao M. Pinto, 2014).
In Step 4, when the securities are structured into different classes, according to its rating, the highest rating for Class A (the most senior class) is explained by the division of assets according to the risk of default of the originator and the employment of credit enhancement strategies. (Joao M. Pinto, 2014)
As an example of a strategy of credit enhancement we have the creation of a credit risk mitigation instruments by subordination of Classes B, C, D…, in which those lower classes provide credit support to class A. Indeed, the entire
transaction is structured to meet specific investor’s needs.
For instance, if the cash flows generated by the assets are not sufficient to remunerate investors, then the mot junior tranches, with low underlying credit ratings, are the first to assume the initial credit losses, protecting the most senior classes of the potential losses, through a subordination credit enhancement mechanism.
To improve credit rating, internal or external credit enhancement mechanisms are needed. Additionally, the amount of necessary enhancement is determined according to each transaction specifications by the credit rating agency. In this case, for rated transactions the amount of enhancement required to perform the transaction is related to the level of the expected losses. For example, triple A tranches will require an enhancement of four/five times the level of expected losses and triple B would just need an enhancement of two times the expected losses. These mechanisms aim to protect the investors against the risk of the collateral not being repaid.
For instance, external credit enhancement mechanisms are provided by third-party guarantees, providing first loss protection against losses up to a certain amount. Examples of external credit mechanisms are: guarantees, letters of credit and bond insurance. On the other hand, we have internal credit enhancement mechanisms such as: subordination; overcollateralization; cash reserves and accounts; excess spread; trigger events; and minimum debt or interest service coverage levels (Joao M. Pinto, 2014).
The goal of these mechanisms, is to help the issuer finding the one that suits it better in order to reduce the cost of funds, or to target specific investors. Thus, it is normal for issuers to change the type of credit enhancement mechanisms from one deal to another according to their willingness. The issuer always faces the trade-off between the cost of enhancement versus the reduction in yield required to sell the securities.
1.2.1
Structures
As mentioned, securitization can be implemented in two ways: (1) a real sale of assets, in which the underlying assets are sold by a financial institution to the SPV via a true sale and by doing this assets are removed from the balance sheet; (2) a synthetic securitization, where the underlying assets remain in the balance sheet of the originator, and only the risk of the underlying assets is transferred to the SPV, by buying credit default swaps and other credit derivatives over these assets (Tasca and Zambelli, 2005). Thus, in this second securitization structure, the originator does not receive any cash flows, because the asset sale does not take place and the SPV is not the owner of the assets, but is the entity carrying the credit risk of those assets.
1.2.2
Classes of securities
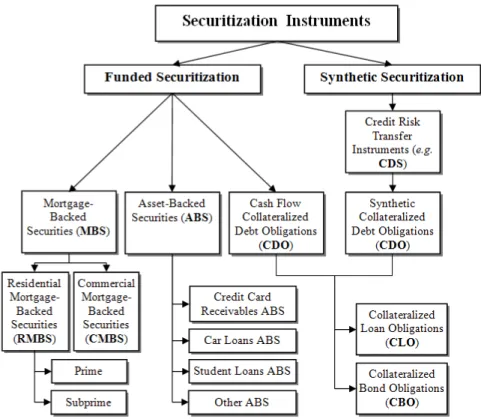
The asset securitization market is divided in three main classes (Blum and Diangelo, 2008; Fabozzi and Choudhry, 2004; Vink and Thibeault, 2008): asset-backed securities (ABS), asset-backed by consumer-asset-backed products; mortgage-backed securities (MBS), mortgage-backed by mortgages; and collateralized debt obligations (CDO), backed by debt obligations.
CDOs are a type of securitization in which a SPV issues bonds or notes backed by debt obligations such investment-grade and high-yield corporate bonds, emerging market bonds, MBS, ABS, bank loans, special-situation loans and distressed debt, and other CDO.
Asset-backed securities are bonds or notes backed by financial assets such as: credit card receivables, auto loans, manufactured-housing contracts and home-equity loans.
Mortgage-backed securities are bonds or notes secured by home and other real estate loans.
In Figure 1.3., it is presented the securitization process divided by securitization instruments.
Note: Adapted from Pinto (2014)
1.3
Advantages and disadvantages of using asset
securitization
To understand the advantages and disadvantages of securitization we have to go back to the Modigliani and Miller (1958) capital structure irrelevance theorem. In this world, securitization would not exist because securitization transactions would not bring advantages over other alternatives, since the funding cost would be the same and investors would have to support higher costs related with the structuring process and credit enhancement mechanisms. If we take as an example a world where perfect and liquid financial markets exist, asymmetric information is not an issue, then the securitization process does not add value
and consequently, the firm’s financing structure is irrelevant. From the above
explanation we can conclude that using securitization is a good strategy to create Figure 1.3.: Securitization instruments
value by reducing the net costs in an economy that has market imperfections as asymmetric information, agency conflicts and market incompleteness. Hence, the use of tranching and off-balance sheet financing makes sense (Joao M. Pinto, 2014).
Moreover, since securitization is done off balance-sheet (with the exception of synthetic securitization) through an SPV, we can have a scenario in which the securities of the SPV are rated investment grade, and the rating of the originator is speculative grade. Simultaneously, since the issuer no more bears the interest rate risk and credit risk associated to the pool of assets, it can reduce its cost of funding.
1.3.1
Advantages
After the conclusion that in a world with market imperfections securitization adds value, it is important to understand why. According to the existing literature, the core reasons for the emergence of securitization transactions are: (i) increasing liquidity and funding (Greenbaum and Thakor, 1987; Hess and Smith, 1988; Jobst, 2005; Krebsz, 2011; Pavel and Phillis., 1987; Roever and Fabozzi, 2003; Sarkisyan, Casu, et al., 2009); (ii) reducing the cost of funding
(Calomiris and Mason, 2004; Davidson, 2003; Fabozzi and Kothari, 2007; Fabozzi, Davis, et al., 2006; Goldberg and Rogers, 1988; Jobst, 2005); (iii) allowing
originators to diversify funding sources (Davidson, 2003; Fabozzi and Kothari, 2007; Jones, 2000; Krebsz, 2011; Roever and Fabozzi, 2003); (iv) improving
originator’s risk – credit, interest rate, and prepayment risks - management (Cumming, 1987; Davidson, 2003; Fabozzi and Kothari, 2007; Goldberg and Rogers, 1988; Hess and Smith, 1988; Jobst, 2005; Rosenthal and Ocampo, 1988); (v) increasing the segmentation between the origination and investment functions (Davidson, 2003); (vi) allowing originators to benefit from regulatory and/or tax arbitrage (Cumming, 1987; Davidson, 2003; Jones, 2000; Krebsz, 2011); and (vii) allowing originators to improve key financial ratios (Fabozzi and
Kothari, 2007; Goldberg and Rogers, 1988; Krebsz, 2011; Roever and Fabozzi, 2003).
However, these motivations can change regarding if we are analyzing the perspective of a bank or a non-bank corporation. As stated by Fabozzi (Fabozzi, Davis, et al., 2006), the principal reasons a non-bank corporation may prefer to issue ABS are: (i) to reduce funding costs; (ii) to diversify funding sources; (iii) and to accelerate earnings for financial reporting purposes. Moreover, Lupica (L. R. Lupica, 1998) also presents the following motivations: (i) improving liquidity; (ii) lowering the effective interest rate; (iii) improving risk management; and (iv) achieving accounting-related advantages.
On the other hand, for a bank corporation, the motivations to use securitization transactions are the following: (i) new sources of funding (Cardone-Riportella, Samaniego-Medina, et al., 2010; Fabozzi, Davis, et al., 2006; Goldberg and Rogers, 1988; Jones, 2000; Loutskina and Strahan, 2009); (ii) risk management and the transfer of credit risk to fund risky financial assets and minimize financial distress costs (Cardone-Riportella, Samaniego-Medina, et al., 2010; Chiesa, 2008; Fabozzi, Davis, et al., 2006; Goldberg and Rogers, 1988; Jobst, 2005); (iii) new profit opportunities, by recognizing accounting gains when the market value of loans exceed their book value (Affinito and Tagliaferri, 2010; DeMarzo, 2005; Flannery, 1989); and (iv) the adjustment of capital ratios (Ambrose, LaCour-Little, et al., 2005; Berger and Udell, 1991; Berger, Herring, et al., 1995; Calomiris and Mason, 2004; Carlstrom and Samolyk, 1995; Fabozzi, Davis, et al., 2006; Jagtiani, Saunders, et al., 1995; Jones, 2000).
Turning now to the benefits of securitization from an investor’s perspective,
Fabozzi (Fabozzi, Davis, et al., 2006) argues that securitization allows investors to diversify sector interest, access different risk reward profiles, and access sectors that are otherwise not open to them. Hence, the key benefit to investors is the ability of securitization to tailor risk-return profiles. This idea is
corroborated by Jobst (Jobst, 2005), who points out that “investors of securitized debt can quickly adjust their investment holdings at low transaction costs in response to a change of personal risk sensitivity market sentiment or
consumption preferences”.
1.3.2
Disadvantages
As any other financial product, securitization also has some disadvantages. Asset securitization transactions are very complex and deal with a very high level of due diligence, negotiation, and legal procedures (Joao M. Pinto, 2014). Henceforth, it is costlier to implement than a normal corporate bond issuance. Cardone Riportella (Cardone-Riportella, Samaniego-Medina, et al., 2010) mention that the disadvantages of securitization include the fixed costs of creating the SPV and the potential reduction in tax benefits, that the originators would have if they kept the assets on the balance sheet and financing them with debt, whereas while setting up a SPV they will lose some tax shields. Similarly, Jobst (Jobst, 2005) states that the structural complexity is the major problem in this type of structured finance. Indeed, the matters that should worry the
originators are: “high accumulation of interest rate risks; the potential for errors
in the rating and pricing of complex security designs; and the shortcomings of
analytical models for assessing risks”.
Another commonly mentioned disadvantage is the fact that the link between the borrower and the bank is disconnected, because the bank creates a SPV/SPE to move the assets from its balance sheet to this entity. When this happens, the bank has an incentive to be less risk conscious. Moreover, aligning this risk careless with the fact that the bank depends on its investors to fund its loans, mostly the commercial paper investors, this could lead to the reduction of the number of investors and consequently the funding amount. Additionally, another shortcoming brought by securitization was the increase of leverage ratios, in some cases 1:40 or even 1:50, which at the minimum failure of some
payments the entities that sold these products would have losses, for example the failure on a payment on a mortgage (Choudhry and Landuyt, 2009). This aligned with the overestimated liquidity of the assets given as collateral to the securitized products (as an example a house as a collateral to a MBS) could result in a collapse of the market.
In general, the literature points out the following problems related to securitization: (i) complexity (Caselli and Gatti, 2005; Davidson, 2003a; Fabozzi, Davis, et al., 2006; Fender, Mitchell, et al., 2005; Jobst, 2005); (ii) off-balance sheet treatment (Fabozzi, Davis, et al., 2006; Rutledge and Raynes, 2010); (iii) asymmetric information (Demyanyk and Van Hemert, 2011; Gorton, Gorton, et al., 2008; Jobst, 2009; Keys, Mukherjee, et al., 2010; Krebsz, 2011; L. Lupica, 2009; Purnanandam, 2011); (iv) agency problems (Demyanyk and Van Hemert, 2011; Fabozzi and Kothari, 2007; Jobst, 2005, 2009; Purnanandam, 2011); and (v) higher transaction costs (Cardone-Riportella, Samaniego-Medina, et al., 2010; Davidson, 2003).
1.4
Asset Securitization and the 2007/2008 financial crisis
Securitization process started in the early 1970s, in the United States, with the sale of pooled mortgage loans guaranteed by government agencies (Moody’s, 2003). The government National Mortgage Association (Ginnie Mae) was established in 1968 after Fannie Mae was privatized. The main objective of this government institution is to enlarge funding for mortgages that are insured by other federal agencies. Indeed, through the use of securitization techniques, when these mortgages are converted into negotiable securities and placed in the market to be sold, Ginnie Mae provides credit guarantee on those securities, creating a less risky product for investors, and increasing the demand for these products. With the guarantee from the government, investors felt more comfortable to invest on issued securities, and this was the main reason why we
noticed the fast growing of the securitization technique until the beginning of 2007, in the U.S.
Actually, after the 9/11 we noticed further growth in the application of this technique, not just as cash securitization transactions, but also synthetic securitization transactions. It had a rapid growth from 2002- 2006, but in 2007 this market languished. In roughly terms what happened was that banks gave credit, namely mortgages, to clients with no jobs and no sources of income; i.e., with a higher credit risk. Subsequently, financial institutions pooled that loans and mortgages together and sold them to a SPV in order to get fast liquidity and funding. The financial institutions did it because to receive the entire money of a mortgage would take 30 years or more, whereas by selling the mortgage to an SPV, banks anticipate those cash flows to grant more credit. Afterwards, in the SPV the loans are converted into negotiable securities. For instance, bonds are divided into tranches according to the riskiness of the loans and mortgages, being the more junior tranches the ones to assume the first loss in case of default and the senior ones the last to lose. Being aware that these bonds were collateralized with mortgages given to clients with a high probability of not repaying the credits, we arrived to the origination of the financial crisis. Indeed, some of the mortgage borrowers started to not paying the principal and the interest and banks started to get the houses as a counterpart. With a high number of clients not paying the mortgages and banks accumulating real estate buildings without the ability to sell them the investors that bought the MBS, ABS and CDOSs started to face losses, and after that the whole economy started to collapse. Correlated
with the subprime crisis, where mortgages not conforming to the government’s
requirements in terms of credit quality and size, were not sold with the government sponsored entities and were actually sold in secondary markets, originating subprime mortgages, and reflecting a high value of mortgages relatively to house prices, dictate the collapse of the market when the price of the
houses started to reduce (Coval, Jurek, et al., 2009). Moreover, with direct influence in the defaults of some entities like Lehman Brothers, the image of securitized products was severely tarnished during the crisis (Choudhry and Landuyt, 2009).
The same authors (Choudhry and Landuyt, 2009), pointed out some factors that contributed to the fall in confidence in the market since 2007, due to securitization.
Firstly “the flexibility and wide application of the securitization technique”, gave banks the possibility to move assets off the balance sheet, which
allowed banks to sell low-quality assets like sub-prime mortgages to investors who had little knowledge about the credit risk they were getting.This is known in the finance literature as asymmetric information. In this case, the bank that has the loans knows much more about the risks associated to that loans than the investors that would buy bonds collateralized by those assets, which gives a strong advantage to the bank.
Secondly, in securitization the link between the borrower and the bank is separated. Hence, there is a less incentive for the bank to be risk conscious. In a normal bank regime, banks should have a minimum loan to deposits ratio, but this do not apply if they get rid of some loans by selling them to a SPV. This turns out to be an agency problem, because the originator loses the interest on the pool of assets in the moment they are sold to the SPV. Since the assets do not belong to the issuer anymore, the originator starts to be careless when it evaluates the creditworthiness of its customers, because even if the client has a bad rating the losses on those assets do not impact the balance sheet of the issuer(Iacobucci and Winter, 2005; Jensen and Meckling, 1976).
The amount of leverage in the SPVs at the time was very high. The normal leverage was 1:15, but some SPVs had leverage ratios of 1:40 and even 1:50. This led to a fail of hundreds of SPVs.
Furthermore, some of these products became very complex and difficult to analyse by outsiders. As an example, the correlation risk within the credit portfolio became very difficult to measure, which made more difficult the pricing of the securitized securities.
Also, the credit rating agencies, used complex methodologies to give credit ratings, that were not understood by all investors. Additionally, they gave very optimistic ratings to certain deals.
Finally, the liquidity of the majority of the securitized assets was overestimated. For instance, the liquidity of an AAA-rated securitized paper was believed by investors to be the same as the liquidity of a plain vanilla AAA-rated paper and consequently, it could be easily funded by highly liquid commercial paper.
With all the problems of the securitization technique referred above, being the financial institutions exposed to the subprime mortgage marked we arrived to a financial crisis, due to the role played by the structure finance market. In addition, Criado and Rixtel (Criado and Rixtel, 2008) pointed out that banks abused in the use of structured finance products and putting them out of the balance sheet. Additionally, they also had a large exposure to CDOs.
Since the image of the securitized products was completely damaged after the financial crisis, some authors (Choudhry and Landuyt, 2009), pointed out some recommendations in order to restore the market confidence in this kind of financial products, such as: establishing a securitization forum of interest parties, in which the main market entities, as an example banks, investors and regulators review the state of the market and make recommendations for change to which all new transactions would adhere and also monitor the current legislation; re-couple the de-coupling (not direct intermediation between lender and borrower during the transaction, because of the use of a SPV/SPE), that is the major pitfall of securitization, with the objective to make the lender more risk consciousness;
restore the credibility of the rating agencies, by trying to give more transparency as well as neutrality, and the performance of these agencies should not be based in the number of issued ratings, but instead on the quality of the ratings given; review of credit rating methodology, in order to be more understandable by investors.
1.5
Western European markets versus the US market
According to Tasca and Zambelli (Tasca and Zambelli, 2005) the concept of asset securitization was introduced in the US financial system in the 1970s. From then until the introduction of the Euro in 1999 this market had a small growth, especially in Europe. Although, after that introduction the importance of the European securitization market increased, leading to a rapid growth until the beginning of the financial crisis in 2007.
The main difference between the European and the much larger and developed US market, is that in the US the main promoter of securitization transactions was the government, that had the goal to encourage home ownership and create a secondary market for mortgages. By contrast, in Europe, the government did not intervene in order to promote securitization. Indeed, in Europe, the first MBS were issued by large commercial banks with the objectives of regulatory arbitrage, diversification of funding sources, and as a response to the appeal of international investors (Joao M. Pinto, 2014).
In addition, the fact that the European market is divided into a large number of countries with different legislations, in contrast to the US market, led to a more complicated legal setup as well as more upfront costs to be supported by the originators. As stated by Adams (Adams, 2005), the wide divergence in market sizes within Europe is a reflection of the very different economic, financial, political, historical, legal, and social frameworks.
Finally, Adams (Adams, 2005) mentions some more differences between the European and the US market:
1. Lack of uniformity in the structures and the definitions used in the European ABS markets, since there are no definitions for concepts such as: prime, conforming, non-conforming, or jumbo loans. Missing of agencies in the European market like Fannie Mae1 and Freddie Mac1
operating in the US.
2. Absence of credit score in the European countries. In contrast to the US market, there is no credit score acceptance in Europe like FICO score2
in the US. There are some credit reference agencies in Europe that developed their scores, however these scores are not used by finance companies.
3. European investors have lower propensity to borrow than consumers in the US.
4. In terms of default, European consumers are, in general, less likely to default in their debts than the US consumers. This is explained by the fact that in Europe bankruptcy is regarded more seriously, and the financial impact of bankruptcy tends to be more severe. Moreover, the legal systems in Europe support more the lender.
5. The prepayment risk that has a more important role in the US rather than in Europe.
1 Fannie Mae and Freddie Mac are government sponsored enterprises that buy mortgages from lenders, poll
them together and sell them as mortgage-backed securities to investors
1.6
The pricing determinants of AS bonds
The literature on the pricing of AS bonds is scant when compared with the abundant literature regarding corporate bonds spread determinants. In this section we present the empirical literature on the pricing of corporate bonds as they are important to understand what factors can affect the spread of AS bonds with the goal to create a background to understand the pricing of AS transactions. Additionally, the AS market is composed by ABS, MBS, and CDOs. Since we have differences in the assets related to these securities, the relevant pricing factors for these securities should differ, too (Vink and Thibeault, 2008).
Gabbi and Sironi (Gabbi and Sironi, 2005) show that credit ratings are the most important factor determining the spreads between the yield to maturity of corporate bonds and that of equivalent Treasury securities. Furthermore, the issuance spreads of corporate bonds issued in Europe over the corresponding maturity Treasury bonds reflect investors’ perception of the risk and of the bond
primary and secondary market efficiency and liquidity conditions. Henceforth, they are a function of five main factors: (i) the bond issuer default risk; (ii) the
bond’s expected recovery rate in case of default; (iii) the expected liquidity of the secondary market of the bond issue; (iv) the expected tax treatment to which investors will be subject; and (v) the bond’s primary market efficiency conditions. They concluded that among those five factors (determinants of the pricing), ratings of corporate bonds are the most important factor to determine the credit
spreads, along with the bond’s expected tax treatment. However, the primary
market efficiency and the secondary market liquidity turned out to be poor explanatory variables. In this study the authors carried out an analysis of the spreads in the primary market, since the liquidity in the secondary market is poor.
Moreover, (Elton, Gruber, et al., 2001) state that the “spreads in rates between corporate and government bonds differ across rating classes and should be
positive for each rating class”. They pointed out three factors that may increase
the spread on corporate bonds: (i) expected default loss, meaning that the investors require a premium to compensate this expected loss in comparison to the non-defaulting government securities; (ii) tax premium, yields that the capital gains on corporate bonds are taxed whereas interest payments on government bonds are not; (iii) risk premium, stating that the return on corporate bonds is riskier than the return on government bonds, because a considerable part of the risk on corporate bonds is systematic. Although, some authors do not corroborate factors two and three3, by assuming that the spread is all default premium. To
cast doubt on this opposite literature, Elton (Elton, Gruber, et al., 2001) found that taxes and risk premiums represent a large part of corporate bonds pricing determinants. Beyond the credit rating as being the most important pricing determinant the literature also points out liquidity (Bao, Pan, et al., 2011; Chen, Lesmond, et al., 2007; Longstaff, Pan, et al., 2011), systematic risk (Collin-Dufresne, Goldstein, et al., 2001; Elton, Gruber, et al., 2001), incomplete accounting information (Flannery, Nikolova, et al., 2012), leverage (Flannery, Nikolova, et al., 2012) and taxes (Elton, Gruber, et al., 2001) as another important pricing factors. Moreover, macroeconomic variables such as the reference interest rates, the yield curves, the volatility in the market also can affect the credit spread of an AS bond(Campbell and Taksler, 2003; Krishnan, Ritchken, et al., 2005). Finally, the characteristics of the issuance, such as: maturity, tranche size, transaction size and the year of the issuance also contribute to influence the credit spread. Putting all these findings together the previous literature found that ABS,
MBS and CDOs are influenced by the same pricing determinants, though in a different way(Vink and Thibeault, 2008).
Turning now to the pricing of securitized products, the academic literature contains few AS bond pricing studies. Maris and Segal (Maris and Segal, 2002) found that default probability, tranche size, transaction size, and year of issuance influence credit spreads for commercial mortgage-backed securities (CMBS). In addition, for CMBS, (An, Deng, et al., 2010) it was concluded that interest rate volatility, the yield curve slope, and the property type composition of the underlying asset pool have a significant impact on credit spreads. Rothberg (Rothberg, Nothaft, et al., 1989) corroborates that interest rate volatility affects the pricing of AS bonds and adds that liquidity, credit risk and the term structure of interest rates also affects significantly the pricing of the mentioned securities. Furthermore, Ammer and Clinton (Ammer and Clinton, 2004) argue that credit rating is the most important pricing factor for AS bonds. This research is confirmed by other literature studies (Buscaino, Caselli, et al., 2012; Hu and Cantor, 2007; Vink and Thibeault, 2008).
As can be perceived by comparing the pricing of corporate bonds with the pricing of securitized bonds, the main price determinant for both is the credit rating.
2
Hypotheses and Sample Selection
2.1
Hypotheses
The primary goal of this work is to compare the differences between the pricing of AS bonds in the Western European (W.E.) versus the United States (U.S.) market. Henceforth, regarding the five research questions presented in the introduction, we can formulate 3 hypotheses:
1. Credit spreads and pricing characteristics differ significantly between AS bonds issued in the U.S. versus W.E.
2. AS bonds credit spread is higher in the U.S. than in W.E.
3. The 2007-2008 financial crisis and the subsequent European sovereign debt crisis affected significantly AS bonds credit spread and pricing determinants.
On the first hypotheses, we will use a univariate analysis to begin the study of the differences in the credit spread as well as the pricing factors of AS bonds in both markets, the U.S. and W.E. Therefore, we will take conclusions about the main pricing factors of AS bonds in both markets.
The second hypothesis, comes up from the previous finding in the literature and also analysing the data (further on explained in the Credit Spread Analysis section), that corroborate the idea that the credit spread for AS bonds issued in the U.S. have increased during and after the crisis period in comparison to the before crisis period. In fact, we already expect an increase of the credit spreads on these securities in the U.S. and in W.E. after 2007, however the main goal of the second research question is to observe and explain the different credit spreads for the same securities issued in the U.S. and in W.E. Additionally, there is an intent to see which market was more affected by the financial crisis in terms of
credit spreads, and why we had different credit spreads between the two analysed markets. The answer to this hypothesis starts once more with the univariate analysis, in which we compare the average credit spread of our sample between AS bonds types (ABS, MBS, and CDOs) and deal region (U.S. and W.E.). Finally, in the third hypotheses, we want to examine the impact of the financial crisis in the credit spreads of each security type and also the impact that this crisis had in each analysed market. It is expected that the credit spread of these securities increase in the aftermath of the financial crisis, with more intensity in the U.S. In order to study this impact, we intend to build a univariate analysis table in which we calculate the mean of the credit spread and the variables that determine it, before (from January 2000 to September of 2008) and during the crisis periods (from September 2008 to December 2016). Afterwards, we intend to run OLS regressions for pre-crisis and crisis periods.
2.2
Sample Selection
2.2.1
Databases
The sample of ABS, MBS, and CDOs used was extracted from DCM analytics database, within the period of January 1st, 2000 to December 31st, 2016. Beyond
the date criterion, the sample was also filtered by nationality of risk (similar to deal nationality), by selecting bonds issued by originators located in the U.S., U.K. and Euro Area countries. The issuers of AS bonds that we chose to the sample are only banks.
Macroeconomic data like the risk-free rate for both Europe and the US, market volatility, Libor US, Libor UK, Euribor, and government yields (Germany, UK, and the US) were obtained from Bloomberg. Finally, accounting and market variables from the originators, such as total assets, ROA, ROE, loans, customer deposits, capital ratios and equity value, were extracted from Bankscope.
2.2.2
Description of variables
Credit Spread (Dependent Variable)
Credit spread was used as the dependent variable and represents the pricing of the financial product. The credit spread consists in the difference between the yield to maturity (YTM) of the tranche and the corresponding Government yield (with the same maturity of the deal) on the issuance date; i.e., the option adjusted spread (Elton, Gruber, et al., 2001).
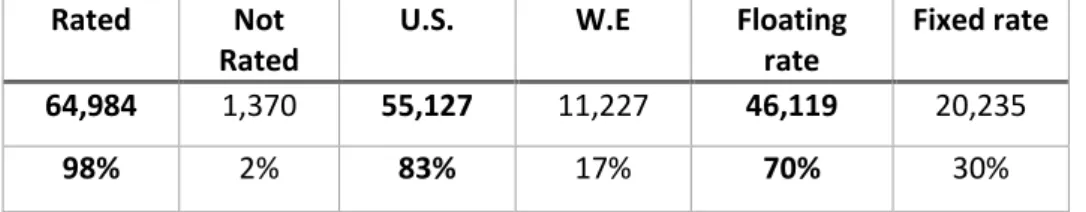
The sample of credit spread was divided into two big categories, fixed rate and floating rate notes. From the initial sample, the following issue types were removed: fixed rate converting to floating, fixed rate extendible and floating rate note extendible.
We only use deals with a deal currency code of in EUR, GBP, and USD and government yields of the US, the UK, and Germany. By doing this we avoided the forex effect. As an example, for a deal made in Europe in USD we used the US respective government yield (according to issuance date and maturity dates) to subtract from the YTM of the tranche.
Adjusted Spread
To improve the comparison of credit spreads between fixed rate and floating rate issuances, we use the adjusted spread. It is necessary to account, in credit spread computation, for the fact that the fixed rate bond carries the interest rate risk, whereas a floaterquoted as a spread relative to a benchmark (e.g., Libor) --does not. Hence, to ensure comparability of spreads at issuance we converted floating rate bonds to fixed rates using fixed-for-floating rate swaps. This conversion was implemented individually for each bond, using the appropriate quote for the swap matching the maturity of the bond and taken at the issuance
date. We also consider the specific interest rate market (EUR Libor, USD Libor and GBP Libor) and even different reference rates within the same market (USD Libor 1M, USD Libor 3M, USD Libor 6M, and USD Libor 12M).
Country Risk
This variable is a proxy of country rating estimated by Standard & Poor’s. The
scale goes from 1 to 22. The value of 1 means that the rating of the country where the deal took place was AAA at the time of issuance. The scale continues until the number 22, matching the rating DD. Hence, a positive coefficient in this variable is expected, since countries with lower score (higher rating) have lower risk. From the previous literature we can point out Zaghini study (Zaghini, 2014), in which he states that a positive effect on spread is expected since banks headquartered in countries with lower risk tend to give a special protection in default.
Credit Rating
Credit rating measures the credit risk given by Standard & Poor’s to the deal’s tranche at the time of issuance. As in country risk the range of values goes from 1 to 22, in which an AAA rating gets a value of 1 and a DD rating gets a value of 22. As it can be perceived, the higher the value is, the lower the rating is given. In the previous studies (Gabbi and Sironi, 2005; Zaghini, 2014) the relationship between credit rating and credit spread was analysed and was it was found that: credit rating is the most important determinant of credit spread; and the higher the credit risk, meaning a higher score in the rating scale, turns out to increase the value of the credit spread, creating a positive relationship between these two variables.
Rated
As another measure of the Rating of a tranche this variable intends to distinguish between rated and not rated tranches. In, fact according to the previous literature of rating, described in the last variable analysis is possible to see that if rating is downgraded the credit spread increases. Henceforth, since a not rated bond is considered for the market to be more expected to default in comparison to a rated one, because it does not have a credit rating, the expectation is that when we compare a rated bond with a not rated one the credit spread for the not rated one be higher than for the rated one.
Maturity
This variable represents the time until maturity of the bonds in years. Ceteris Paribus, bonds with longer maturities tend to be riskier than the ones with shorter maturities, because it gets more difficult to forecast with accuracy the future cash flows. Consequently, the demanded spread for longer maturities tend to be higher. From the previous empirical studies regarding asset securitization bonds (Vink and Thibeault, 2008), we have evidence that a significant negative relationship between spread and CDOs yields with a maturity lower than 5 years, and the same relationship occurs in MBSs with a maturity longer than 15 years. For ABS these authors did not find any significant relationship between maturity and credit spread. Henceforth, it is difficult to forecast the variable sign.
Government Yield
For the Government Yield variable, the difference between the issuer country 10yrs Government Yield (long-term) and the 3mth Government Yield
to an increase on the credit risk, and a not linear yield curve, result in an increase of the credit spreads (Barrios and European Commission. Directorate-General for Economic and Financial Affairs., 2009).
Subordinated Debt
This variable takes the value one if the tranche represents a debt owed to an unsecured creditor, which means that in a scenario of default, this creditor can only be paid after the claims of secured creditors have been paid. Therefore, as this means more risk for this kind of issuance, we expect an increase in the credit spread for subordinated debt tranches.
GDP per capita
The above variable is a macroeconomic one, that in a general level measures the average income of the citizens of a country. Thus, as this average income increases, we expect the country to be a more developed one. More developed countries have less risk associated, consequently we expect lower credit spreads for AS bonds issuances in countries where the GDP per capita is higher. In other words, we expect a negative correlation between credit spread and GDP per capita.
Creditor Rights
To use this variable, we extracted the Laporta’s Creditor Rights scale (La Porta, Lopez‐de‐Silanes, et al., 1998). From previous studies (João M Pinto, 2018), in
which was found that countries with better creditor rights have more probability to issue structured finance debt such as Project Finance loans, rather than straight debt funding. Therefore, we expect that countries with a higher level of creditor rights have more AS bond issuances with lower credit spreads.
Risk Free Rate
This variable intends to be a proxy for the general levels of interest rates. We used two different types of interest rates. For the European market, we use the three-month German Treasury bill (Risk free WE) and for the US market we used the three-month US bill (Risk free US). Both risk free rates were used with the values at the time of the issuance of the bonds. Some authors (Eichengreen and Mody, 1998;Kamin and von Kleist, 1999) state that the general level of interest rates is an important determinant of the bond’s pricing. The à-priori expectation is that the risk free rate will have a significant negative impact on credit spreads, because higher yields are associated with a better and growing economy and so, lower probabilities of default (Collin-Dufresn, Goldstein, and Martin, 2001; Longstaff, Pan, Pedersen, and Singleton, 2011).
Volatility
Volatility means the change in the value of an asset and reflects a measure of uncertainty and risk. In order to measure this variable, the closing values for the US Volatility Index (VIX) were used as a proxy. US VIX is a negatively correlated index with the S&P 500, and we expect a positively correlation between US VIX and the credit spread. As it is stated by the literature until now, higher volatility, means higher risk, and that leads to a higher risk premium demand (Collin-Dufresn et al., 2001; Davidson, 2003; Fabozzi and Kothari, 2007; Pinto, 2013).
Number of banks
The number of banks involved in the deal can influence the deal’s risk. For
instance, if we have a deal involving a broad number of banks it might lower the spread, because investors tend to give less risk to a deal when it has certification from more agents. Previous analyses (Vink and Thibeault, 2008) found that credit spread and number of lead managers are significantly, negatively related for
MBS, while for ABS and CDOs they have an insignificant relationship. Therefore, the expectation is to have a negative influence of the variable number of banks on the spread (Nadauld and Weisbach, 2012; Sorge and Gadanecz, 2008a).
Loan to Value (Tranche to Transaction)
The Loan to Value is a measure that represents the ratio between the tranche size and the transaction size. It is gotten by dividing the tranche size over the transaction size. For AS bonds higher this ratio, lower the credit spread. As mentioned before, an example of a credit enhancement strategy consists in the creation of a credit risk mitigation instrument in which the lowest rating classes, the most junior ones (B, C, and D), provide credit support to the highest rating class, the most senior one (A), in order to reduce the risks transferred to investors. Thus, tranching is a pillar of the securitization process.
Tranche Size
The tranche size represents the tranche amount in USD. Maris and Segal (Maris and Segal, 2002) proved that tranche size influences negatively the CMBS (Commercial Mortgage-Backed Securities) credit spread. Additionally, the previous literature (Buscaino, Caselli, Corielli, and Gatti, 2012; Cuchra, 2004; Sorge and Gadanecz, 2008; Vink and Thibeault, 2008) also corroborates the statement, in which, tranche size has a negative impact on the credit spread.
Transaction Size
This variable represents the amount in US dollars of the whole transaction. We expect à-priori that larger transactions are negatively correlated with credit spread, since higher amounts issued, require more procedures and certification, being riskier.
Number of tranches
This variable gives the number of tranches per transaction. Having the transactions divided in tranches allow us to study the impact of tranching on the credit spread. As stated by Vink and Thibeault (Vink and Thibeault, 2008),
“Tranching could allow the issuer to take advantage of market factors such as
greater investor sophistication and heterogeneous screening skills related to
asymmetric information”. Additionally, Firla-Cuchra and Jenkinson (Cuchra and Jenkinson, 2005), found a significant and negative relationship between the number of tranches and the credit spread at launch. Therefore, a negative coefficient for this variable is predicted.
Fixed rate
The dummy variable fixed rate is one if the bond is a fixed rate bond, and zero otherwise. With fixed rate issuances the bond coupons are not affected by the market interest rates, except if they are callable bonds and the issuer decides to call them back in case of lower interest rates. The expectation of the issuer by issuing at fixed rate is to protect itself against an increase in interest rates. Henceforth, the issuer has to add a premium to borrow funds at fixed rate, vis-à-vis with floating rate issuances, so the spread for fixed rate issuances should be higher. Empirically, Sorge and Gadanecz (Sorge and Gadanecz, 2008) found a significant discount in the pricing of floating rate bonds, which can be correlated with the insurance premium that yields for fixed rate offers against future interest rate fluctuations.
Currency risk
This is another dummy variable that takes the value one if the deal’s tranche
currency is different from the currency of the issuer and zero otherwise. Like it is expected à-priori, and corroborated by Vink and Thibeault (Vink and
Thibeault, 2008) securitized bond issues exposed to currency risk have higher spreads than issues without it.
Callable
Callable represents a dummy variable that is equal to one if the bond has a call option embedded and zero otherwise. The callability of a bond gives the issuer the right to redeem the bond at some point before it reaches the maturity date. The call price normally exceeds the issue price. As that being said, the credit spread should reflect this option, and so, the callability of a bond should be positively correlated with the credit spread (Fabozzi and Kothari, 2007).
3
Univariate Analysis
3.1
Market Evolution
Our sample of AS bonds, more specifically MBS, ABS and CDOs was extracted from DCM analytics with the following criteria:
- AS bonds issued in the European Union, in the UK and in the US; - Issued between January 1st, 2000 and December 31st, 2016;
- Not issued by state-owned entities
After applying these criteria, we excluded perpetual maturity bonds, as well AS bonds issued by nonfinancial firms. Finally, we excluded outliers: 0.5% of the lowest and highest spreads and tranche sizes were excluded.
After applying these screens, we are able to analyse 24,727 deals, corresponding to 84,580 tranches, worth $ 17,514 billion. We next describe further our sample.
Since the purpose of this dissertation is to compare the pricing of AS bonds in the U.S. vis-à-vis W.E., the majority of the graphs show the differences between these two regions. However, as stated by the literature, the U.S. market is broader and larger than any other country or region in the world. By contrast the W.E. market is divided in Eurozone and the UK, and we can even go further and split the Eurozone in several countries. Thus, we also created some charts in order to show the differences within the W.E. market.
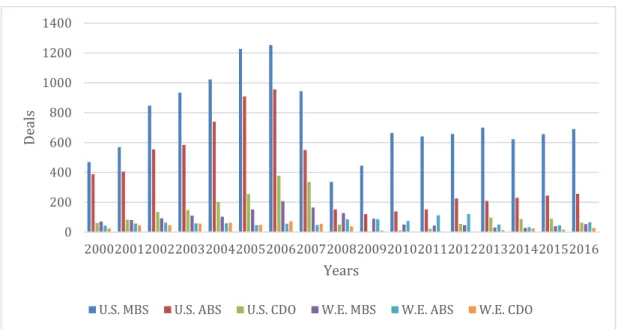
Graphs displayed in figures 3.1.1 and 3.1.2, present the number of deals by region (U.S. vs W.E.) and security type (MBS, ABS, and CDO) throughout the period of analysis (2000 to 2016), as well as the amount issued by region and security in the same period, respectively.
Figure 3.1.1.: Number of deals per security and region
Figure 3.1.2.: Amount issued in $B by security and region
As expected, the U.S. market dominates in terms of number and amount. Our sample is in line with the previous literature findings. Also, we can see that between 2002 and 2007 the securitization market achieved its peak. Once more, this is in line with the literature about the topic that evidences the period after the introduction of the euro (2000) until 2007 as the “golden age” of securitization. 0 200 400 600 800 1000 1200 1400 20002001200220032004200520062007200820092010201120122013201420152016 De a ls Years
U.S. MBS U.S. ABS U.S. CDO W.E. MBS W.E. ABS W.E. CDO
0 200 400 600 800 1,000 1,200 20002001200220032004200520062007200820092010201120122013201420152016 $B Years