Lincoln
University
Digital
Thesis
Copyright
Statement
The
digital
copy
of
this
thesis
is
protected
by
the
Copyright
Act
1994
(New
Zealand).
This
thesis
may
be
consulted
by
you,
provided
you
comply
with
the
provisions
of
the
Act
and
the
following
conditions
of
use:
you
will
use
the
copy
only
for
the
purposes
of
research
or
private
study
you
will
recognise
the
author's
right
to
be
identified
as
the
author
of
the
thesis
and
due
acknowledgement
will
be
made
to
the
author
where
appropriate
you
will
obtain
the
author's
permission
before
publishing
any
material
from
the
thesis.
An Empirical Analysis of Malaysian Housing Market: Switching
and Non-Switching Models
A thesis
submitted in partial fulfilment
of the requirements for the Degree of
Doctoral of Philospohy in Finance
at
Lincoln University
by
Zaemah Zainuddin
Lincoln University
2010
Abstract of a thesis submitted in partial fulfilment of the
requirements for the Degree of PhD in Finance.
ct
AN EMPIRICAL ANALYSIS OF MALAYSIAN HOUSING
MARKET: SWITCHING AND NON-SWITCHING MODELS
by
Zaemah Zainuddin
Increasing inflows of foreign investment particularly in the real estate sector in the early 1990s, has contributed to the building up of “bubble” in the economies of several Asian countries. In 2004, house prices increased rapidly in several countries such as South Korea, Hong Kong and Singapore (World Report, 2004). The rapid increase in prices has led economists to believe that a ‘bubble’ has form in the housing market. A housing market bubble occurs when house price increases are not justified by macroeconomic fundamentals and other underlying factors (Xia and Tan 2006). The effect of housing bubble bursts is seen in the loss of value to owners of capital, increase unemployment, slowing down of the economy particularly in housing-related sector.
This study empirically test whether a bubble exist in the Malaysian Housing Market for the period 1990 to 2004. Using a general to specific approach from a simple multivariate liner regression model (OLS) to more sophisticated models such as Vector Error Correction Model (VECM), Vector AutoRegression (VAR), regime-switching (Markov-Switching),GARCH model and MS-GARCH, our result suggests that a semi-rational bubble does exist in the Malaysian housing market in 1997:Q1 to 1998:Q2. The deviations or fluctuations of the Malaysian House Price Index cannot be explained by the macroeconomic fundamental variables such as income, interest rate and inflation. Furthermore, the result also implies that Malaysian housing market is inefficient market due to the slow adjustment process towards its long run equilibrium price. The mean and variance of the MHPI is significantly different in the two states (boom and burst) which suggest that the Malaysian housing market had experienced a boom and bust of house price bubble prior to the occurrence of the 1997 Asian financial crisis. The results of switching model approach support the changing behaviour of MHPI in different economic states, implying possible existence of bubbles in the Malaysian housing market.
Acknowledgements
With the help and guidence by Allah, I was able to complete this thesis.
I received a great deal of help and assistance in completing and putting this study together. It is a pleasure to express my appreciation to those who have inspired and motivated me throughout my Phd journey. Above all, I would like to express my deepest appreciation to my supervisor Assoc. Prof Dr Christopher Gan for his constructive comments, guidance, patience and valuable time in helping and editing this study. My sincere gratitude also goes to my associate supervisor, Mr Bert Ward who motivated me in learning and understanding econometric and statistical issues in this study. I would also like to thank my lovely and precious friends Yao, Pat, Lisa, Satit, Suriani, Athiah, Juhaida, Wan, Sabrina, Suraya, and Wan Munirah for all their supports, love and friendship throughout my studies at Lincoln University, New Zealand.
I am also indebted to all the staffs at Student Learning Centre and the Faculty of Commerce for their guidance and help. It is my greatest pleasure to have such a wonderful experience studying at Lincoln University.
Lastly, I would like to express my greatest appreciation to my parent, Zainuddin and Fatimah, my sisters, Zuhaida, Zahirah and Zuliana, for which I love and care so much. Thank you for your endless love and guidance without whom I would not be what I am today. I do owe a huge debt to my precious and lovely daughter Nur Atilia and my husband Muhamad Nizam. Your love and patience brought joy and happiness to my busy life as a student.
Thank you
Zaemah Zainuddin
Table of Contents
Acknowledgements ...iii
Table of Contents ... iv
List of Tables ... vii
List of Figures ...viii
Chapter 1 Overview of the study... 1
1.0 Introduction ... 1
1.1 Background of the Study... 5
1.2 Problem Statement ... 12
1.3 Research Objectives... 15
1.4 Significance of the Study ... 15
1.5 Organization of Thesis ... 16
Chapter 2 An Overview of the Housing Market in Malaysia... 18
2.0 Introduction ... 18
2.1 Background of Malaysia ... 18
2.2 Overview of the Malaysian Property Market ... 21
2.2.1 The Characteristic of Malaysian Housing Market ... 23
2.2.2 Malaysian House Price Structure ... 26
2.2.3 Property Cycles in Malaysia ... 29
2.3 The Mortgage Market in Malaysia... 38
2.4 Malaysian Housing Policy... 41
2.5 Capital Control in Malaysia... 42
2.6 New Policies and Guidelines by Malaysian Government to Restructure the Real Estate Market after the 1997 Asian Financial Crisis... 44
2.7 Summary... 46
Chapter 3 Theories of Housing Bubbles ... 47
3.0 Introduction ... 47
3.1 The Concept of Bubble in the Housing Market... 47
3.1.1 Definition of Bubbles ... 48
3.2 Theories of Housing Bubbles ... 52
3.2.1 Supply Side Economics Theory... 53
3.2.2 Keynesians and Shiller Theory ... 54
3.2.3 The Austrian School of Thoughts ... 55
3.3 Price Expectation Theories... 55
3.3.1 Rational Expectation Hypothesis (REH)... 57
3.3.2 Adaptive Expectation Hypothesis (AEH) ... 60
3.3.3 Exogenous Expectation Hypothesis (EEH)... 63
3.4 Signs and indication of bubbles in the housing market ... 63
3.4.1 Phases of Bubbles in the Housing Market... 64
3.5 Review on Housing Bubbles Studies ... 71
3.6 Conclusions... 79
Chapter 4 Housing Bubble Model ... 80
4.0 Introduction... 80
4.1 Macroeconomic Fundamental Variables of House Price ... 80
4.2 Housing Market and Interrelated Sectors/Markets ... 86
4.2.3 Construction Sector Factors... 89
4.2.4 Economic Sector Factors... 90
4.3 Models of House Price ... 91
4.3.1 Asset-Market (User-Cost Approach) Model ... 92
4.3.2 Reduced Form Housing Equation Model ... 96
4.3.3 Vector Error Correction Model... 98
4.3.4 Ratio Approach Model ... 100
4.4 Model Specification for Housing Bubble... 102
4.4.1 Non-Switching Model ... 104
4.4.2 Switching Model ... 105
4.5 Conclusions... 106
Chapter 5 Data Collection and Research Methodology ... 108
5.0 Introduction... 108
5.1 Data and Study Period... 108
5.1.1 Malaysian House Price Index (MHPI) ... 110
5.1.2 Income Variable (GDP)... 113
5.1.3 Interest Rates Variable ... 115
5.1.4 Inflation (Consumer Price Index) ... 118
5.2 Research Methodology... 120
5.2.1 Non-Switching Model ... 122
5.2.1 a) Multivariate Linear Regression Model... 122
5.2.1b) Autoregressive Conditional Heteroscedasticity (ARCH) Model and General Autoregressive Conditional Heteroscedasticity (GARCH) Model ... 124
5.2.1 c) Cointegration... 127
5.2.1 d) Equilibrium House Price ... 134
5.2.4 e) Size of House Price Bubbles... 137
5.2.2 Switching Model: Modeling the Mean (level) and the Variance (volatility) of the MHPI... 139
5.2.2 a) Modeling the Mean (level) of Malaysian House Prices in Different Economic States of Boom and Burst ... 141
5.2.2b) Modeling the Variance (volatility) of the Malaysian House Prices Index ... 143
5.3 Conclusions... 148
Chapter 6 Discussion of Empirical Findings and Results... 150
6.0 Introduction... 150
6.1 Evidence of House Price Bubbles in the Malaysian Housing Market ... 150
6.2 Results of Non-Switching Model... 154
6.2.1 Multivariate Regression... 154
6.2.2 Generalized Auto Regressive Conditional Heteroscedasticity (GARCH) Model in the Malaysian Housing Market ... 158
6.2.3 The Cointegration Relationship between Malaysian House Price Index (MHPI) and Macroeconomic Fundamentals (income, interest rate and inflation) ... 161
6.2.3 a) Elasticity... 166
6.2.3b) Efficiency in the Housing Market ... 167
6.2.3c) House Price Equilibrium (Evidence of Housing Bubble) ... 169
6.3 Results of switching model... 176
6.3.1 Empirical Results of Modeling Switching-State in the Mean (level) and Variance (volatility) of MHPI... 176
6.3.1a) Switching in the Mean (level) of the MHPI... 176
6.3.2 Regime-Switching in Variance (volatility) using Markov-switching GARCH model ... 180
6.4 Summary of the Findings ... 182
Chapter 7... 184
Discussion, Recommendation and Conclusion... 184
7.0 Introduction... 184
7.1 Summary of the Findings and Discussion ... 184
7.2 Implications of the Research Findings ... 188
7.3 Limitations of the Study ... 193
7.4 Future Direction in the Housing Price Bubble Research. ... 195
7.5 Conclusions... 196
References ... 197
Appendices ... 230
Appendix 1 – Results of Non-Switching Model... 230
List of Tables
Table 1.1 Exposure of East -Asian Banking Sector to Real Estate, 1996... 6
Table 1.2 House Price Indexes movement during and after the Asian Financial Crisis for selected Asian Countries ... 7
Table 1.3 Annual price changes of MHPI in pre-crisis and post-crisis period... 11
Table 2.1 Percentage shares of residential markets from total property market in Malaysia from 1996 to 2005 ... 22
Table 2.2 Housing ownership structure of selected East-Asian countries ... 24
Table 2.3 House price, Structure and Target income group for the four types of houses in MalaysiaBefore June 1998 ... 28
Table 2.4 Malaysian property transaction from 1991 to 1995 ... 35
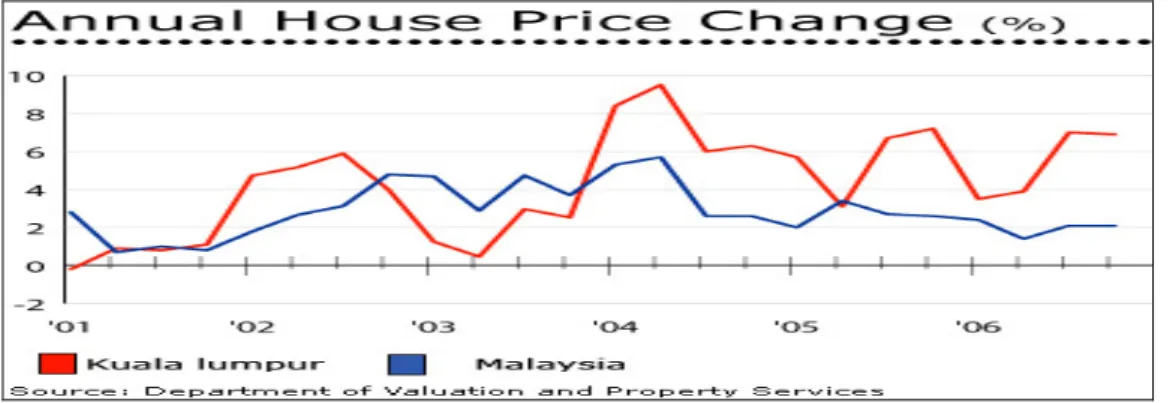
Figure 2.5 Comparison of annual housing price changes between Kuala Lumpur and Malaysia ... 37
Table 2.6 Capital Controls imposed on the Malaysian economy in 1994 and 1998 ... 43
Table 2.7 National Inventory of residential property... 46
Table 4.1Common variables used to determine the house prices... 84
Table 5.1 GDP growth in Malaysia ... 115
Table 5.2 Model selection for VECM... 131
Table 6.1 Results of LM test and Heteroskedasticity test ... 156
Table 6.2 ARCH test on Malaysia house price ... 157
Table 6.3 Augmented Dickey-Fuller (ADF) Unit Root Test Results ... 161
Table 6.4 Selection of lag length in the VAR ... 162
Table 6.5 Elasticities of the Malaysian house price in relation to mean income, interest rates and inflation ... 166
Table 6.6 Comparison between real house prices and long-run equilibrium house price in Malaysian housing market from 1990:Q1 to 2004:Q4 ... 170
Table 6.7 Percentage deviation of the Malaysian house price from its' long-run equilibrium price ... 174
Table 6.8 Results of the Multivariate switching model in the mean (level) equation of MHPI (condition on incomem interest rate and inflation) ... 179
Table 6.9 Results for the regime-switching in the volatility (variance) of the house price in Malaysia ... 181
Table 7-0.1 Summary results for income, interest rate and inflation which affect the MHPI (non-switching and switching models) ... 186
List of Figures
Figure 1.1 Real House Price Indexes for Asian Countries (1995=100) ... 8
Figure 1.2 Malaysian House Price Index, MHPI (1990=100) ... 10
Figure 2.1 Map of Malaysia ... 19
Figure 2.2 Annual percentage changes in price of Malaysian houses from 1990 to 2003 ... 25
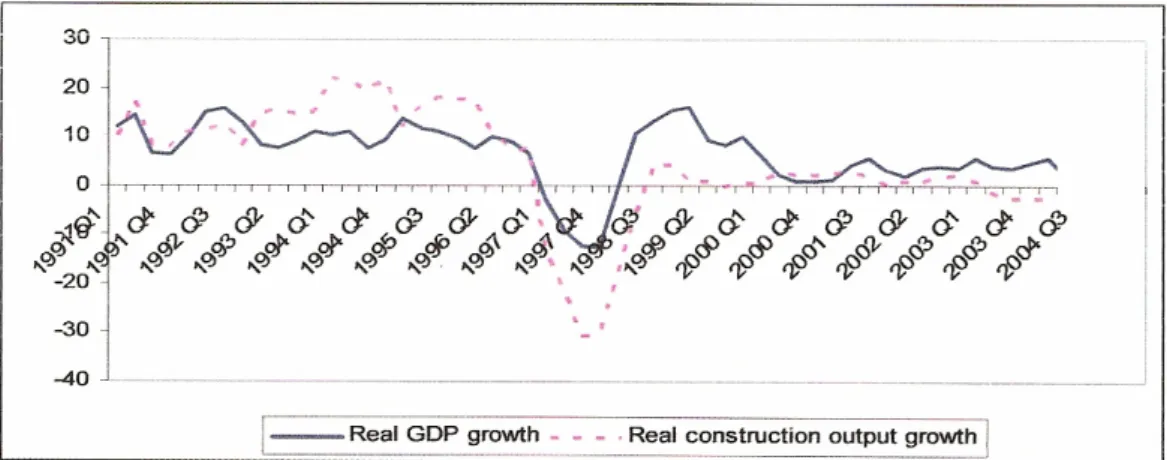
Figure 2.3 Comparison between Real GDP Growth and Real Construction Output Growth in Malaysian from 1991 to 2004 ... 27
Figure 2.4 Annual percentage changes in Malaysian house prices from 1990-2003 ... 35
Figure 4.1 Structure of housing market with various inter-related sectors ... 91
Figure 5.1 Malaysia House Price Index (MHPI) from 1990 to 2004 ... 112
Figure 5.2 Malaysian income variable, proxy by GDP... 114
Figure 5.3 Three-months interest rates in Malaysia ... 117
Figure 5.4 Comparison of the Bank Negara Malaysia (BNM) intervention rate, 3 months interbank rate and commercial base lending rate in Malaysia after the Asian financial crisis... 118
Figure 5.5 Inflation rate in Malaysia... 120
Figure 6.1 Comparison between the real GDP growth rate and the property growth rate (in percentage) from 1992:Q1 to 2004:Q4 ... 151
Figure 6.2 Growth rate of commercial bank lending rate (in percentage) ... 151
Figure 6.3 Malaysian House Price Index, interest rate, income and inflation ... 152
Figure 6.4 Standarized residuals of Malaysian house price index from 1990 to 2004... 158
Table 6.5 Model selection for VECM... 162
Figure 6.6 Long-run equlibrium coefficients for VECM... 164
Figure 6.7 Movement of MHPI towards equilibrium price ... 169
Chapter 1
Overview of the study
“The world wide rise in the house price is the biggest bubble in history. Prepare for the economic pain when it pops.”
(Economist 2005)
1.0
Introduction
Since the early 1990s, the nominal house prices in several countries such as Australia, Spain, Sweden, Ireland and Britain are reported to have increased by more than 100% (Todd, 2008). The US nominal house prices have also increased by 95% between 1997 and 2006, the largest increase in the US housing market history (Todd, 2008).
The impact of increasing house prices on the economy drew the attention of economists (seeBall et al., 1996; Malpezzi & Wachter, 2005; Pollin, 2005). The long-run growth of house prices in the US and UK housing markets in 1980s, the “booming” of the Japanese housing market in 1989 (Kapur, 2006) and the 1997 Asian financial crisis (Meen, 1998) contributed to the increase in house price volatility. As a consequence, many researchers believe that the significant increase of house prices in most of the housing markets is an indication of house price bubbles (see Kapur, 2006, Meen 1998, Quigley, 1999).
The discussion about house price bubbles has escalated with the current collapse of the US housing market and its sub sectors such as insurance and mortgage companies, due to the failure of subprime mortgage. For example, the unanticipated failure of Fannie-Mae, Freddie-Mac (mortgage corporations) and the American Insurance Group (AIG) marked the beginning of the US subprime crisis. The boom in the US housing market gathered momentum between 1996 and 2006 with triple house prices recorded by the S&P-Case-Shiller House Price Index and the Federal Housing Enterprise Oversight (OFHEO) Index. According to Sander (2008), an increase of 93% to 137% in the US national average house price was recorded between 1996 and 2006. In late 2000, US house price inflation (measured by OFHEO) was 7%, an increase of 5% from the US house price inflation recorded in 1995. By 2003, the US
house price inflation had increased significantly with a more than 10% increase in nominal and real house price inflation (Leahey, 2005).
Factors which have contributed to the emergence of the US house price bubbles include low interest rates, poor lending standards and a mania for purchasing houses (Krinsman, 2007). The action by the Federal Reserves Bank of US (Fed) to lower interest rates is believed to be the main contributing factor triggering the expansion (boom) in the US real estate (Unterman, 2006). For example, a one-year adjustable rate mortgage (1/1 ARM) fell from 7% to 4% in June 2006 (Crouhy et al., 2008). The lowering of US interest rates resulted in a higher demand for houses as mortgage financing become cheaper (Crouhy et al., 2008).
The OFHEO reported that the increase in US house prices started to slow down due to the increase in interest rates by the Fed for a record seventeen times between 2004 to 2006 (from 1% to 5.25%). In addition, the Fed fund rates, which were at 1% in June 2003 increased to 5.25% by June 2006 (Crouhy et al., 2008). This increase in the Fed fund rate caused a 1.2 % decreased in US house prices (annual rate of 4.7%) in the second quarter of 2006 (Krinsman, 2007).
The slowing down of housing demand in the US affected the subprime lenders the most (Krinsman, 2007). The subprime mortgage schemes gave loans to borrowers who did not qualify for market interest rates loans because of their poor credit history or their inability to prove that they had enough income to support the monthly payments on the loans (Krinsman, 2007). Hence, the use of housing loans such as subprime mortgages- ARM to finance house purchase, have raised concern about the ability of borrowers to repay the loans if interest rates rise (Krinsman, 2007).
In March 2007, the Mortgage Bankers Associations declared that 13% of subprime borrowers were defaulting on their payments by 60 days or more (Krinsman, 2007). The collapse of the subprime mortgage industry was due to the higher than expected home foreclosure rates with 25 subprime lenders declaring bankruptcy. For example as of April 2007, the New Century Financial, which was the largest subprime lender in the US had liabilities exceeding $100 million (Krinsman, 2007). The US housing
market bubble reached its peak between 2005 and 2006 and finally burst in July 2007, leaving the US housing market with a subprime loan crisis (Smith & Smith, 2006). The contagion of the subprime lending crisis spread from the US market to other countries, such as Australia, Canada, China, France, India, Ireland, Italy, Korea, Russia, Spain and the UK (Schiller, 2007). For example, MacQuire Bank in Australia declared losses of 25% in their two bonds, which were invested into senior loans and apply leverage. Similarly in Taiwan, the Taiwan Life Insurance Company also announced a loss on securities which were backed by subprime mortgages. Shin Kong Financial Holding Company, which owns the third largest life insurer in Taiwan, also reported to have invested as much as US$356 million in collateralized debt obligations in subprime mortgages in the US. In China, the Bank of China also reported a significant loss of $9 billion on US subprime securities, which claimed the two hedge funds of the Bear Stearns Company (Lim, 2008).
The real estate market is described as inefficient and imperfect compared with other financial markets due to the characteristics of real estate properties such as fewer transactions, fewer participants, less liquidity and supply rigidities (Kang & Gardner, 1989). These characteristics are believed to contribute to the deviation of the real estate markets’ price from its fundamental values and hence to the creation of a price bubble or boom in the real estate market (Xia & Tan 2007).
The bubbles are described by economists as events which are unstable and unpredictable (Kritayanavaj, 2008). In real estate research, the concept of bubble is defined as an unusually sharp rise (deviation) in the asset price at the extraordinary high levels from the market fundamentals (Kritayanavaj, 2008). Market fundamentals are defined as an uncodified set of variables that help to determine an asset’s price which include the current values, dividends, and expectations about that asset’s value in the future’ (Garber, 2000, p.4). The fundamental variables which often influence house prices are interest rates, income level and inflation (Shiller, 2001).
In the real estate market, the buyer of a property is prepared to pay a price which he/she thinks is similar to the ‘fundamental’ values based on two criteria; the information on rental flows and the expected changes in the future price of the property (Xia & Tan, 2007). Therefore, people’s expectation of future house prices
changes during different economic conditions such an expansion (boom) and recession (bust).
During a boom or rising market, residential properties sell quickly at values near to or higher than the seller asking price (Genesove & Mayer, 2001). However, in a decreasing property market, the average time taken to sell a residential property is longer due to the lower asking price (Genesove & Mayer, 2001). This was evident in Perth’s property market. During the boom period in 2005, houses in Perth took 25 days to sell. However, in 2008, the average time to sell a house in Perth was 62 days due the decreasing price in Perth’s property market (www.myrp.com.au).
At present house price bubble crises are occurring frequently in most housing markets. However, today’s house price bubbles differ from those of the past. To better understand the current house price bubble, this study describes two historical bubbles events one in Florida, US (1929) and the other in Japan (1989).
In 1920, the prosperity of the US economy allowed people to invest in property market. Due to an outstanding marketing strategy, real estate in Miami, Florida went into a ‘boom’ phase for several years (Allen, 1931). According to Bordo (2005), the Florida land boom indicated a real ‘displacement’ stage in the Keynes-Minsky-Kindleberger model. Furthermore, the boom and burst of Florida real estate is believed to have been caused by speculative bubbles with the American middle class people saw Florida as a wonderful residential place (Galbraith, 1954).
However, in spring and summer of 1926, the boom in the Florida property market ended with the busting of the bubble caused by the sinking of a Danish warship in Miami harbour and a hurricane that destroyed the Biscayne Bay projects (Allen, 1931). Theses events directly contributed to a higher cost of living in Miami. Other factors such as the oversupply of residential housing in Florida and the changes in residential investors’s perceptions of the Florida economy caused residential prices to decreased and burst (Galbraith, 1954).
Cargill et al. (1996) describe the Japanese economy in 1986 as a ‘bubble economy’ due to higher appreciation of the Japanese yen and easy mortgage financing. After World War II, Japanese people were encouraged to save their income for the future development of their nation. The large amount of savings in Japanese banks caused the Japanese economy to ‘boom’ with development in the banking sector leading to cheaper financing costs, a trade surplus and a stronger yen. During this period, Japan experienced the most inflated property prices in the 20th Century with asset prices doubling and then tripling within few years (Cargill et al., 1996).
The Japanese bubble peaked with a rumour about the higher cost of land beneath the Imperial Palace in Tokyo. The land was assumed to cost more than the state of California. By 1989, Tokyo’s Giza district had recorded the highest price in Tokyo’s real estate at U.S$1.5 million per square meter (Cargill et al., 1996). Asset prices in Japan finally came down in the first half of the 1990s as result of the declined in Japanese stock prices by 60% from 1990 to August 1992 and land prices by half from 1991 to 1995 (Cargill et al., 1996). This period is known as the bursting of the bubble economy in Japan (Cargill et al., 1996).
The collapse of the Japanese economy occurred gradually as many companies, particularly in sectors related to real estate, were left with large debts. For example, a total of US$ 9 trillion was lost due to decreased property prices and a 65% decreased in property prices was recorded between 1991 and 2005 (Cargill et al., 1996).
The US subprime crisis and the historical bubbles of Florida, US and Japan have shown that the asset price bubble can grow rapidly and the cost of the bubble bursting can be extremely expensive for the economy (Belke & Wiedmann, 2005). Therefore, it would be of great interest for this study to examine housing market, focusing on price bubbles to the case study of Malaysia in order to reduce the potential harm caused from booms to bursts of house price in the Malaysian economy.
1.1
Background of the Study
The real estate market has been linked to the productive sector of the economy as it offers different types of input to different sectors (O’Flaherty, 1994). For example, the property market, which is part of the real estate market has constituted 30% of job creation in the US economy since 2001 (Economist 2005). In addition, real
estate or property assets consist of over half of the world’s invested wealth (51.5%) (Wallace, 1990). With its increasing share in the national economy, the property sector is an important provider of economic development (Liu et al., 2004).
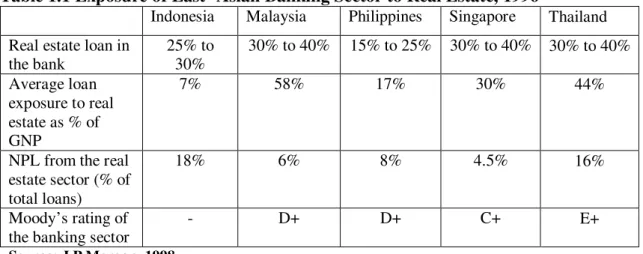
According to Ibbotson et al., (1985), approximately 45% to 75% of the wealth in most developing countries was generated through the real estate market. For example in Egypt the contribution of real estate sector amounted to $75 billion of the Egypt’s’ GDP (De Soto, 1997). In East-Asian economies, the high exposure of the banking sector in real estate markets indicates that real estate generates profits to the banking sector through mortgages (see Table 1.1).
Table 1.1 Exposure of East -Asian Banking Sector to Real Estate, 1996
Indonesia Malaysia Philippines Singapore Thailand Real estate loan in
the bank 25% to 30% 30% to 40% 15% to 25% 30% to 40% 30% to 40% Average loan exposure to real estate as % of GNP 7% 58% 17% 30% 44%
NPL from the real estate sector (% of total loans)
18% 6% 8% 4.5% 16%
Moody’s rating of the banking sector
- D+ D+ C+ E+
Source; J.P Morgan, 1998.
Table 1.1 shows the exposure of the banking sector to the real estate market in Indonesia, Malaysia, Philippines, Singapore and Thailand prior to the 1997 Asian financial crisis. Among the countries which were reported to have higher real estate loans in the banking sectors were Malaysia, Singapore and Thailand. The excessive bank lending in the real estate sector for these countries was due to the expectations of investors in the strong growth of the real estate market (Kallberg et al., 2002). For example, Koh et al., (2006) found that in the mid-1990s the main factor contributing to the real estate price bubble in Thailand and Malaysia was the lending sector. The over-lending in the real estate market (Allen & Gale, 2000) and the moral hazard problems (Quigley, 1999) in East- Asian financial institutions were other factors that caused price bubbles in the property market in East-Asian countries.
Quigley (2001) argued that the banking practices (which induce moral hazard) and the undeveloped market for real estate property in Asian countries are possible factors which contributed to the 1997 Asian financial crisis. In Malaysia, the use of collateral in every commercial mortgage loan induces a moral hazard problem due to the added incentive for a customer to build an appreciating market in order to borrow funds for further expansion (Quigley, 1999). Since real estate property is the only form of collateral requested by the bank, people tend to misuse it for personal gain.
The house price indexes in several Asian countries were reported to be volatile due to the impact of the 1997 Asian financial crisis (see Table 1.2 and Figure 1.1). According to Liow and Ooi (2004), the investment return from real estate in East Asia countries was affected by higher volatilities recorded in the house price indexes during the 1997 Asian financial crisis period (see Table 1.2).
Table 1.2 House Price Indexes movement during and after the Asian Financial Crisis for selected Asian Countries
Country During crisis period After crisis period
Hong Kong -61.34% (1997-2003) +60.72% (2003-2005) Philippines -56.20% (1997-2000) +14.11% (2004-2005) Indonesia -48.71% (1995-1999) +13.59% (1999-2005) Singapore -45.57% (1996-1998) +20.31% (1997-2001) South Korea -20.31% (1997-2001) +24.28% (2001-2003) Thailand -19.54% (1997-1999) +29.34% (1999-2006 Malaysia -18.78% (1997-2006) +10.70%(1999-2005) Source: Global Property Guide report (www.globalpropertyguide.com)
Table 1.2 indicates that the Hong Kong and Philippines housing markets were most affected by the Asian financial crisis. In Hong Kong, the house price index decreased by 61.34% and in Philippines by 56.20%. Higher volatility in the Hong Kong housing market was caused by the availability of residential land, the monopolization of the market by a few real estate developers and the fact that the Hong Kong public housing sector is one of the largest housing market in the world (Global Property Guide, 2009). For the Philippines, the decrease in house price index was caused by high transaction costs in buying and selling property assets (16.23%- 23.75%) and the high amount of housing stock available in the market due to less demand from professional expatriates as the global economic recession took hold (Global Property Guide, 2007).
In the post crisis period, the Hong Kong property market, which was reported to have had the highest decrease in the house price index, had a fast recovery with a 60.72% increase in the house price index recorded between 2003 and 2005 (Global Property Guide, 2007). This was followed by Thailand with increase in house price indexes of 29.34% between 1999 and 2006. Although the Malaysian house price index decreased by 18.78% during the Asian financial crisis (1999 to 2006), the recovery process has been slow as the house price index only increased by 10.20% between 1999 and 2005 (Global Property Guide, 2007).
Figure 1.1 illustrates the house price indexes for selected Asian countries with 1995 as the base year. The period covers 1995 to 2007 with a gradual movement of house price indexes in Malaysia, Thailand and Indonesia during the post-crisis period (1999 onwards). The house price index moves differently during different economic conditions such as expansion/boom, during crisis period and recession/burst (post crisis period).
Figure 1.1 Real House Price Indexes for Asian Countries (1995=100)
Source: Global property report (www.globalpropertyguide.com)
All house price indexes showed volatile movement during the 1997 Asian financial crisis. Hong Kong, Indonesia and the Philippines recorded the most decreased value in house price indexes. In the post crisis period, most of the house price indexes moved along the range of less than 100 basis points index, except for Thailand. The recovery of Indonesia house price index is far behind other countries. This is due to
the failure of the IMF stimulation packages, designed to restore the Indonesian economy after the Asian financial crisis (Koh et al., 2005).
According to Renaud et al., (1998) financial crises can also be associated with business cycle downturns as the countries which are most affected by the financial crises go through a series of ‘unfavorable events’ in their financial markets. This includes a collapse in property prices, a weakening of the banking systems, volatility in the exchange rates and the bursting of business cycles (Herring & Wachter, 1999). These events took place in most of the East-Asian countries during the financial crisis from 1997 to 1999.
The real estate market was believed to be the main factor, which triggered the Asian financial crisis in the Thailand, Philippines, Indonesian and Malaysian economies (Liow, 1998). Furthermore, the collapse of land prices in Indonesia and Thailand also contributed to the 1997 Asian financial crisis (Mera & Renaud, 2000).
The impact of the Asian financial crisis on the Malaysian housing market was less damaging than in other Asian countries (see Figure 1.1). Figure 1.2 shows the movement of the nominal and real house price index (MHPI) in Malaysia. The MHPI, which consists of 70 sub-indices, measured the long-run trend in Malaysian house prices and evaluated the condition of Malaysian housing market (Valuation and Property Service Department of Malaysia). The 1997 Asian financial crisis depressed the Malaysian property sector as the market was significantly affected by the substantial devaluation of the Malaysia Ringgit (RM), the outflows of foreign capital, the emergence of financial and moral hazard problems in banking and financial institutions and the weakening in employment (Hwa and Keng, 2004).
In the first half of the 1990s, the Malaysian economy encountered strong economic growth and high asset inflation (Hwa and Keng, 2004). Malaysian real estate debt, as a percentage of GNP, was about 58% in 1996 (Renaud et al., 1998) and the growth in bank credits to the private sector, mainly in residential mortgage relative to the GDP growth, was about 40% prior to the crisis (Barth et al.,1998). Furthermore, the substantial inflows of foreign direct investments into Malaysia increased the demand
for real estate market with a 26% real price growth in 1991 and 18% real price growth in 1995 (Global Property Guide, 2007).
A report from the Malaysian Valuation and Property Services Department, (Malaysia Ministry of Finance 2002 and 2003) showed that at the peak of the property market in 1997, the total volume of transactions was almost 40% of the GNP but this dropped to 22% in 1998 during the Asian financial crisis. Furthermore, prior to the 1997 Asian financial crisis, the real estate market and other related sectors accounted for 20% to 30% of the Malaysian GDP growth (Jomo, 2001). The yields in the prime properties in Malaysia were low in the peak period, compared with other East-Asian countries, since many people were expecting higher returns on their investments by buying and selling real estate properties in a short period of time. This short-selling of real estate properties for capital gain purposes caused the Malaysian real estate market to become more volatile (Hwa and Keng, 2004).
Figure 1.2 Malaysian House Price Index, MHPI (1990=100)
Source: Global Property Guide (www.globalpropertyguide.com)
According to Talib (2000), a market analysis warned about the oversupply of condominium in the Malaysian urban areas in the early 1990s. However, due to the higher expectation of capital gains from buying and selling properties during the peak of Malaysia housing market (1990 to 1996), developers and investors seemed to ignore the warning. For example, prior to the 1997 Asian financial crisis, house prices in Damansara (Kuala Lumpur) were valued between RM1.5 million to RM2.5 million (Talib, 2000).
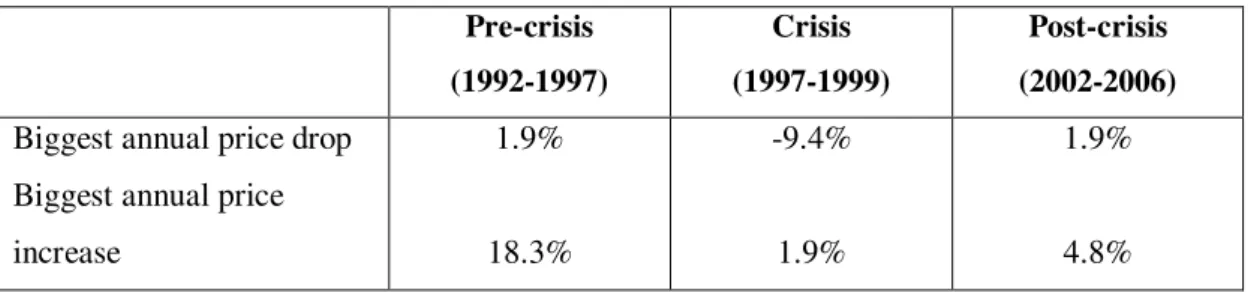
By 1997, the Malaysian property market was brought to a halt due to the currency and economic crises caused by the Asian financial crisis (Talib, 2000). The luxury property prices in Kuala Lumpur fell by 39% between 1997 and 1999 (Global Property Guide, 2007) and the MHPI plunged by 9.4% at the end of 1998. Further decline in MHPI is reported in 1999 by 2.3% (Rating Agency of Malaysia, 2007) (see Table 1.3).
The impact of the post Asian financial crisis includes the decrease in Malaysia’s GDP by 7.5%, a decrease in real estate transactions by 32% and the overall decline in real estate value by 48% (Jomo, 2001). The collapse of the real property market in Malaysia was due to the excess of supply and high vacancy rates, particularly in the high-density areas such as Kuala Lumpur, Selangor and the Klang Valley during the peak years of 1990 to 1996 (Talib, 2000).
Table 1.3 Annual price changes of MHPI in pre-crisis and post-crisis period.
Source: Rating Agency of Malaysia Report (RAM, 2007)
In 1999, surplus properties in the country were valued at 14% of GDP, a result of the economy rebounding (Jomo, 2001). There were roughly two million square feet of vacant office space in Malaysia and a surplus of about 90,000 housing units, mainly in multi-family condominium units (Malaysia National Valuation Property Statistic, 2000). The large quantity of residential stock (supply) showed that the government simulation packages and polices to build up real estate sector in Malaysia (see section 2.7) were successful. Furthermore, the MHPI rose by 17.34% from 2001 to 2005 (Global Property Guide, 2007).
In the post crisis period, Malaysian real estate transactions and bank lending to the real estate sector increased. For example, in September 2001, the amount of loans outstanding in the Malaysian real estate sector was approximately RM160 billion or
Pre-crisis (1992-1997) Crisis (1997-1999) Post-crisis (2002-2006) Biggest annual price drop
Biggest annual price increase 1.9% 18.3% -9.4% 1.9% 1.9% 4.8%
37% of all total loans. In addition, the service sector within Malaysian real estate industry contributed 12% in terms of GDP towards the growth of Malaysian economy in 2002 (Ministry of Finance Malaysia- Economic Report, 2002/ 2003).
Given the importance of the real estate sector in generating and stimulating higher growth in the Malaysian economy, this study attempts to investigate whether the Malaysian housing market experienced a house price bubble from 1990:Q1 to 2004:Q4. The study uses two approaches of single model and switching model. Thorton (2005), Kindleberger (1978) Minsky (1982) and Bordo (2005) each provide theoretical views on housing bubbles. However, none of the authors has attempted to construct effective techniques for examining house price bubbles, which can then be applied to the real economic situation and produce a rational explanation about the occurrence of a bubble.
The theoretical model developed in this study is inspired by the work of Abraham and Hendershott (1996) and their focus on the demand factors. The model is tested with several econometric techniques such as multivariate regression, Generalized Auto Regression Conditional Heteroskedasticity (GARCH) and regime-switching, MS-GARCH which can empirically examine the existence of bubbles in the Malaysian housing market.
1.2
Problem Statement
Bubbles can benefit an economy through reduced capital outflow and increasing investment inflow, but the cost of a bubble is expensive since it can expose a country to bubble-crashes and capital reversals (Caballero & Krishnamurty, 2005). The bursting of a bubble in the housing market can also generates a stronger negative impact on the economy compared with the stock market collapse due to the high transaction cost, illiquidity and heterogeneity of the housing characteristic (Helbling & Terrones, 2003). The bursting of a house price bubble can cause a slow adjustment process as house prices revert to their equilibrium price. As a result, inefficient houses prices will prevail in the market for longer period (Helbling & Terrones, 2003).
As the real estate market plunged, banks and financial institutions lost billions as a result of overexpansion to the real estate markets (Kallberg et al., 2002). This soon spread to other parts of the financial sector resulting in different types of financial problems such as a currency crisis, a banking crisis and a stock market crisis (Kallberg et al., 2002).
In Malaysia, more than 140 industries and 2.5 million people are engaged, either directly or indirectly in the construction and property sector (Liong, 2007). Therefore, given the importance of housing in the Malaysian economy, the impact of a bubble burst in the housing market will be large and significant. This however raises issue of how to model accurately the existence of bubble in house prices in Malaysia.
According to Pugh and Dehesh (2001), although the real estate bubble is not a new phenomenon, the impact of the recent US subprime crisis differed in size and magnitude compared to past bubbles crises such as those in Florida in 1920 and Japan in 1989. The authors explain that due to globalization and the interdependence of property and larger sectors of the economy, past theories and explanations used to explain bubbles are less reliable in today’s new era of bubble crises. Currently, there are fewer homeownership policies and fewer risk-taking activities by banks, which did not exist in historical bubbles crises (White, 2009).
Property markets, which are complex and contain unique characteristics such as durability, illiquidity and heterogeneity, require more than one theory to be used in their analysis (Pugh & Dehesh, 2001). Therefore, this study combines several theories such as price expectation theories, housing bubble theories and several statistical techniques to examine the existence of a house price bubble in the Malaysian housing market in the context of house price level (mean of house price) and house price volatility (variance of house price) with some economic fundamental variables.
From an empirical perspective, the issue of a house price bubble has generated interest from policy-makers, investors, buyers and sellers in the real estate market. The interest in house price bubbles is motivated by the direct impact of residential properties on other industries such as the construction sector, raw material markets and labour markets (Ball et al., 1996). For example, during a recession, a tight money policy forces the demand for houses to fall (Schnure, 2005) as more people are
reluctant to make higher purchases like houses. This action leads to a decrease in the value and quality of collateral prices to a credit crunch and to an increase in bankruptcy and foreclosure of financial mortgages and other related institutions (Kiyotaki and Moore 1997; Mishkin 2001, 2007).
In Malaysia, the decline of confidence in the market can be seen in the outflows of large portfolios and the decline in equity values and property prices in the post crisis period (Ito & Hashimoto, 2007). As a result, the corporate sectors, which used real estate assets as bank collateral, experienced huge losses that lead to an increase in non-performing loans (NPL) by 5.7% at the end of 1997 with an increasing peak of NPL at the end of 1998 (Ito & Hashimoto, 2007). The NPL in the Malaysia real estate sector includes the construction sector and the purchase of residential and non-residential property (Ito & Hashimoto, 2007). In December 2000, the amount of NPL reported from the real estate sector was RM1717 million, which is 39.2% of the total NPLs in the Malaysian banking sector (Ito & Hashimoto, 2007).
Modeling the housing market is important since the the volatility of residential properties, especially house prices, directly influences the levels of investment in other related sectors, such as the construction, raw material markets, labor markets and consumption (Ball et al.,1996). In Malaysia, the active promotion of the Malaysia My Second Home (MM2H) programme by Ministry of Tourism Malaysia has encouraged foreigners to purchase residential property with the annual growth of foreign property investments increasing 10% from 2003 to 2006 (Su, 2010). This figure shows the importance of monitoring and protecting the residential properties in Malaysia from a potential bubble price crisis.
As the real estate property market expands, household spending will also increase and this in turn will increase consumption and stimulate economic growth (Subhanji, 2007). The Housing Industry Association of Australia (HIA, 1993) also states that the income multiplier for housing is 2.4; where 100 million investments in housing development will increase income by 240 million. This proves that stabilizing the housing market is crucial for economic growth and living standards especially in a developing country like Malaysia.
The 1997 Asian financial crisis affected not only on homeowners but also on the rental sector in Malaysia. For example, in 1998, the leasing of residential in Malaysia remained slow and depressed due to the decline in corporate housing budgets and the number of expatriates renting the properties (Yong, 2000). The Malaysian housing market was also affected negatively by the increase in Malaysian economic uncertainty, strict mortgage financing by banks and financial institutions and higher mortgage rates (Yong, 2000).
1.3
Research Objectives
This study develops a dynamic model to investigate house price bubbles in the Malaysian housing market.
The objectives of this study are to:
• identify whether a bubble existed in the Malaysian Housing Market from 1990:Q1 to 2004:Q4 using three economic fundamentals (interest rates, inflation and income).
• examine the efficiency of the Malaysian Housing Market by looking at the period of adjustment (correction mechanism which diverts house prices back to equilibrium prices) during the post-bubble crisis.
• suggest a new technique to model house price bubbles in the Malaysian housing market using the single model approach (linear way) and switching model approach (nonlinear way).
• provide appropriate risk management techniques to manage housing bubble crisis in Malaysia.
1.4
Significance of the Study
The literature on bubbles has focused primarily on the financial markets. Only a few studies have been conducted on the real estate market (for example Abraham & Hendershott, 1996; Ayuso & Restoy, 2003 and Bourassa et al., 2001). Numerous studies on the real estate market have tried to establish a link between economic fundamentals and their effects on property prices (Mankiv & Weil 1989). However, the empirical findings of these studies have produced mixed results due to different approaches in modeling the fundamental variables.
Several private agencies have also conducted in-depth analyses of the housing market in Malaysia (newspaper, consultation agencies, RAM). However, the variables used were inadequate as they were based on the previous studies conducted in developed countries. Therefore, the outcomes of such research are less useful for policy implementation in Malaysia.
In Malaysia, research on the real estate market has been carried out in different areas, such as land regulation (Bertaud & Malpezzi, 2001), customer satisfaction (Chee & Peng, 1996), pricing of condominiums (Chin et al. 2001) the effect of regulation and tax on housing subsidy (Malpezzi, 1997) and the role of the state in the Malaysia housing market (Agus, 2002). There remains a lack of research on modeling the house price bubble in Malaysia. This study contributes several new insights regarding the Malaysia housing market. These insights include:
• Expanding the research of house price bubble to other countries, which experience house price bubble crises using the econometric techniques and theoretical framework of modeling house price bubbles.
• Increasing the awareness in housing market players (investors, sellers and buyers) of the house price bubble process and its impact on the economy.
• Providing a better picture of the Malaysian housing market and facilitate in understanding of the boom and burst process so that adequate preventive measures can be designed.
• Using a combination of the single model and regime-switching model in modeling house price bubbles. The techniques used in this study employ comprehensive modeling approaches, to examine the bubbles in Malaysian housing market such as the VAR/VECM model, GARCH and MS-GARCH (Markov-Switching-GARCH).
1.5
Organization of Thesis
This thesis consists of six chapters. Chapter One includes the introduction and background of the study, problem statement, research objectives and significance of the study. Chapter Two presents an overview of the real estate market in Malaysia. Chapter Three discusses the literature review on “bubbles” in housing markets and the
real estate cycle. Chapter Four elaborate on the proposed house price bubble model used in this study. Chapter Five discusses the data and methodology of the study and Chapter Six presents the analysis and findings. The conclusion and recommendations are presented in Chapter Seven.
Chapter 2
An Overview of the Housing Market in Malaysia
“Unlike some of its neighbors, Malaysia makes it fairly easy to buy property. Thailand, the Philippines, Indonesia and even Singapore all prevent foreigners from owning land, restricting them to buying apartments or to using leasehold arrangements..."
(Alex Frew McMillan, International Herald Tribune, August 2006).
2.0
Introduction
This chapter presents an overview of the Malaysian housing market. Section 2.1 provides a general background to Malaysia. Section 2.2 addresses the structure, characteristics, pricing and property cycles of the Malaysian housing market. The mortgage market and housing policy in Malaysia are discussed in sections 2.3 and 2.4 respectively. Other related issues such as capital control and policies to revitalize the real estate market in Malaysia are outlined in sections 2.5 and 2.6 respectively. Section 2.7 concludes the chapter
2.1
Background of Malaysia
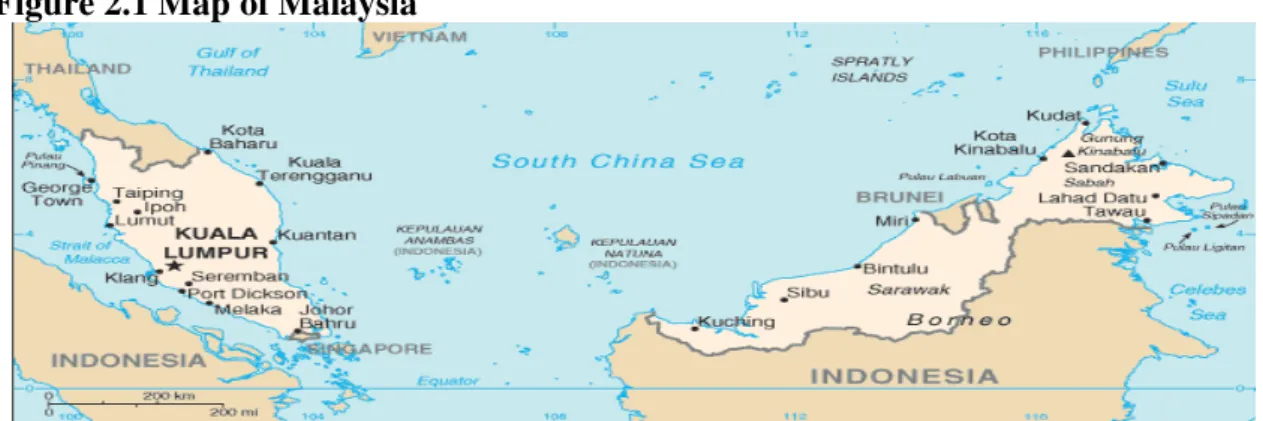
Malaysia has a total land size of 328,550 square kilometres and only 1,200 square kilometres of water. The country consists of two regions; Peninsular Malaysia (West Malaysia) and East Malaysia (see Figure 2.1) In West Malaysia, there are four regions; Northern (Perlis, Kedah, Penang, Perak and Georgetown, the growth centre),
Central (Selangor, Federal Territory of Kuala Lumpur, Negeri Sembilan, Melaka and Kuala Lumpur as the growth centre), Eastern (Kelantan, Terengganu, Pahang and Kuantan as the growth centre) and Southern (Johor and Johor Bahru, the growth centre)(Aslam & Hassan, 2003). As for East Malaysia, there are two regions; Sabah (Sabah and Federal Territory of Labuan and Kota Kinabalu, the growth centre) and
Sarawak (Sarawak and Kuching, the growth centre).
The country is located between the Indian Ocean and the South China Sea, sharing land boundaries with Indonesia, Thailand and Brunei (Zakaria, 1999). Based on the Malaysian population statistics as on January 2010, Malaysia has a population of 28.8 million people from different ethnic origins including Malay, Chinese and Indians
(Department of Statistics Malaysia, 2010). Approximately 51% of these people live in urban areas (www.aaph.net- Asian Association of Planning and Housing).
Figure 2.1 Map of Malaysia
Source: The World Fact book (www.cia.gov/library/publications/the-world-factbook/geos/my/htm)
The economic policies of Malaysia are based on exports and international trade. Malpezzi and Mayo (1997) describe Malaysia as a middle income developing country, with an average per capita income growth of 3%. During the period 1971 to 1990, the Malaysian economy grew at an average rate of 8% (Chamburi & Mohd Yusof, 1997) while the urban sector grew by 5% per year and the demand for housing increased by 7.1% (Malpezzi et al., 1997).
From 1990 to 1996, the Malaysian economy expanded rapidly with exports growing at an annual rate of 18%, which was 10% higher than the Gross Domestic Product (GDP) (World Bank, 1999). This growth created higher demand for capital investment into Malaysia, since more funds were needed to sustain the economic development and growth.
In early 1990s, the Malaysian economy expanded and attracted a huge foreign capital inflow due to the liberalization of financial markets and some reform in the real estate market (Kind & Ismail 2001). According to Glindro et al., (2007) during early 1990s, many Asian countries including Malaysia, experienced reforms in the real estate market. These reforms were the positive result of the liberalization in housing and financial markets. In Malaysia, the reformation of the real estate market could be seen in the innovation of investment instruments such as real estate investment trust (REITs), the development of a secondary mortgage market and other organizations related to real estate market (CAGAMAS and DANAHARTA) and the introduction of Islamic financing in the Malaysia mortgage market. All of these reforms have
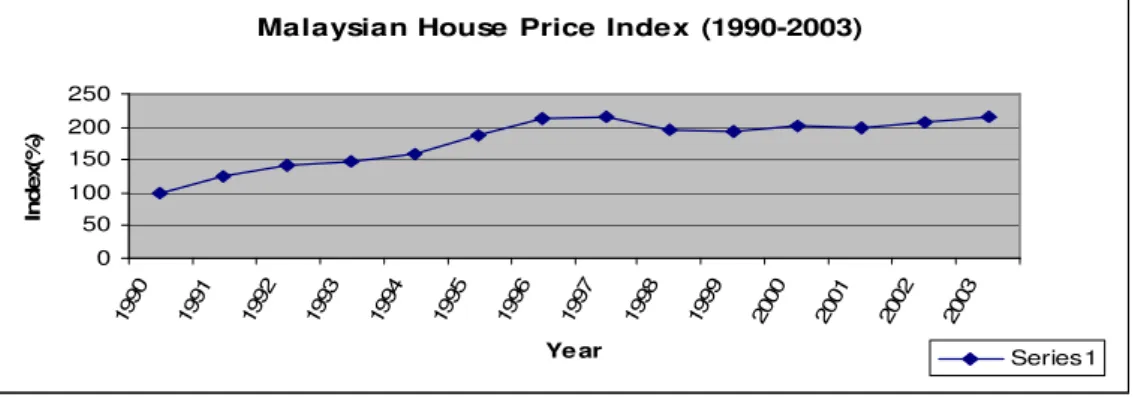
possibly improved the efficiency of the Malaysian housing market and led to an increase of housing prices and demand. This is evident in the two highest peaks recorded by MHPI in 1993 and 1995 (see Figure 2.3) which accelerated the formation of bubbles in the Malaysian economy (Kind & Ismail, 2001).
However, this expansion has created several drawbacks. For example, the inflows of foreign capital into Malaysia have imposed higher foreign debt on the Malaysian government where the debt was reported to be US$45.2 billion in June 1997 (30% was in short-term debt) (Kind & Ismail, 2001). Furthermore, the flows of foreign debt were invested in the stock market and the real estate market instead of economic productions such as land, labor and capital. The flow of this capital into the non-productive sector of the real estate market caused a boom in the real economic sector due to the temporary procyclical effects on both consumption and investment (Hui, 2009).
The expansion of investment and credit into the Malaysian economy has brought extraordinary growth in the real estate market and the construction sector. For example, the Malaysian Government has invested a large amount of capital in improving infrastructure and building ‘mega’ projects, such as, the Multimedia Super Corridor, the Malacca Strait Bridge, the Artificial Island Project and other projects which contributed to the overheated real estate market and construction sector (Han, 2008). In 1995, rental cost in Kuala Lumpur increased by 55% and house prices increased by 66%, while the vacancy rate increased from 5% in 1990 to 25% in 1998 (Han, 2008).
In 1997, the growth of Malaysian economy ended with the outbreak of the Asian financial crisis. The performance of Malaysian economy deteriorated with the decrease of the Kuala Lumpur Composite Index (KLCI) from 1077.3 points on June 30th 1997 to 594.44 points on December 31, 1997 and the devaluation of the Malaysian currency against the US dollar (Kind & Ismail, 2001). There was also a significant drop in the daily trading of the Malaysian real estate market by 37% in July 1997 as housing prices dropped sharply (Han, 2008).
2.2
Overview of the Malaysian Property Market
This section describes the property market in Malaysia. Understanding the characteristics and functions of the Malaysian property market may help to extend the assessment of house price bubbles in the Malaysian housing market. In Malaysia, property markets are categorized into residential, commercial (shopping complexes and offices), industrial (factory), recreational facilities, agricultural and resort and hotels (Awil, 2007). Residential property in Malaysia is in high demand with highest number of transaction recorded ever year (Malaysian Property report 2002). Table 2.1 shows the residential market relative to the total property market in Malaysia.
The residential property market is a model of a heterogeneous utility-bearing product consisting of a package of characteristics and structural attributes which are connected to the residential unit price (Mar Iman, 2006). The structural attributes are floor size (Mok et al., 1995) and number of rooms, bathroom and bedrooms (Linneman, 1980; Rodrigues & Sirmans, 1994). These attributes and other structural and external factors have a long and short-term impact on house prices (Morris et al., 1979; Kain & Quigley, 1970).
Yu (2004) describes a house as an untied commodity bundle that has various structural and spatial attributes. Basu and Thibodeau (1998) identified seven group of housing characteristic: improvement, accessibility, proximity, externalities, lot and land-used and time of data collected. These characteristics are further classified into two large groups by Can (1992): housing structural characteristics and neighbourhood characteristics. Yu (2004) found house attributes such as the number of bathrooms, air conditioning and floor sizes added value to houses in rich area compared with other suburban poor areas.
The property index for the Malaysian housing market which is the Malaysian house price index (MHPI) uses the hedonic model. According to Rosen (1974), the hypothesis underlying hedonic method is that goods (house price) are valued for their utility bearing attributes or characteristic. The MHPI, which uses the hedonic method, is able to capture significant determinants of house prices by taking into account both the spatial and structural attributes of housing (Yu, 2004).
Table 2.1 Percentage shares of residential markets from total property market in Malaysia from 1996 to 2005
Year Total Property
Transaction (in volume) Residential market (in volume) % of residential from total property market 1996 270,538 170,007 62.84% 1997 274,749 175,644 63.93% 1998 186,077 122,881 66.04% 1999 225,901 157,082 69.54% 2000 240,068 170,932 71.20% 2001 242,634 176,208 72.62% 2002 231,394 162,296 70.14% 2003 243,376 164,723 67.68% 2004 293,212 195,243 66.59% 2005 276,508 181,762 65.73%
Source: Property Market Report, various years.
According to the RAM report in 2007, the residential market which is made up of four million households, is the largest segment of the entire property sector and accounts 68% of total transactions in the Malaysian property market (see Table 2.1). The percentage share of the residential market has increased every year even in the post crisis period in 1998 (see Table 2.1). This shows that the Malaysian residential market, which makes up about two thirds of the total property transactions in Malaysia (Mar Iman, 2002) has a significant impact on the changes in Malaysian house prices. With a total value transaction of RM60 billion, or 20% of the country’s GDP, the Malaysian residential market is the largest market in the Malaysian property sector (Property Market Report, 2005).
Today, people have begun to acknowledge the importance of residential property as a basic necessity in a household’s overall wealth (Ting, 2004). As family income increases, purchasing a house is seen as fulfilling the basic need of a family (Shuid, 2003). This has forced many households to allocate a proportion of their savings or funds to own a house.
In Malaysia, people are reported to allocate one third of their income for housing investments such as paying rents or loan repayment (Mar Iman, 2002). Terrace or linked houses are the preferred choice (Ting, 2004) and constitute the majority of residential buildings in Malaysia. Approximately 57% of terraced houses were being built in 2002 (Kubota et al., 2005). These houses are reported to be the least risky asset compared to other type of houses in Malaysia (RAM, 2007). Other types of houses built in Malaysia are bungalow or detached houses, semi-detached houses and condominiums or apartments (RAM 2007).
2.2.1 The Characteristic of Malaysian Housing Market
Housing price is different from that of non-residential properties such as office, industrial or retail properties (DiPasquale & Wheaton 1996). Therefore, it is very important to understand the characteristics of the Malaysian Property Market before discussing bubbles in the housing market.
In Malaysia, there are two forms of property ownership; freehold and leasehold. With regards to leasehold title, the ownership of the land returns to the state authorities when the lease period expires (30, 60, 90 years but not exceeding 99 years) (National Land Code 1965). However, owner(s) of a leasehold property can make an application for renewal, subject to the state authority’s approval and a further payment of premium based on the current market value of the leasehold property. In addition, a leasehold property can also be transferred to another party, as long as the leasehold period has not yet expired (National Land Code, 1965).
In a freehold title, the owner can transfer the title to the next of kin or sell it to other people and the right of the land belongs to the new owner. For this reason, freehold properties are in high demand (60% of Malaysian property buyers) (RAM, 2007). The Rating Agency of Malaysia,(RAM) states that properties which carry freehold titles create more demand and are more liquid than leasehold properties (RAM, 2007). Table 2.2 shows that in 1991 approximately 85% of the properties in Malaysia were owner-occupied (RAM, 2007). In addition, the 1991 housing census showed that there were about 2.3 million people in Malaysia who were homeowners (Valuation and Property Service Department, 1998). This indicates that housing price stability in
Malaysia is very important as more people are home-owners as opposed to speculators.
Table 2.2 Housing ownership structure of selected East-Asian Countries
Country Malaysia Indonesia Thailand Philippines Singapore
Owner-occupancy 85% 95.9% 82.1% 71.1% 92% Rental rate 12.8% 4.1% 10.1% 10.1% 7.0% Others 2.2% n.a 7.8% 18.8% 1.0%
Year of census; Malaysia 1991; Indonesia 2001; Thailand 1996; Philippines 2000; Singapore 2005 Source; UN, National statistics various years.
Malaysian residential properties are built in different floor sizes and plot sizes. According to Mar Iman (2006), the standard land size of landed properties in the housing projects is between 1,200 and 3,000 sq. ft depending on the type of residence The standard size of land for single storey and double storey houses is between 100.3 sq meters and 174 sq meters, whereas for bungalow lots, the land area covers between 371sq meter and 929 sq meters (Mar Iman, 2002). The standard residential units are 22ft. x 70ft. and 25ft. x 65ft. for terraced houses and 45,000 sq. ft. for bungalows.
The price volatility of residential properties in Malaysia does not only depend on the type of properties but also on the location of the properties being built (RAM, 2007). Research by RAM indicates that the supply and demand dynamics for properties in less industrialized or developed states such as Kelantan, Kedah and Perlis which are different compared to the more industrialized or developed states such as Penang, Selangor, Federal Territory of Kuala Lumpur and Johor. Higher demand in several metropolitan cities such as Kuala Lumpur and its surrounding areas is due to the increase in urbanization since independent years (McGee, 1976, 1982). For example the Federal territory of Kuala Lumpur is occupied by more than 5 million people (Statistic of Malaysia, 2008). Moreover, the existence of larger metropolitan areas such as Shah Alam and Bandar Baru Bangi in the state of Selangor contributes to high urban development which attracts investment and people to these bigger states. This show that the population in more industrialized or developed states creates a greater demand for houses (high liquidity).
There has been some variation in demand for different types of property based on the changes in absolute price and the timing of the changes, but the movement of the property market in Malaysia has displayed a common upward trend (RAM, 2007). Detached houses and high-rise units have shown vast changes in the last five years with 21.5% and 19.5% of changes occurring in their prices respectively (see Figure 2.2). This has been followed by the semi-detached houses (19.1%) and terraced houses (10.6%). In term of price stability, the detached houses are reported to have displayed the greatest volatility while the least volatile type of residential property during the pre-crisis period (1989 to 1997) and post-crisis period (2000-2006) has been terraced houses. Figure 2.2 shows the overall price changes in Malaysian houses according to type (terraced, semi-detached, detached and high rise-units) from 1990 to 2003.
Figure 2.2 Annual percentage changes in price of Malaysian houses from 1990 to 2003 -20 -15 -10 -5 0 5 10 15 20 1990 1991 1992 1993 1994 1995 1996 1997 1998 1999 2000 2001 2002 2003 Terraced houses Semi-detached Detached High-rise unit
Source: Property Market Reports, Valuation and Property Services Department (JPPH), various years.
Although the property market in Malaysia is growing rapidly, information about the market is very limited and difficult for access by local and foreign customers to access (Nasir, 1999). Reasons for this difficulty include the confidentiality and tight control policies adopted by the Malaysian government and relevant agencies in the real estate market (Nasir, 1999).