Jenaer Schriften zur Wirtschaftswissenschaft
Debt Relief and Changing Governance
Structures in Developing Countries
Andreas Freytag und Gernot Pehnelt
31/2006
Arbeits- und Diskussionspapiere
der Wirtschaftswissenschaftlichen Fakultät
der Friedrich-Schiller-Universität Jena
ISSN 1611-1311
Herausgeber: Wirtschaftswissenschaftliche Fakultät Friedrich-Schiller-Universität Jena Carl-Zeiß-Str. 3, 07743 Jena www.wiwi.uni-jena.de Schriftleitung: Prof. Dr. Hans-Walter Lorenz [email protected] Prof. Dr. Armin Scholl [email protected]Debt Relief and Changing Governance Structures in
Developing Countries
ANDREAS FREYTAG andGERNOT PEHNELT*
October 2006
Preliminary version
JEL codes: O17, O19, O29
Key words: debt relief, HIPC, development, governance, institutional quality
Abstract
In this paper we empirically discuss the question whether or not debt relief in the past fifteen years has been economically rational. Analysing the determinants of debt relief our results suggest that governance quality did not play a role in the decision of creditor countries to forgive debt in the 1990s. Furthermore, even the actual debt burden of highly indebted poor countries had not been crucial for the decision whether or not debt forgiveness was granted. Rather, debt relief followed a strong path dependence: those countries whose debt had been forgiven in the first half of the 1990s have also been granted debt forgiveness in the second half of this decade. However, this allocation pattern changed at the beginning of the 21st century, where the path
dependence was less strong and at least some dimensions of governance quality have been taken into account by donor countries.
* Friedrich-Schiller-University of Jena, Chair of Economic Policy, Carl-Zeiss-Str. 3, D-07743 Jena, [email protected], [email protected]. We gratefully acknowledge helpful comments by Frederik Erixon, Simon Renaud, Kristin Reichardt, Christoph Vietze and Hans-Juergen Wagener.
Debt Relief and Changing Governance Structures in
Developing Countries
1
I
NTRODUCTION
During the last decade, developing countries have received a huge amount of debt relief. In the first place, the objective of debt relief programs is to reduce the external debt of severely indebted poor countries to a ‘sustainable’ level. The alleviation of the debt burden for developing countries is supposed to improve the resource position of these countries and to enhance investments and further economic growth and devel-opment. There have been high expectations that debt reduction initiatives, especially the Heavily Indebted Poor Countries Initiative (HIPC) and the Enhanced HIPC Initiative (HIPC II), launched by the IMF and the World Bank in 1996 and 1999 respectively, will free resources in HIPCs for spending for the sake of the poor.
In this paper we analyze the political and economic determinants of debt relief for highly indebted poor countries. This is a relevant topic not only because debt relief implies that scarce public funds in creditor countries are used, which should always be done carefully and after sound cost-benefit analysis. Moreover, bailing out broke countries that became highly indebted mainly because of inappropriate and irrespon-sible policies could create negative incentives and cause serious problems of moral hazard.
For this purpose we first ask whether or not debt relief can be expected to be effective in order to stimulate economic growth as well as – since good governance and decent institutions have been proved to be of special importance for economic growth and development – to improve governance structures in these countries. After answering this question, we concentrate on the central topic of this paper, namely the question of whether debt relief has been provided in favor of countries that have shown decent governance structures or at least improvements of their institutional settings. There is a rich literature dealing with the determinants of debt relief. The contribution of this paper is to analyze the change in these determinants due to new public insights into the nature of governance structure.
We distinguish three sub periods of the time span between 1990 and 2004 to see whether or not governments of creditor countries have taken into account the govern-ance structures and institutional quality of debtor countries. We are also interested in the question whether or not donor behavior changed after the low impact of debt relief programs on economic performance and governance structures in the 1990s had become obvious.
The remainder of the paper is structured as follows. In the second section, we give an overview about debt relief programs that have been initialized since the 1980s. After that we present the literature covering three important issues related to debt relief, namely the rationale, the effectiveness as well as the determinants of debt relief. In section 4, we briefly introduce our theoretical hypotheses, which we want to test empirically. Section 5 is dedicated to an overview about the data and the presentation of the results of the empirical analysis. Section 6 concludes our findings.
2
D
EBT
R
ELIEF
P
ROGRAMS IN RECENT HISTORY
Although the world had seen earlier concerns about the debt situation in developing countries resulting in some debt relief initiatives like the Pearson Report in 1969 and the Retroactive Terms Adjustment (RTA) program in 1978, the debt problem became apparent in 1982 with Mexico defaulting on its debt payments. This event marks the beginning of the debt crisis of developing countries. In the subsequent years, various debt relief and restructuring programs had been introduced, mainly to prevent further defaults of debtors through the provision of new loans and debt rescheduling. Most of the debt restructuring programs of the 1980s, such as the Baker Plan and the Brady Plan, bailed out private sector creditors and allowed commercial banks to write off some of the active debts by rescheduling them, converting them into bonds (e.g. Brady-Bonds), or “selling” them to the IFIs. Some authors claim that the main aim of these plans was to avert a financial crisis in the west (PETTIFOR/GREENHILL 2002, S.13). Nevertheless, the Brady Plan was successful with respect to the problem of debt overhang (ARSLANALP/HENRY 2005). Since the early 1990s, however, official debt is in the centre of the political activity. The Paris Club, a group of creditor countries with 19 permanent members, agreed on various debt cancellations and rescheduling programs,
focusing on the rescheduling of ODA debt and a partial cancellation of Non-ODA debt.1 The so-called London Terms were formulated in 1991 and provided up to 50
percent reduction of Non-ODA debt. The Paris Club agreements contained some rather vague clauses that took a country’s need for debt forgiveness or rescheduling into account and should have stipulated adjustment programs in the creditor countries.2
With the introduction of the Cologne Terms in 1999, the Paris Club creditor countries accepted to raise the level of debt cancellation for the poorest countries up to 90 percent or even more if necessary. This debt forgiveness is taking place within the framework of the initiative for Heavily Indebted Poor Countries (HIPC). Cologne terms are implemented on a case by case basis. To qualify for these terms, debtor countries have to show continuing strong economic adjustments (PARIS CLUB 2006b). Given these terms, one could expect that the debt relief plans implemented by the Paris Club in recent history stipulated sound policies in debtor countries and therefore contributed to economic growth in these countries.
However, the debt relief initiatives until the mid-1990s did not solve the debt problem. Many developing countries, particularly in Sub-Saharan Africa, rather experienced a dramatic rise of their external debt over two decades. The constant difficulties to meet their debt obligations can be traced back to several factors, including exogenous shocks, such as the deterioration in the terms of trade, civil strife, a lack of sustained adjustment or the denial of structural reforms, improper lending behavior of creditors, and the lack of prudent debt management policies by debtor countries (BOOTE/THUGGE
1997, p. 4). In the face of the fact that the traditional mechanisms for dealing with the debt problem of the HIPC could not solve this problem sufficiently, in 1996 the Heavily Indebted Poor Countries initiative was launched by the IMF and the World Bank, focusing on the debt burden of the poorest countries in the world by reducing the multilateral debt of these countries. The main goal was to reduce debt burdens to a sustainable level, which was defined as a debt-to-export ratio within the range between
1 All in all, the agreements reached by the members of the Paris Club since the mid-1980s covered an amount of more
than $500 billion so far. Of course, the amount of the debt that had been actually forgiven falls way behind the amount negotiated.
2 “Debt treatments are applied only for countries that need a rescheduling and that implement reforms to resolve
their payment difficulties. In practice conditionality is provided by the existence of an appropriate programme supported by the IMF, which demonstrates the need for debt relief.” (PARIS CLUB 2006a)
200 to 250 percent, and a ratio of debt service to exports within a range of 20 to 25 percent, all in net present value-terms (NPV). For the first time, this initiative included the main multilateral creditors such as the IMF, the International Development Association (IDA), and the African Development Fund (AfDB). The HIPC initiative introduced some guiding principles regarding a country’s eligibility for debt relief. To be considered for HIPC Initiative assistance, a country must face an unsustainable debt burden, beyond traditionally available debt-relief mechanisms, and establish a track record of reform and sound policies through IMF- and IDA-supported programs. In late 1999, the HIPC initiative was expanded in order to provide deeper and more rapid debt relief to a larger number of countries. The enhanced HIPC initiative (HIPC II) integrated debt relief plans into a comprehensive poverty reduction strategy requiring Poverty Reduction Strategy Papers (PRSPs) on a broad-based participatory process as a necessary condition to qualify for debt relief. With this approach, the global donor community for the first time took governance structures in the debtor countries (at least implicitly) into account. Furthermore, the thresholds for sustainable debt levels were redefined and lowered to a debt-per-export ratio of 150 percent and a debt-to-revenue ratio of 250 percent. The eligibility of a country is proved in a staged process. If a country is deemed eligible, the debt relief is delivered at the so-called completion point. During the period of the initial decision point and the completion point, the progress of the country with respect to institutional reforms and structural adjustments is under observation and supported by the IMF and the World Bank.3 In practise the
time span between HIPC II and the completion point is rather large (IMF/IDA 2004, Annex III). Some countries still wait for reaching the completion point.
Contrary to some traditional debt relief programs the HIPC initiative and especially the HIPC II initiative emphasize explicitly on poverty reduction and the institutional dimensions of economic development in low-income countries. Once the awarding procedures of multilateral creditors and the Paris Club members really followed these conditions, one could expect that debt relief since the late 1990s has been provided almost exclusively to countries that fulfilled these conditions, which would be a good sign with respect to the expected success of recent debt relief programs.
3
T
HE
L
ITERATURE
3.1
T
HER
ATIONALE OFD
EBTR
ELIEFOne popular efficiency argument for the provision of debt relief is the so called ‘debt overhang’.4 It has been stated that highly indebted countries benefit very little, if ever,
from the returns on any additional investment because of the debt service obligation. Large debt obligations – so the underlying argumentation – can be seen as a high tax on investment, policy reforms and development because a significant part of the gains from economic adjustment would go to foreign creditors and not to the country itself. Put another way, the higher the stock of external debt, the higher are the opportunity costs of current sacrifices for the sake of future economic growth. This is the basis for the hypothesis of the debt Laffer curve which refers to the relationship between the size of a country’s debt and the value of repayments. The net present value of debt repayments increases with the face value of total debt up to a certain threshold. Beyond this level of indebtedness a higher face value of debt is associated with lower efforts and investments, lower economic growth and therefore with a lower (expected) net present value of debt service. Creditors should therefore provide a debt relief to countries with large stocks of external debt in order to reduce future debt obligations. This would increase the share of any marginal gains from economic adjustments that goes to the debtor country and create incentives to make these adjustments (CORDEN
1991). This strategy could end up in a win-win-situation by not only easing the debt burden of debtors but also increasing future repayments to the creditors.5 Debt
overhang is also supposed to depress growth by increasing private investors’ uncer-tainty about actions the government might take to meet its debt-servicing obligations, such as a sudden and stark increase of money supply causing inflation (CLEMENTS/BHATTACHARYA/NGUYEN 2005), or distorting future tax policies.
4 The concept of debt overhang was initially introduced by SACHS (1983). See also SACHS (1989). KRUGMAN (1988)
defined debt overhang as a situation in which the expected repayment on foreign debt falls short of the contractual value of the debt.
5 TENGSTAM (2006) provides a multi-period model to show that debt relief stimulates adjustment even in the absence
of an initial debt overhang and questions the hypothesis that a too generous debt relief might reduce the adjustment efforts of developing countries.
Several studies have examined the existence of a debt overhang in developing coun-tries. Despite a few ambivalent and mixed results6, the empirical literature mainly
provides support of the debt overhang hypothesis. DESHPANDE (1997) finds the debt
overhang effect to be valid for a small sample of 13 countries in the period from 1971 to 1991. PATTILLO/POIRSON/RICCI (2002) using panel regressions for 93 developing countries over the period 1969-1998 suggest that debt levels beyond 160-170 percent of the exports or 35-40 percent of GDP are detrimental to growth. BHATTACHARYA/ CLEMENTS (2004) estimate the debt overhang threshold at about 50 percent of GDP for the face value of external debt and about 100-105 percent of exports for the net present value of external debt based on data over the period 1970-1999 for a group of 55 low-income countries. IMBS/RANCIERE (2005) provide non-parametric evidence supporting the existence of a debt Laffer curve among developing countries. Their results indicate that debt overhang occurs when the face value of debt reaches 60 percent of GDP or 200 percent of exports. Since both theoretical literature and empirical evidence suggest that huge debt burdens tend to be associated with low investment and economic growth in low-income countries, debt relief might have a stimulating effect on invest-ment and economic developinvest-ment.
This justification of debt relief seems to be quite convincing at first glance. But the clincher with respect to the resource position of low-income countries and therefore to the capacity to pay its obligations – at least in the short run – and to invest is still the net resource transfer from donors, including bilateral and multilateral aid which is of special importance for HIPCs. Since the reduction of multilateral debt is partly financed by bilateral donors (e.g. through their contributions to multilateral funds), and these contributions usually come from the same political reservoir, namely the donors’ aid budget, there might be a trade off between debt relief and official devel-opment assistance (BIRDSALL/CLAESSENS/DIWAN 2002, p. 10). As MARTIN (2004) suggests, there is evidence of aid diversion to fund debt relief. However, the empirical literature on additionality of debt relief does not provide strong support for these
6 CLAESSENS (1990) generally confirms the existence of the debt Laffer curve in a sample of 29 highly indebted
Sub-Saharan African countries but found only a handful of countries being on the “wrong” side of the inverted U-curve. HANSEN (2001), recognizing a negative impact of the initial stock of external debt and debt service on growth for 54 developing countries, stressed that these relationships become insignificant once some policy indicators are added to the regression model.
qualms about debt relief. NDIKUMANA (2003) investigating the relationship between debt alleviation programs and official development assistance (ODA) does not find a direct causal link between the volume of debt relief or debt forgiveness respectively and the volume of ODA disbursed, although the total supply of ODA and grants declined in the 1990s. HERNÁNDEZ/KATADA (1996) find a slight crowding-out effect between ODA debt relief and new lending from bilateral resources in a sample of 32 Sub-Saharan African countries during the period 1989-1993. While there is at least no clear cut empirical evidence of a crowding out of ODA or other sources of finance by debt relief, there is no evidence for additionality either. In the face of very little, if not zero additionality, the question becomes whether it is better to have debt relief or more conventional forms of aid (BIRD/MILNE 2000, p. 201).
Furthermore, taking the net resource transfer given to highly indebted low-income countries into account, the incentive argument becomes more complex than in the traditional debt overhang theory. If the net resource transfer from donors is positively related to a country’s level of indebtedness, the (dis)incentive effects of initial external debts and debt services to invest and to repay the credits may switch to the opposite direction. BIRD/MILNE (2003) show that higher levels of outstanding debt are usually associated with higher levels of net resource transfers from official sources. This fact contradicts the hypothesis of debt overhang: countries that increase their capacity (and willingness) to pay are expected to receive less future resource transfers. The disincen-tives to introduce promising but costly adjustments do not occur because of the so called debt overhang but because of the tax on development, which stems from the declining share in aid budgets given to relatively successful developing countries. The findings of CORDELLA/RICCI/RUIZ-ARRANZ (2005) give in a way support to this hypothesis. The authors found that in HIPCs indebtedness did not affect either investments or growth. In their findings the so called debt irrelevance threshold is situated between 50 and 60 percent of GDP.7 One explanation is that severely indebted
low-income countries benefit most from the resource transfer provided by donors.
7 The authors suggest that at intermediate levels of debt, there is a negative relation between the degree of
indebtedness and economic growth. According to their study, the debt to GDP overhang lies between 25 and 40 percent. Once the debt irrelevance threshold is reached, this relation becomes nil.
BIRDSALL/CLAESSEN/DIWAN (2002) suggest that net transfers are larger in high debt and especially in the high multilateral debt regimes. Countries with high debt ratios and high debts due to multinational institutions have received larger net transfers. This can be interpreted as a debt subsidy rather than a debt tax.
Considering these theoretical and empirical findings, on the one hand, high debt burdens seem to be detrimental to economic growth in low-income countries. On the other hand, because of the crucial role of net transfers especially through bilateral and multilateral aid and because of ambivalent incentive effects, it is far from sure that debt relief alone can enhance further economic growth in highly indebted poor countries. In the next sub-section we will give a brief overview of the existing literature on the effectiveness of debt relief.
3.2
T
HEE
FFECTIVENESS OFD
EBTR
ELIEFAny debt relief would be economically irrational if the success was low. Therefore, future policy measures should be based on careful analysis with respect to effective-ness (and efficiency8). Is debt relief a proper instrument to reduce debt overhang, to
diminish poverty, to increase growth and to improve governance structures? HERNÁNDEZ/KATADA (1996) analysing grants and ODA debt forgiveness to 32 Sub-Saharan African countries reveal that debt relief did not reduce the debt overhang of Sub-Saharan African countries at all, but that the nominal debt stock of many countries even doubled between 1984 and 1993 and their arrears increased dramatically. The authors suggest that it may be the case that the ODA debt which had been forgiven was not being serviced, indicating that debt relief activities have not freed additional resources for the recipient countries. They also find that receiving more debt relief did not increase a country’s import capacity. Some countries that have received less debt relief have been able to expand their imports more than countries that have received debt relief to a substantially larger extent. This shows that debt relief does not free resources because the written-off debt has not been serviced.
8 The literature concentrates on effectiveness, one exception being ARSANALP/HENRY (2005) who claim to deal with
efficiency, but rather model effectiveness. Efficiency would imply that an objective is met with a minimum of resources. This question is barely discussed in the literature.
Since the opinion that decent institutions and governance structures play a crucial role for economic development and growth has become almost consensus in the economic literature9, the question remains if debt forgiveness can be expected to contribute to
improvements of governance quality in low-income countries, creating institutional conditions that are conducive to economic growth.
CHAUVIN/KRAAY (2005) show for 62 developing countries that debt relief between 1989 and 2003 did not improve the institutional quality, nor did it lead to rising FDI or higher rates of economic growth. EASTERLY (1999) finds that highly indebted poor countries became highly indebted mainly because of poor policies not because of external shocks or wars. He estimates a statistically significant association between debt relief and new net borrowing in 40 HIPCs during the period 1989-1997. He concludes that official lenders did not follow prudential rules and the IMF and World Bank provided far more financing to HIPCs over 1979-1997 than to other developing countries of similar income levels although the policies in many HIPCs have been worse. Given these rather unsatisfying results, the effectiveness of debt relief with respect to governance quality and economic development in low-income countries becomes highly questionable, because it might cause moral hazard and incentives to delay institutional reforms necessary for growth. BAUER (1991) raises moral hazard and disincentive issues, too, claiming that the beneficiaries of debt relief are those govern-ments that have not fulfilled their obligations and have been allowed to do so very largely unscathed. THOMAS (2001) points out, that some HIPCs had no policy re-sponses to poverty, HIV/AIDS, or corruption until they were required to do so as conditions for debt relief under the HIPC Initiative. Therefore, he suggests, unless debt relief is effectively conditioned on the proper use of funds and the pursuit of structural reforms, it is unlikely to help the poor.10
9 See RODRIK/SUBRAMANIAN/TREBBI (2004). SACHS (2003) questions the dominance of institutions and claims that
geographical conditions are of special relevance for economic development.
10 “Even worse, debt-relief funds may be used to support activities that actually worsen poverty, such as war…”
(THOMAS 2001, p. 42). However, the pleading for strong conditionality in order to force developing countries to introduce reforms is not undisputed. DOLLAR/SVENSSON (2000), analyzing the failure of structural adjustment programs, claim that the role of donors is to identify reformers, not to create them.
CLEMENTS/BHATTACHARYA/NGUYEN (2005) using data for 55 low-income countries over the period 1970-1999 find that large debt burdens have not seriously hampered public investment in low-income countries and that in most cases debt relief has lead to greater public consumption rather than investment that could have contributed to further economic growth. Taking into account that only a relatively small share of debt is supposed to be channelled into public investment, the impact of debt relief on growth will at best be modest.
To the contrary, ARSLANALP/HENRY (2005) show that the debt restructuring and reduction under the Brady Plan led to rising asset prices, increased investment, and faster growth in the 16 countries that received Brady deals between 1989 and 1995. According to the authors, the Brady Plan worked quite well because debt relief was granted to a group of middle-income developing countries where debt overhang genuinely stood in the way of profitable new lending and investment. It is far from certain that the positive results of the Brady Plan can be used to forecast the potential impact of further debt relief on HIPCs (ARSLANALP/HENRY 2005, p. 1048). Conse-quently,ARSLANALP/HENRY (2006) do not expect that further debt relief will address
the fundamental problem of inadequate economic institutions that impedes investment and growth in the world’s poorest countries. In their opinion, the (indirect) approach of debt relief does little, if any, good.
Given the overwhelming evidence that debt relief cannot be expected to have notable positive effects on governance quality and economic growth, why do creditor countries actually grant debt forgiveness and what are the main determinants of the allocation of debt relief?
3.3
T
HED
ETERMINANTS OFD
EBTR
ELIEFAs debt relief has been barely effective, it makes sense to study its determinants. They obviously deviate from economic reasoning as discussed in section 3.1. This is exempli-fied by HERNÁNDEZ/KATADA (1996). They argue that neither absolute poverty nor lack of access to foreign exchange (through exports) had been criteria in allocating ODA debt relief and pure grants during the period 1989-1993.
MICHAELOWA (2003) provides a theoretical explanation for this evidence. In a political economic model based on the utility maximizing behavior of the political actors participating in the decision making process of debt relief programs she argues that, if politicians and international bureaucrats realize that default risks become very high, they prefer to grant debt relief in order to conceal their imprudent past lending and to “sell” the renunciation of funds as an innovative poverty reduction measure, especially if lobbying by non-governmental organizations (NGOs) in favour of debt relief increases their chances of obtaining positive public credit for the delivered debt relief. The enhanced HIPC initiative serves as an example.
Empirical evidence is in line with this reasoning. BIRDSALL/CLAESSEN/DIWAN (2002,
2003), analyzing a sample of 37 Sub-Saharan African countries, prove that debt relief between 1977 and 1998 has been rather independent on policy variables in high debt countries whereas net transfers are more dependent on governance indicators in the low debt regimes. Consequently, they suggest that the international community as a whole seems to be less selective with respect to the institutional quality of high debt countries. The authors also find that policy selectivity has declined over time and that in the 1990s multilateral and bilateral donors were actually financing bad policies in high debt countries. NEUMAYER (2002) finds very little evidence for a connection between the quality of governance and the allocation of debt forgiveness between 1989 and 1998. Only one out of six governance indicators seemed to be a statistically significant determinant of whether or not a country is deemed eligible for receiving debt relief.
ALESINA/WEDER (2002) point out, that corrupt governments following very poor policies have received just as much aid and debt relief as less corrupt ones. According to their empirical study, covering several time periods between 1970 and 1995, there is not even weak evidence of a negative effect of corruption on received foreign aid or debt relief. ALESINA/DOLLAR (2000) find a strategic nature of aid, which implies the same behavior of donors with respect to debt relief. They use control variables such as colonial status (number of years in the 20th century in which countries have been
In sum, theoretical literature and empirical evidence clearly show that it is not the governance quality or the effort for better economic and political circumstances that drives debt relief.
4
I
S
G
OOD
G
OVERNANCE A
D
RIVER FOR
D
EBT
R
ELIEF
–
T
HEORETICAL
C
ONSIDERATIONS
This section deals with the determinants of debt relief from the perspective of the creditor countries. As it is designed in the Enhanced HIPCs Initiative that only those countries receive debt forgiveness that seriously reform their institutional setting and their economic policy, it seems adequate to look behind the motives of creditor countries. There are several determinants of debt relief one can think of. First, it may be the case that debt relief is given on the basis of economic reasoning. This would imply that debt relief is expected to free additional resources and enhance economic growth, and, because of the importance of good governance for economic development, that good governance is rewarded and bad governance is sanctioned. In this case, one would expect that debt relief is more successful with respect to economic performance and improvements of governance quality than documented in the literature. We discuss the hypothesis that debt relief programs have contributed to economic growth and to improvements in governance quality (H1) in section 5.2.
Another justification for debt relief could be the existence of the so called debt burden, which we will test in Stage 2. Since high levels of indebtedness seem to be detrimental to growth in low-income countries, debt forgiveness could be one way to enhance economic development in HIPCs. Therefore, the amount of debt relief should be positively related to the level of indebtedness, which is the second hypothesis (H2) to be tested.
However, a political economy perspective rather suggests a different theoretical reasoning along the lines raised by MICHAELOWA (2003). According to this reasoning, politicians in donor countries do not like to admit policy errors. Suppose that despite (or even because of) past debt relief, the debtor country did not improve its economic and political situation. Nevertheless, politically rational governments in creditor
countries would not take this result as a signal to stop their activities as this would be a confession of bad economic policy in the recent past. Rather, they would find argu-ments for further debt relief measures.11 Applied to the three sub-periods we have
chosen, one would then expect a path dependence. Our third hypothesis (H3) goes as follows: debt relief in the second and third sub-period is positively related to the amount of debt forgiven in the first, and the first and second sub-period respectively. For governments in rich countries there may be another incentive for debt relief, namely poverty, in particular poverty to be observed in the daily news. Famines, natural catastrophes and the like can be instrumentalized when the government is not willing or able to run different and probably more effective development policies such as opening foreign trade for agricultural products and Heckscher-Ohlin goods.12 Debt
relief then is a politically cheap, but economically expensive form of publicly visible development policy. Thereby, the government again can improve its position against the country’s opposition that cannot argue against it without appearing heartless and stingy. Therefore, one could expect debt relief to be positively correlated with the degree of poverty, which is our fourth hypothesis (H4) to be tested.
Another determinant of debt relief may be the abundance of natural resources. Especially oil exporting countries may be more easily subject to debt forgiveness than others, as their governments have to be treated carefully by industrialized countries.13
A reasonable hypothesis (H5) is that oil exporting countries receive more debt relief than others.
11 The political gains can even be increased if the debt relief initiative is a joint undertaking of many countries. In
particular, the G8 provides a good platform for its members’ governments to gain a competitive edge against the opposition at home. By forming a front, the governments can agree and assign each other greater competence. Thus, the opposition has moral as well as medial difficulties to argue against the policy deal. In addition, the moral and intellectual support of NGOs demanding for debt relief can be obtained. This sort of history-related path depend-ence can be extended by looking at colonial history. Countries which in the past were colonies of European G8-members may be treated more generously than others. For a theoretical analysis see VAUBEL (1991), for an applica-tion (to the G8’s initiative to bridge the global digital divide) see FREYTAG (2003).
12 This does not say that debt relief is useless in any poor country. The evidence however suggests that debt relief is
more helpful in middle income countries to reduce the debt overhang (ARSLANALP/HENRY 2006) and that poor countries are poor mainly because of poor governance (EASTERLY 1999).
13 The fact that a country exports oil can be interpreted as “economic proximity” to major OECD countries which
consume the largest share of the world’s oil production. BARRO/LEE (2005) suggest that economic proximity to the United States and major Western European countries is positively related to the probability and the size of IMF loans a country gets. The oil abundance of Iran may be one reason for the intensive negotiating efforts the EU is undertaking to solve the problem of Iran’s nuclear strategy.
Thus, according to the hypotheses H2-H5 debt relief for developing country i can be interpreted as a function of debt relief, the actual debt burden, debt relief in the past, the colonial history, the degree of a country’s poverty, and a dummy for oil exporting countries.
One can also formulate an alternative hypothesis, namely that governments in creditor countries are able to learn and to distinguish debtor countries from each other. The justification is that the knowledge and awareness about both the elusiveness of debt relief and the enormous impact of institutions on economic development is rather new – at least in terms of publicly accepted knowledge. This would imply that creditor countries’ governments do take into account governance quality or changes in the governance structures of debtor countries more carefully in later periods of debt relief. It does, however, not imply that the other determinants are irrelevant.
Our alternative hypothesis, that good governance (H6a) or improvements of govern-ance quality (H6b) influence the amount of debt forgiveness in the third sub-period positively, assumes economic rationality to a greater extent than the first one. Besides the variables defined for H2-H5, the governance quality and changes in the governance structures over time are relevant according to H6a and H6b.
We will test our hypotheses empirically in the following section.
5
E
MPIRICAL
A
NALYSIS
This section reports the results of the empirical analysis. We do cross country estimates for three periods (1990-1994, 1995-1999, 2000-2004). We start by giving a brief overview on various debt relief programs in recent history. In sub-section 5.1 we introduce the database for 127 developing countries in the period 1990-2004. After that, in “Stage 1” we assess whether debt relief contributes to higher growth and improvements of governance structures (H1). In “Stage 2” we test our theoretical considerations about the determinants of debt relief (H2-H6).
5.1
D
ATAThe data comprises of macroeconomic variables, a variety of institutional variables describing the quality of governance structures as well as different control variables. We split the period into three sub-periods, namely 1990-1994, 1995-1999 and 2000-2004, and use average data for these sub-periods. We have chosen these sub-periods because the second and third sub-period almost match the introduction of the HIPC I and HIPC II initiative respectively.14 Another reason is that some variables we use, especially debt
relief, occur in a rather discontinuous manner, and some data are not available for every single year.
The sum of debt relief for the countries in our sample between 1990 and 2004 amounts to about US$ 51 billion (face value). We use data on debt relief reported by the Devel-opment Assistance Committee (DAC) of the Organisation for Economic Co-operation and Development (OECD 2006). These include the forgiveness of loans reported by creditor countries as a component of official development assistance (ODA). Further data on debt are taken from the Joint BIS-IMF-OECD-World Bank statistics on external debt.15 It may be argued that the face value of debt and debt relief is not appropriate to
calculate their economic effects and some authors already claimed that one should rather use net present value terms. Although a few attempts to calculate the net present value of debt relief have been made, no comprehensive database on the net present value of debt relief calculated on a loan-by-loan basis exists so far. Since the reliability of the existing estimations of debt relief in net present value terms is questionable, we use the reported face values.
A second argument for this way of proceeding is that we are up to analyze the effects and justification of debt relief from the donors’ point of view, or – so to speak – from the perspective of OECD countries’ tax payers. One can also argue that from the creditors’ perspective, the net present value of the loans does not matter in reality because the probability that HIPCs would have met their obligation (including interest etc.) can be expected to be close to zero, anyway. Therefore, it is the reported (nominal)
14 Although some HIPCs received debt relief in the HIPC initiative framework in the second sub-period, the vast
amount of debt forgiveness has been delivered in the third sub-period.
amount of debt relief provided that counts (among others as a “selling” argument for tax payers, NGOs etc.). Donor countries usually report the amount of debt relief in face value terms.
Finally, since we discuss the problem of additionality of debt relief our method can be justified because of the possible trade off between debt relief and real resource transfer through ODA.
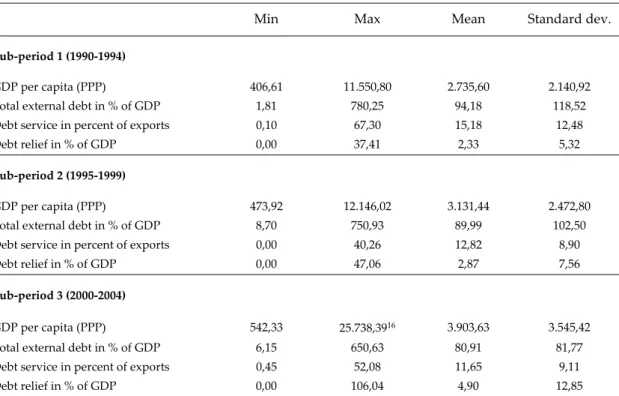
Our main economic indicators, such as GDP, GDP growth, GDP per capita, and data on international trade, are taken from IMF (2006) and WTO (2006) sources. The descriptive statistics referring to GDP per capita, total external debt per GDP, debt service per exports, and debt relief per GDP are reported in Table 1.
Table 1: Descriptive statistics
Min Max Mean Standard dev.
Sub-period 1 (1990-1994)
GDP per capita (PPP) 406,61 11.550,80 2.735,60 2.140,92 Total external debt in % of GDP 1,81 780,25 94,18 118,52 Debt service in percent of exports 0,10 67,30 15,18 12,48
Debt relief in % of GDP 0,00 37,41 2,33 5,32
Sub-period 2 (1995-1999)
GDP per capita (PPP) 473,92 12.146,02 3.131,44 2.472,80 Total external debt in % of GDP 8,70 750,93 89,99 102,50 Debt service in percent of exports 0,00 40,26 12,82 8,90
Debt relief in % of GDP 0,00 47,06 2,87 7,56
Sub-period 3 (2000-2004)
GDP per capita (PPP) 542,33 25.738,3916 3.903,63 3.545,42
Total external debt in % of GDP 6,15 650,63 80,91 81,77 Debt service in percent of exports 0,45 52,08 11,65 9,11 Debt relief in % of GDP 0,00 106,04 4,90 12,85 The reported data are the average values in the three sub-periods.
The number of countries covered by the variables varies between 99 and 120 because of missing values in the different categories and sub-periods.
16 The discovery and exploitation of large oil reserves in Equatorial Guinea caused a tremendous economic growth in
We use additional data on public expenditures, FDI, colonial history, religion dum-mies, a landlock dummy, a dummy for oil exporting countries, HIV/AIDS and the Human Development Index reported in the CIA World Factbook (2006), by the WHO (2006), the UNESCO (2006), and the Human Development Reports (HDR 2006).
The fact that not all data are available for every single country reduces our sample size in most of our regressions.
To guarantee reliability in one of the major variables in our analysis, we use govern-ance indicators from different sources. Our data set covers the following governgovern-ance indicators (source in parenthesis):
1. Civil Liberties (Freedom House)17
2. Political Rights (Freedom House)
3. Corruption Perceptions Index / CPI (Transparency International)18
4. Voice & Accountability (World Bank / KKM)19
5. Political Stability & Absence of Violence (World Bank / KKM) 6. Government Effectiveness (World Bank / KKM)
7. Regulatory Quality (World Bank / KKM) 8. Rule of Law (World Bank / KKM)
9. Control of Corruption (World Bank / KKM)
10. Index of Economic Freedom (Heritage Foundation)20
11. Economic Freedom of the World (Fraser Institute)21
The indicators “Civil Liberties” (1) and “Political Rights” (2) provided by Freedom House on a yearly basis covering the whole period 1990-2004 have been transformed so that higher values indicate “better” performance. The original indicators range from 1 (“free”) to 7 (“not free”). The survey includes both analytical reports and numerical
17 FREEDOM HOUSE 2005.
18 TRANSPARENCY INTERNATIONAL 2005.
19 For the methodology of aggregating governance indicators see KAUFMANN/KRAAY/ MASTRUZZI (KKM) (2005) and
KAUFMANN/KRAAY/ZOIDO-LOBATÓN (1999).
20 HERITAGE FOUNDATION 2006. 21 FRASER INSTITUTE 2005.
ratings. The survey findings are reached after a multi-layered process of analysis and evaluation by a team of regional experts and scholars.22
The “Corruption Perceptions Index” (CPI) (3) ranks the countries in terms of perceived levels of corruption, as determined by expert assessments and opinion surveys. The sources measure the overall extent of corruption in the public and political sectors.23
The CPI Score, ranging between 0 (highly corrupt) and 10 (highly clean), is only available for a larger group of countries for the second and third of our sub-periods. The same holds for the aggregated governance indicators estimated by World Bank staff, which are provided in a 2 years cycle. The indicator “Voice & Accountability” (4) includes a number of measures of the political process, civil liberties, political and human rights. “Political Stability & Absence of Violence” (5) combines several indica-tors that measure perceptions of the likelihood that the government in power will be destabilized or overthrown by unconstitutional or violent means. “Government Effectiveness” (6) combines responses on the quality of public service provision, the quality of the bureaucracy, the competence of civil servants, the independence of the civil service from political pressures, and the credibility of the governmentʹs commit-ment to policies.
“Regulatory Quality” (7) focuses on the policies themselves, including measures of the incidence of market-unfriendly policies such as price controls or inadequate bank supervision, as well as perceptions of the burdens imposed by excessive regulation in areas such as foreign trade and business development. The indicator “Rule of Law” (8) includes several measures of the extent to which agents have confidence in and abide by the rules of society. These include perceptions of the incidence of crime, the effectiveness and predictability of the judiciary, and the enforceability of contracts. “Control of Corruption” (9) is a measure of the extent of corruption, conventionally defined as the exercise of public power for private gain. It is based on scores of variables from polls of experts and surveys (THE WORLD BANK 2005). The six indicators
are normalized in every reported year range from -2.5 to 2.5 and have a mean of zero and a standard deviation of one. Higher values indicate “better” governance.
22 For a documentation of the methodology see FREEDOM HOUSE (2005). 23 For a documentation of the methodology see LAMBSDORFF (2005).
The “Index of Economic Freedom” (10) provided by the Heritage Foundation includes a broad array of institutional factors determining economic freedom, especially corruption in the judiciary, and government bureaucracy, non-tariff barriers to trade, the fiscal burden of government, the rule of law, efficiency within the judiciary, and the ability to enforce contracts, regulatory burdens on business, restrictions on banks, labor market regulations, and informal market activities, including corruption, smuggling, piracy of intellectual property rights. We transformed the index so that higher scores indicate an economic environment or set of policies that are most conducive to economic freedom. The original score ranges from 1 to 5, where higher scores signify lower economic freedom.
“Economic Freedom in the World” (11) calculated by the Fraser Institute measures the degree of economic freedom present in the five areas “Size of Government”, “Legal Structure and Security of Property Rights”, “Access to Sound Money”, “Freedom to Trade Internationally”, and “Regulation of Credit, Labor, and Business”. This indicator is a broad measure of conditions that are supposed to be supportive for economic growth.24 Within the five major areas, 21 components are incorporated into the index
but many of those components are themselves made up of several sub-components.25
The scale runs from 0 to 10. Higher values indicate a higher degree of economic freedom. We use data from the years 1990, 1995, 2000, 2001, 2002, and 2003.
5.2
S
TAGE ONE–
D
IDD
EBTR
ELIEF BRING OUT ANYG
OOD?
First, we discuss the first hypothesis (H1) claiming that debt relief provided in the first and second of our sub-periods improved the economic development in low-income countries. The literature is explicit about the poor effectiveness of debt relief (and development aid). We have used our database to control whether or not our data is in accordance to the general thrust of the literature (see also sub-section 3.2). The results of an OLS-model (with White correction because of possible heteroscedasticity) show
24 Interestingly, the correlation between the Fraser Index and most of the other institutional variables is pretty low.,
especially in the second sub-period. The coefficients of correlation are significantly higher in the third sub-period but still do not indicate a strong correlation.
that neither economic growth (measured by GDP per capita in PPP-$) nor governance indicators were positively influenced by debt relief during our estimation period 1990 through 2004, which one would expect. 26
We also test whether ODA aid contributed to growth and better governance and again have to reject the hypothesis. The only variables that were positively correlated with growth are governance indicators.
The economic freedom of a country measured by the Fraser Index (FRASER) has – as expected – a positive and preponderant significant effect on economic development in most of our estimations. We controlled our estimations for variables such as geo-graphical specification, namely a dummy for a country’s access to oceans (landlock-dummy), a dummy for the dominating religion (Christian, Muslim or other), a dummy that indicates if the country is an oil exporter, and some other factors, such as the stock and the inflow of foreign direct investment (FDI). Although some of these variables show the expected signs (e.g. LANDLOCK) and add some explanatory power to our models, this extra explanatory power is negligibly small and most of the variables showed themselves highly insignificant, besides FDI that contribute significantly positive to growth in some of our regressions. The answer to the question if debt relief has brought out any good with respect to the economic development in low-income countries so far is disillusioning. All in all, our results suggest that debt relief programs in the 1990s have not lead to higher economic growth in the world’s poorest countries. According to the results of some of our estimations, neither ODA did. The same holds with respect to governance. We cannot identify a positive relationship between debt relief and governance indicators in the second and third sub-periods. Debt relief did not contribute to better governance in highly indebted countries in the 1990s and the early 21st century. Our estimations do not produce even the weakest relation between
the amount of debt relief and governance indicators. Our first hypothesis (H1), in line with the existing literature on this issue, is thus to be rejected. Debt relief in the period from 1990 to 1999 did not contribute to better economic performance and political conditions in most developing countries.
26 We do not report the results as they document only a very loose relation between the dependent and the exogenous
5.3
S
TAGET
WO–
T
HE DETERMINANTS OFD
EBTR
ELIEFIf not the economic and political development of low-income countries, what drives the decision of policymakers in industrialized countries for more debt relief? This question is addressed by the hypotheses 2 through 6 of section 4. We use a Tobit regression to test the hypotheses empirically. We start with the sub-period 1995-1999 in section 5.3.1, and proceed with the sub-period 2000-2004 sub-section 5.3.2.
5.3.1 DETERMINANTS OF DEBT RELIEF DURING THE 1990S
Our dependent variable is the amount of debt relief awarded in the sub-period 1995-1999 relative to the average GDP in this sub-period. Since quite a few countries in our sample did not receive any debt relief at all and therefore the distribution of the dependent variable is skewed, we apply (left-censored) Tobit estimation techniques to distinguish between countries that received debt relief and those who did not, and to take into account the amount of debt relief relative to GDP at the same time. By doing so we do not only cover the question of whether or not a country had been found to be eligible for a debt relief, which is the first step if one wants to identify determinants of debt forgiveness, but also address the assumption that a factor that has a positive effect on the probability of receiving any debt relief should also influence the amount of the debt forgiveness positively.27
ε X ß X β s eperexport Debtservic ODAperGDP β DRperGDP β DebtperGDP β c DRperGDP N N M M 2 1 3 1 2 2 1 2 + + + + + + + =
with DebtperGDP2being the debt stock relative to the GDP in sub-period 2, DRperGDP1
the amount of debt relief relative to the GDP in sub-period 1, ODAperGDP1 the aid to
GDP ratio in sub-period 1, Debtserviceperexports2 being the ratio of debt service per
exports in sub-period 2, XM representing a vector of institutional variables and XN
representing a vector of controls. We use each governance indicator separately because we want to identify governance dimensions that might have been weighted stronger by donor countries when they decided about granting debt forgiveness.
27 NEUMAYER (2002, p. 920), using the same technique to prove if good governance has been rewarded, gives a similar
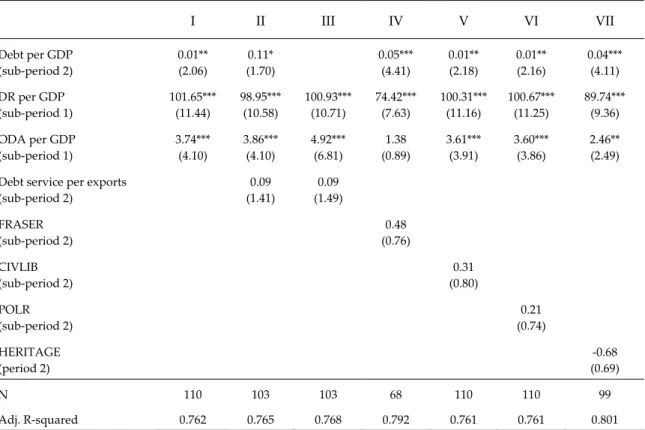
Table 2: Tobit estimation I-VI for the determinants of debt relief in sub-period 2 (1995-1999) I II III IV V VI VII Debt per GDP (sub-period 2) 0.01** (2.06) 0.11* (1.70) 0.05*** (4.41) 0.01** (2.18) 0.01** (2.16) 0.04*** (4.11) DR per GDP (sub-period 1) 101.65*** (11.44) 98.95*** (10.58) 100.93*** (10.71) 74.42*** (7.63) 100.31*** (11.16) 100.67*** (11.25) 89.74*** (9.36) ODA per GDP (sub-period 1) 3.74*** (4.10) 3.86*** (4.10) 4.92*** (6.81) 1.38 (0.89) 3.61*** (3.91) 3.60*** (3.86) 2.46** (2.49) Debt service per exports
(sub-period 2) 0.09 (1.41) 0.09 (1.49) FRASER (sub-period 2) 0.48 (0.76) CIVLIB (sub-period 2) 0.31 (0.80) POLR (sub-period 2) 0.21 (0.74) HERITAGE (period 2) -0.68 (0.69) N 110 103 103 68 110 110 99 Adj. R-squared 0.762 0.765 0.768 0.792 0.761 0.761 0.801 Dependent variable is the amount of debt relief per GDP in sub-period 2 (1995-1999). Absolute z-values in parentheses. * Significant at the 90 percent level.
** Significant at the 95 percent level. *** Significant at the 99 percent level.
As can be seen in Table 2, the major part of the variance of the amount of debt relief per GDP in the second half of the 1990s can be explained by the country’s indebtedness in the period 1995-1999 measured by external debt per GDP28, the amount of debt relief
per GDP awarded in the first sub-period (1990-1994), and the amount of ODA per GDP provided in this sub-period, with debt relief per GDP being most influential and highly significant.
These results can be interpreted as follows. First, creditor countries took the indebted-ness of a country into account when they decided if this very country should receive debt forgiveness. Second, the degree of the indebtedness of a country seems to be positively correlated to the relative amount of the debt relief provided. At first glance, these results seem to confirm our second hypothesis (H2). Interestingly, the strong positive relation between the debt burden and the amount of debt relief does not occur
28 Using the initial indebtedness at the beginning of the second sub-period as explanatory variable we got very similar
if we add (or use) the amount of debt service per exports as a measure of a country’s debt burden (estimation II and III). The coefficient of this variable is positive but insignificant. Hence, it seems that the level of indebtedness had been taken into account by creditors to some extent, but the actual debt burden has not played a major role in the calculus of donors in the 1990s. This somehow confirms our conjecture that some severely indebted countries did not pay their obligations or at least showed substantial arrears. The correlation between the relative debt stock and the debt service per exports is remarkably low, with a coefficient of correlation just about 0.24. Creditor countries obviously provided higher debt forgiveness through debt restructuring, postponements or debt cancellation in order to prevent additional arrears, which is also in line with our theoretical presumptions. This, indeed, might have created even more disincentives to necessary adjustments in some highly indebted poor countries. However, the most striking result is the strong path dependence of debt relief. Once a country received debt forgiveness in the early 1990s, the probability of gaining from additional debt forgiveness in the second half of the 1990s is close to one. Furthermore, the higher the amount of the debt relief granted in the past, the higher is the expected relative debt relief in the future. The data strongly confirm our third hypothesis (H3). Donor countries obviously do not interpret past ODA and debt relief as “sunk costs”, what they clearly are.29 Contrary to reasonable economic considerations, the costs of
past ODA and debt relief programs are not irrelevant in the decision making process about current and future debt forgiveness, even if it becomes clear that these “expendi-tures” did not bring out any good with respect to economic development or govern-ance quality.30 Governments in creditor countries did not tend to admit past errors;
they rather accepted new ones to prevent political costs, at least in the 1990s. The governance indicators do not add any extra explanatory power to the estimation (see Table 3), but – at least – show a positive sign, indicating that governance has been taken into account.31
29 Sunk costs are costs that have already been incurred and which cannot be recovered to any significant degree. This,
indeed, is true for debt relief and ODA payments granted in the past.
30 It should me mentioned, that, in addition to these interesting results, we do not find evidence for a crowding out of
ODA by debt relief in the 1990s at least in the highly indebted countries.
31 Unfortunately, the availability of the CPI for the second sub-period did not meet our requirements. We therefore
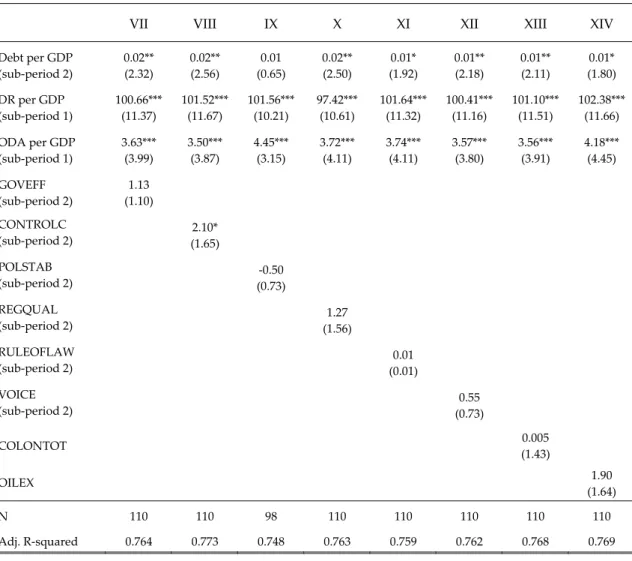
Table 3: Tobit estimation VII-XIV for the determinants of debt relief in sub-period 2 (1995-1999)
VII VIII IX X XI XII XIII XIV
Debt per GDP (sub-period 2) 0.02** (2.32) 0.02** (2.56) 0.01 (0.65) 0.02** (2.50) 0.01* (1.92) 0.01** (2.18) 0.01** (2.11) 0.01* (1.80) DR per GDP (sub-period 1) 100.66*** (11.37) 101.52*** (11.67) 101.56*** (10.21) 97.42*** (10.61) 101.64*** (11.32) 100.41*** (11.16) 101.10*** (11.51) 102.38*** (11.66) ODA per GDP (sub-period 1) 3.63*** (3.99) 3.50*** (3.87) 4.45*** (3.15) 3.72*** (4.11) 3.74*** (4.11) 3.57*** (3.80) 3.56*** (3.91) 4.18*** (4.45) GOVEFF (sub-period 2) 1.13 (1.10) CONTROLC (sub-period 2) 2.10* (1.65) POLSTAB (sub-period 2) -0.50 (0.73) REGQUAL (sub-period 2) 1.27 (1.56) RULEOFLAW (sub-period 2) 0.01 (0.01) VOICE (sub-period 2) 0.55 (0.73) COLONTOT 0.005 (1.43) OILEX 1.90 (1.64) N 110 110 98 110 110 110 110 110 Adj. R-squared 0.764 0.773 0.748 0.763 0.759 0.762 0.768 0.769 Dependent variable is the amount of debt relief per GDP in sub-period 2 (1995-1999).
Absolute z-values in parentheses. * Significant at the 90 percent level. ** Significant at the 95 percent level. *** Significant at the 99 percent level.
Control of Corruption is the only “promising” coefficient, being significant at the 10 percent level and showing the expected sign (estimation VIII, Table 3). On the other hand, POLSTAB shows a negative sign, as does HERITAGE in estimation VII in Table 2. All in all, the hypothesis, that donor countries have taken the state of governance quality into account when they were deciding about debt relief (H6a) has to be rejected for the second half of the 1990s.
The other variables do not contribute to the explanation of the determinants of debt relief in sub-period 2. Colonial history is irrelevant, no matter if we use a variable counting the number of years a country was colony in the 20th century (COLON20) or
depend-ence has to be dismissed. The dummy OILEX shows the expected sign and is close to significance. Nevertheless, we do not find support for the hypothesis that debt relief has been granted in favour of oil exporting countries (H5).
5.3.2 DETERMINANTS OF DEBT RELIEF AT THE BEGINNING OF THE 21S TCENTURY
Now we turn to sub-period 3 testing the hypothesis that governments of creditor countries are able to learn and change the allocation pattern of debt relief with respect to governance quality. The dependent variable is now the amount of debt relief per GDP provided in the third sub-period (2000-2004). We, again, use the level of indebt-edness, measured by the debt stock per GDP as the first independent variable. In order to test the path dependence found in the last section, we integrate the amount of debt relief relative to GDP awarded in the 1990s (sub-periods 1 and 2). We also test if the path dependence can be found with respect to ODA payments provided in sub-periods 1 and 2. This leads us to the following equation that we use in Tobit estimations:
ε X ß X β X β s eperexport Debtservic ODAperGDP β DRperGDP β DEBTperGDP β c DRperGDP N N ∆M ∆M M M 2 2 1 3 2 1 2 3 1 3 + + + + + + + + = + +
with X∆M representing a vector of changes in institutional variables. The explanatory
power of our first two regressions in Table 4 falls way behind the comparable ones from the previous section. Only about 25 to 27 percent of the variance of the amount of debt relief awarded in the third sub-period can be explained by the level of indebted-ness, the amount of previous debt relieves and previous ODA payments. The coeffi-cients of the relative amount of debt relief in the past remain positive and significant, but the path dependence of debt relief has lost some of its weight at the beginning of the 21st century.32 The integration of the actual debt burden, measured by debt service
per exports does not add any extra explanatory power to our model. Although the coefficient of the stock of foreign debt per GDP is positive and significant in the first two estimations, a country’s indebtedness does not seem to be a major determinant of debt relief in the third sub-period. The results do not confirm hypothesis 2. This becomes clear if we introduce a measure of poverty into our regressions.
Table 4: Tobit estimation I-V for the determinants of debt relief in sub-period 3 (2000-2004) I II III IV V Debt per GDP (sub-period 3) 0.10*** (3.66) 0.11*** (3.33) 0.02 (0.69) 0.02 (0.66) 0.02 (0.79) DR per GDP (sub-periods 1& 2) 0.85*** (3.64) 0.86*** (3.40) 0.49*** (3.29) 0.47*** (3.08) 0.47*** (3.15) ODA per GDP (sub-periods 1& 2) -2.81 (0.79) -3.66 (0.84) 8.23** (2.35) 8.51** (2.42) 8.90** (2.54) Debt service per exports
(sub-period 3) -0.10 (0.55) POVERTY (sub-period 3) 0.11** (2.36) 0.11** (2.41) 0.11** (2.43) COLONTOT 0.00 (0.64) OILEX 2.12 (1.17) N 109 96 74 74 74 Adj. R-squared 0.272 0.258 0.625 0.623 0.627 Dependent variable is the amount of debt relief per GDP in sub-period 3 (2000-2004).
Absolute z-values in parentheses. * Significant at the 90 percent level. ** Significant at the 95 percent level. *** Significant at the 99 percent level.
The variable POVERTY is the percentage of the population that lived below the poverty line at the beginning of the 21st century. The integration of this variable adds
much explanatory power to the model and rules out the significance of the relative debt stock.33 Debt relief per GDP in the previous two sub-periods remain significant
and ODA per GDP in these two sub-periods becomes weakly significant. Controlling for other factors, such as colonial history and OILEX does not change the pattern of the estimation.
Summarizing the findings of Table 4, it seems to be the case that recent debt relief has been provided primarily to the poorest countries, but still dependent of debt relief programs in the early 1990s. These findings give strong support to hypothesis 4. The level of indebtedness cannot be judged as an important determinant of debt forgive-ness in the early 21st century.34
33 The correlation between POVERTY and the debt burden (irrespectively of the measure applied) is rather low. 34 The coefficient for debt service per exports shows itself highly insignificant and even has a negative sign.
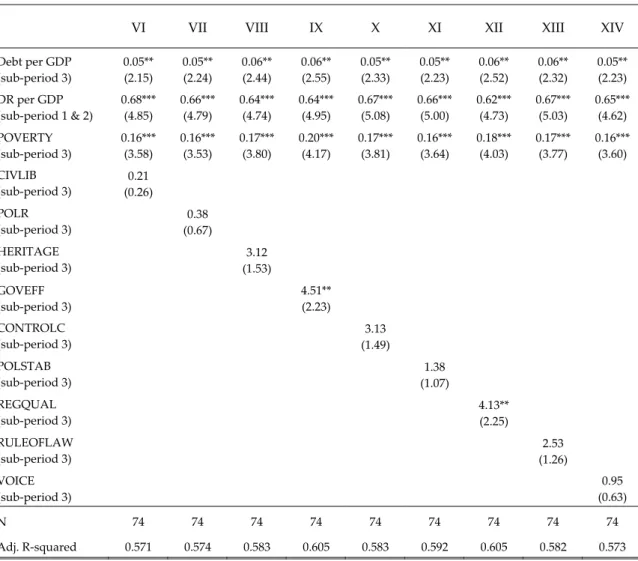
The question, yet to be answered, is if recent debt relief has been provided to those countries that have shown sound policies or at least improved their governance quality. We tested the effects of several institutional dimensions on the allocation of the debt forgiveness in sub-period 3 by using the different institutional indicators sepa-rately. Table 5 provides some promising results. The coefficients of all governance indicators are positive and two of them reach the 95 percent significance level.35
Table 5: Tobit estimation VI-XIV for the determinants of debt relief in sub-period 3 (2000-2004)
VI VII VIII IX X XI XII XIII XIV
Debt per GDP (sub-period 3) 0.05** (2.15) 0.05** (2.24) 0.06** (2.44) 0.06** (2.55) 0.05** (2.33) 0.05** (2.23) 0.06** (2.52) 0.06** (2.32) 0.05** (2.23) DR per GDP (sub-period 1 & 2) 0.68*** (4.85) 0.66*** (4.79) 0.64*** (4.74) 0.64*** (4.95) 0.67*** (5.08) 0.66*** (5.00) 0.62*** (4.73) 0.67*** (5.03) 0.65*** (4.62) POVERTY (sub-period 3) 0.16*** (3.58) 0.16*** (3.53) 0.17*** (3.80) 0.20*** (4.17) 0.17*** (3.81) 0.16*** (3.64) 0.18*** (4.03) 0.17*** (3.77) 0.16*** (3.60) CIVLIB (sub-period 3) 0.21 (0.26) POLR (sub-period 3) 0.38 (0.67) HERITAGE (sub-period 3) 3.12 (1.53) GOVEFF (sub-period 3) 4.51** (2.23) CONTROLC (sub-period 3) 3.13 (1.49) POLSTAB (sub-period 3) 1.38 (1.07) REGQUAL (sub-period 3) 4.13** (2.25) RULEOFLAW (sub-period 3) 2.53 (1.26) VOICE (sub-period 3) 0.95 (0.63) N 74 74 74 74 74 74 74 74 74 Adj. R-squared 0.571 0.574 0.583 0.605 0.583 0.592 0.605 0.582 0.573 Dependent variable is the amount of debt relief per GDP in sub-period 3 (2000-2004).
Absolute z-values in parentheses. * Significant at the 90 percent level. ** Significant at the 95 percent level. *** Significant at the 99 percent level.
35 The coefficient for the CPI is positive but insignificant, too. The implementation of the CPI as the independent
institutional variable basically produces the same results (with DR per GDP and POVERTY remaining highly significant) but affects the significance of the level of indebtedness (Debt per GDP). This could be due to the re-duced sample size, because the CPI does not cover all of the 74 countries included in the other estimations. Because of consistency we do not present the results in Table 5.
Although we still identify some sort of path dependence, as the highly significant coefficients of DR per GDP in sub-period 2 imply36, the provision of debt relief in
recent years seems to follow some prudential rules and to be conditioned on relatively decent policies rather than only the level of indebtedness and the amount of previous debt forgiveness. Two governance indicators (government effectiveness and regulatory quality) had a significant effect on the decision of creditor countries to forgive debt as well as on the decision about the amount of debt relief.
Our findings mark an interesting and relevant policy result. Obviously, governments of donor countries seem to have learned and adjusted their forgiveness pattern to some extent. Debt relief at the beginning of the 21st century still followed some sort of path
dependence. The quality of governance indicators was more important in the third sub-period. It seems that international donors do pay attention to the criteria of the HIPC and HIPC II initiative that refer explicitly to poverty reduction and – at least implicitly – take some institutional aspects into account. This result is promising and suggests that the discussion of institutions in development, which has its roots in academic circles and has been transferred into the international development organisa-tions, has not only produced political statements but also some policy measures. A recent study by HECKELMAN/KNACK (2006) reaches similar conclusions with respect to official development aid. Whereas in the 1980s institutions did not play any role in the decisions to grant aid, in the 1990s this has changed. At the same time when interna-tional donors started to link debt relief to instituinterna-tional reforms, aid has been given – at least partially – depending on governance quality.
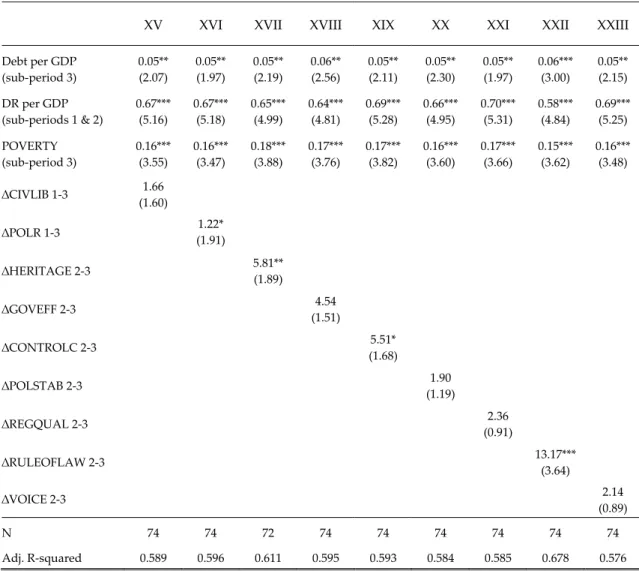
Finally we analyze whether or not debt relief was granted to acknowledge successful efforts to improve governance structures in debtor countries. In order to do so, in addition to the total values of our governance indicators (H6a), we also tested if the change in governance quality influenced the pattern of debt relief at the beginning of the 21st century (H6b).
Table 6 shows that four of the eight variables reach (at least weak) significance with the improvement in the rule of law being highly significant and most influential (estima-tion XXII with the highest R²).