ISSN: 2088-8708, DOI: 10.11591/ijece.v11i1.pp124-132 124
Voltage collapse prediction using artificial neural network
Samuel Isaac1, Soyemi Adebola2, Awelewa Ayokunle3, Katende James 4, Awosope Claudius 5 1,2,5Department of Electrical and Information Engineering, Covenant University, Nigeria
3Department of Electrical Engineering, Tshwane University of Technology, South Africa
4Department of Electrical and Computer Engineering, Namibia University of Science and Technology, Namibia
Article Info ABSTRACT
Article history: Received Mar 2, 2020 Revised Jun 23, 2020 Accepted Jul 15, 2020
Unalleviated voltage instability frequently results in voltage collapse; which is a cause of concern in power system networks across the globe but particularly in developing countries. This study proposed an online voltage collapse prediction model through the application of a machine learning technique and a voltage stability index called the new line stability index (NLSI_1). The approach proposed is based on a multilayer feed-forward neural network whose inputs are the variables of the NLSI_1. The efficacy of the method was validated using the testing on the IEEE 14-bus system and the Nigeria 330-kV, 28-bus National Grid (NNG). The results of the simulations indicate that the proposed approach accurately predicted the voltage stability index with an R-value of 0.9975 with a mean square error (MSE) of 2.182415x10⁻⁵ for the IEEE 14-bus system and an R-value of 0.9989 with an MSE of 1.2527x10⁻⁷ for the NNG 28 bus system. The results presented in this paper agree with those found in the literature.
Keywords:
Artificial neural network Online voltage stability analysis Voltage stability
Voltage stability index Weakest bus
This is an open access article under the CC BY-SA license.
Corresponding Author: Samuel Isaac,
Department of Electrical and Information Engineering, Covenant University,
Km 10, Idiroko Road, PMB 1023, Ota, Ogun State, Nigeria. Email: [email protected]
1. INTRODUCTION
Power system management and control have gradually become more challenging; due to increasing demand, restrictions on the expansion, and the evolution of power industries into deregulated and competitive markets. These have resulted in numerous violations of power system stability as operators push these networks close to their stability limit, as reported by [1]. This action has, in turn, led to several voltage collapse incidences around the world with high-cost implications to both the utilities and consumers [2-6]. For this reason, power systems must be monitored and also alert operators about the possible emergencies or faults that are indicative of voltage instability.
According to Kundur, [7] voltage stability is "the ability of a power system to maintain steady and acceptable voltage magnitudes at all network buses at normal operating conditions and after being subjected to a disturbance" [7]. A power system network is said to be voltage unstable when a disturbance causes at least one bus in the network to experience a gradual decline in voltage magnitude [1, 8]. If a reduced voltage profile accompanies the perturbation in all or part of the network, voltage collapse may occur [7]. The cause of disturbance maybe by a sudden increase in load demand, reactive power mismatch, improper operation of voltage control devices, loss of any element of power system, or malfunctioning of on-load tap changing transformers.
Voltage stability can be assessed either through static or dynamic analysis. In static analysis, the power system is in steady-state and modelled using algebraic equations. The static analysis makes it
possible to track the voltage stability through voltage stability margin changes since the system's equilibrium point moves slowly. In the case of dynamic analysis, the power system by a dynamic model, voltage stability level assessment carried out using time-domain simulations. However, these methods are unsuitable for online voltage stability analysis because they involve vast, tedious, and difficult computations.
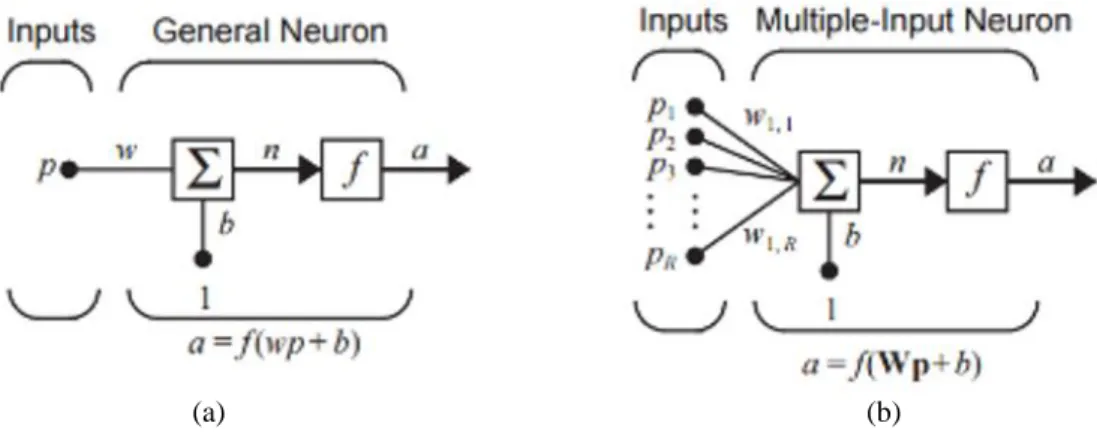
Recently, research endeavours in the area of online voltage stability assessment using machine learning approaches have received increasing research interest due to their broad range of applications and ease. In the field of voltage stability analysis, numerous researches using machine learning is ongoing with artificial neural network (ANN), fuzzy logic network, support vector machine, decision trees, and neuro-fuzzy networks, as seen in [9-16]. ANN includes many components; these components are the single-input neuron or the Multiple-Input Neuron, as shown in Figure 1 [17]. This machine learning-based voltage collapse prediction methods address the shortcomings of the conventional techniques aforementioned.
(a) (b)
Figure 1. The component of neural network, (a) Single-Input, (b) Multiple-Input
In [13], three artificial neural network models, namely the feed-forward neural network (FFNN) layer recurrent neural network and radial basis function (RBF) neural network, were developed to approximate the fast voltage stability index (FVSI) under various load scenarios. The study compares the accuracies of these models in predicting the most critical lines and buses in the test systems. The authors found that although the prediction accuracy of the RBF neural network was better than the other topologies considered, the feed-forward neural network had better generalization with a maximum error of about 0.03 among them. The authors in [14], implemented an RBF neural network to approximate the voltage security level of a power system under a contingency state using the L-index. From their results, the authors found that although the proposed RBF network was faster than the FFNN trained by back-propagation, it required more hidden neurons to achieve the same training error as the FFNN.
In [16], voltage stability analysis was carried out using a risk-based assessment method; that measures system exposure to an outage and the impact of the resulting disruption. The L-index was taken as the voltage stability indicator and a measure of the severity of the outage. The index was implemented using two ANN models, the generalized regression neural network (GRNN) and the multilayer perceptron neural network (MLFFN). The authors found that the MLFNN had better approximation than GRNN with a mean square error (MSE) of 7.107 × 10⁻⁷.
In [18], an FFNN was implemented to predict voltage stability using the line stability index (Lmn). The results validated through testing on the IEEE 14 and IEEE 30 bus systems. For the IEEE 14-bus system, the proposed network converged with an MSE of 4.08503 × 10⁻⁴, and the network converged with an MSE
of 7.13254 × 10⁻⁵ for the IEEE 30-bus system. In [19], the authors assessed the voltage stability of
the IEEE 14-bus system using an ANN-based approach with an L-index serving stability indicator. The authors found that the proposed method yielded more accurate results with an MSE of 0.0077424 and an R-value of 0.85998.
This present work proposes a multilayer perceptron neural network for online voltage collapse prediction, using the new line stability index (NLSI_1) proposed in [20] as the voltage stability indicator. The effectiveness of the proposed approach is demonstrated through voltage collapse prediction on the IEEE 14-bus system and the Nigerian 330kV 28-bus system. The rest of the paper is organized as follows: Section two gives a review of the NLSI_1. Section three outlines the proposed methodology. Simulation results are presented in section four, and section five concludes the paper.
2. THE NEW LINE STABILITY INDEX (NLSI_1)
Static voltage stability analysis involves the determination of a stability indicator such as P-V and Q-V curves, eigenvalues decomposition. These indicators give an approximate value of the distance of the system's current operating point to voltage collapse. Some of these indicators require tedious and difficult computation, and this has made them unsuitable for online voltage stability analysis [21].
The shortcomings, as mentioned earlier on, of some of these indicators, are overcome by voltage stability indices (VSIs) [22, 23]. One of such indices is the NLSI_1 proposed in [20], whose value falls between zero and one. The bus, whose index value is the highest in the system, is labelled the weakest bus in the system. The NLSI_1 is obtained from the combination of the line stability index (Lmn) and the fast voltage stability index (FSVI) through a binary switching function (σ), as shown in (1). The value of the switching function σ is determined by the magnitude of the angular difference between the sending and receiving end voltages. To examine whether σ is 1 or 0, the values of voltage angle (δ) computed from the load-flow program is compared with a threshold value 𝛿𝑐.
1 1 sin 4 1 _ 2 2 2 1 2 x x Z V Q NLSI 0 1 c c (1)3. MATERIALS AND METHODS
The proposed methodology for voltage collapse prediction is based on the artificial neural network. The aim of this is to predict the proximity to voltage instability and rank the resultant voltage collapse according to its severity if it occurs. This research paper proposes an online voltage stability analysis model using the multilayer perceptron neural network (MLPNN) and a voltage stability indicator called the new line stability index (NLSI_1).
3.1. Generation of training data
The generation of the appropriate training data is of utmost importance in the development and deployment of any machine learning solutions. For neural networks to correctly predict the output of a system, the training data used should represent a broad spectrum of operating points of the problem being considered. In this paper, a considerable number of training data is gotten via off-line power system simulation using the following procedure:
A range of operating points is produced by varying the reactive power randomly at only the load buses only from the base case value until the voltage collapse occurred.
For each input-output pattern generated, pre-contingency line flows are obtained by performing the Newton Raphson load flow analysis.
Finally, for each input-output pattern, the NLSI_1 is evaluated to ascertain if the system is stable or not. A total of 3420 input-output patterns were produced for the IEEE 14- bus system after using the above procedure; that is 380 samples per load bus, and a total of 29,450 input-output patterns were produced for the NNG 28- bus system that is 1550 samples per load bus. The generated data samples per load bus were concatenated in an excel spreadsheet to form the datasets in this study.
3.2. Selection of input features
Input feature selection is a vital aspect in the development of an excellent artificial neural network model. In this paper, input features were selected based on the required variables needed to compute the NLSI_1, as seen in [24]. These variables are reactive power flowing the lines (Q), sending end voltage (VS), impedance (Z), line reactance (X), transmission line angle (θ), delta (δ), and switching function (σ). 3.3. Data normalization
This research work utilizes the min-max data normalization to improve training time, minimize the size of the input space, increase the robustness of the implemented neural networks, and reduce the chances of ending up in local optima [25]. The input data is normalized between zero and one using the expression given in (2).
min max min X X X X Xn (2)3.4. Multi-layer perceptron neural network (MLPNN)
MLPNNs are a kind of feed-forward artificial neural networks, which consists of at least three layers: an input layer, one or more hidden layer (s), and an output layer, as shown in Figure 2. In multilayer perceptron neural networks, the neurons in the input layer are interconnected and excited with the input data with multiple weights and biases connected to each neuron. The weighted sum of the inputs is then passed to the hidden layer, where they are transformed through the use of activation functions. Then finally, the output layer presents the output of the neural network by changing the hidden layer activations into whatever scale the output required to be.
Figure 2. Basic layers of an MLPNN
4. RESULTS AND DISCUSSION
This section presents the results obtained from the simulations carried out on the IEEE 14-bus system and the Nigerian 28-bus system. For both test systems, base case and contingency analyses were conducted, and ANN models were developed in MATLAB's neural network toolbox, to predict voltage collapse in the systems. The details of the ANN models developed are also given as follows:
4.1. Voltage collapse prediction on ieee 14-bus SYSTEM
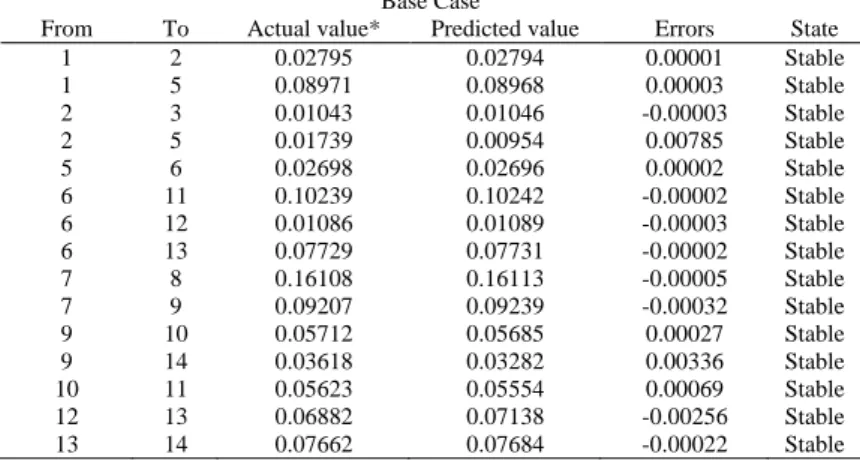
Voltage collapse prediction for load buses in the IEEE 14-bus network was carried out using an MLPNN. The developed MLPNN has one input layer, two hidden layers, and an output layer. Table 1 shows the neural network prediction for base case analysis, and for comparison purpose, the actual index values are also given. From the table, it is seen that all the buses and interconnected lines in the IEEE 14-bus system are stable; as indicated by an index value being below Table 1. The results also show the negligible error between the actual with the predicted index values.
Table 1. Comparison of base case actual with the predicted index values
Base Case
From To Actual value* Predicted value Errors State
1 2 0.02795 0.02794 0.00001 Stable 1 5 0.08971 0.08968 0.00003 Stable 2 3 0.01043 0.01046 -0.00003 Stable 2 5 0.01739 0.00954 0.00785 Stable 5 6 0.02698 0.02696 0.00002 Stable 6 11 0.10239 0.10242 -0.00002 Stable 6 12 0.01086 0.01089 -0.00003 Stable 6 13 0.07729 0.07731 -0.00002 Stable 7 8 0.16108 0.16113 -0.00005 Stable 7 9 0.09207 0.09239 -0.00032 Stable 9 10 0.05712 0.05685 0.00027 Stable 9 14 0.03618 0.03282 0.00336 Stable 10 11 0.05623 0.05554 0.00069 Stable 12 13 0.06882 0.07138 -0.00256 Stable 13 14 0.07662 0.07684 -0.00022 Stable
*Adopted from (Samuel et al., 2017)
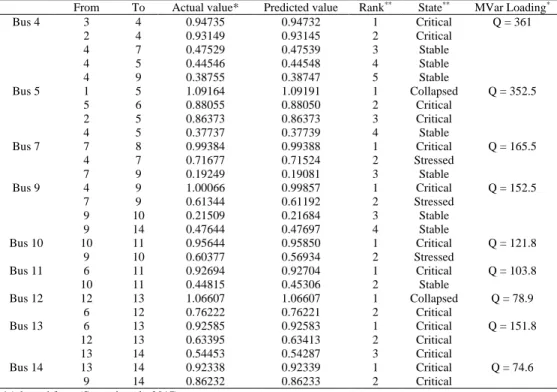
Table 2 presents the actual and predicted index values at maximum reactive power loading for each of the load buses, along with the ranking of the contingencies and the states of the lines based on the predicted index value from most critical to least critical. From the table, the error which exists between the actual and predicted index values is minimal, which validates the proposed approach. The results obtained from the developed MLPNN confirm those obtained by [1, 20].
Table 2. Comparison of actual with the predicted index values at maximum load-ability
From To Actual value* Predicted value Rank** State** MVar Loading*
Bus 4 3 4 0.94735 0.94732 1 Critical Q = 361 2 4 0.93149 0.93145 2 Critical 4 7 0.47529 0.47539 3 Stable 4 5 0.44546 0.44548 4 Stable 4 9 0.38755 0.38747 5 Stable Bus 5 1 5 1.09164 1.09191 1 Collapsed Q = 352.5 5 6 0.88055 0.88050 2 Critical 2 5 0.86373 0.86373 3 Critical 4 5 0.37737 0.37739 4 Stable Bus 7 7 8 0.99384 0.99388 1 Critical Q = 165.5 4 7 0.71677 0.71524 2 Stressed 7 9 0.19249 0.19081 3 Stable Bus 9 4 9 1.00066 0.99857 1 Critical Q = 152.5 7 9 0.61344 0.61192 2 Stressed 9 10 0.21509 0.21684 3 Stable 9 14 0.47644 0.47697 4 Stable Bus 10 10 11 0.95644 0.95850 1 Critical Q = 121.8 9 10 0.60377 0.56934 2 Stressed Bus 11 6 11 0.92694 0.92704 1 Critical Q = 103.8 10 11 0.44815 0.45306 2 Stable Bus 12 12 13 1.06607 1.06607 1 Collapsed Q = 78.9 6 12 0.76222 0.76221 2 Critical Bus 13 6 13 0.92585 0.92583 1 Critical Q = 151.8 12 13 0.63395 0.63413 2 Critical 13 14 0.54453 0.54287 3 Critical Bus 14 13 14 0.92338 0.92339 1 Critical Q = 74.6 9 14 0.86232 0.86233 2 Critical
*Adopted from (Samuel et al., 2017) **Based on the predicted value
Table 3 shows the ranking of buses in the IEEE-14 bus system in ascending order from weakest to strongest. From the table, bus 14 was identified as the weakest bus in the system with a reactive power margin of 74.5 MVar and a percentage change of 38.30% in the voltage magnitude. This choice was informed by the criterion listed in [26]. The results obtained by the developed neural network are in agreement with those obtained by the authors in [1, 13, 15, 18, 19, 27].
Table 3. Bus ranking in the IEEE 14-bus system
Load Bus No From To Qmax Predicted value Ranking
14 13 14 74.6 0.92339 1 12 12 13 78.9 1.06607 2 11 6 11 103.8 0.92704 3 10 10 11 121.8 0.95850 4 13 6 13 151.8 0.92583 5 9 4 9 152.5 0.99857 6 7 7 8 165.5 0.99388 7 5 1 5 352.5 1.09191 8 4 3 4 361 0.94732 9
It was also observed that buses with many interconnected lines tend to have higher reactive power margins and this is because, with more lines, any increase in reactive power can be apportioned amongst the lines [1, 19, 20]. With the developed neural network model, being proposed in this paper, an R-value of 0.99745 and an MSE value of 2.182415 × 10⁻⁵were obtained after cross-validation was carried out to solve
the inherent stability problem faced by ANN. When compared with the results obtained in [19], the proposed approach was found to be superior in terms of better accuracy and generalization of the developed model. 4.2. Voltage collapse prediction on NNG 28-bus system
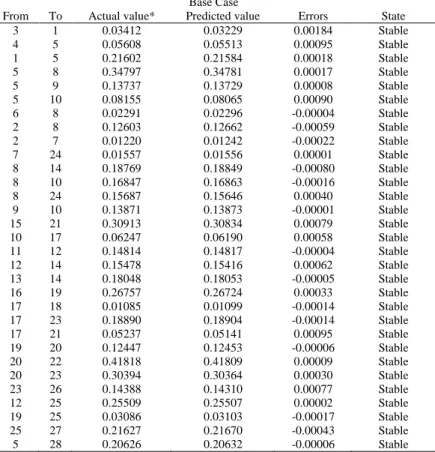
Voltage collapse prediction for load buses in the NNG 330kV 28-bus network was carried out using an MLPNN. The developed MLPNN has one input layer, three hidden layers, and the output layer. Table 4 presents the predicted index values using the developed MLPNN model for base case analysis, and the actual index values are also shown for comparison. It is observed from Table 4, that all the buses and interconnected lines in the network are stable, as indicated by the index values that are below.
Table 4. Comparison of base case actual with the predicted index values
Base Case
From To Actual value* Predicted value Errors State
3 1 0.03412 0.03229 0.00184 Stable 4 5 0.05608 0.05513 0.00095 Stable 1 5 0.21602 0.21584 0.00018 Stable 5 8 0.34797 0.34781 0.00017 Stable 5 9 0.13737 0.13729 0.00008 Stable 5 10 0.08155 0.08065 0.00090 Stable 6 8 0.02291 0.02296 -0.00004 Stable 2 8 0.12603 0.12662 -0.00059 Stable 2 7 0.01220 0.01242 -0.00022 Stable 7 24 0.01557 0.01556 0.00001 Stable 8 14 0.18769 0.18849 -0.00080 Stable 8 10 0.16847 0.16863 -0.00016 Stable 8 24 0.15687 0.15646 0.00040 Stable 9 10 0.13871 0.13873 -0.00001 Stable 15 21 0.30913 0.30834 0.00079 Stable 10 17 0.06247 0.06190 0.00058 Stable 11 12 0.14814 0.14817 -0.00004 Stable 12 14 0.15478 0.15416 0.00062 Stable 13 14 0.18048 0.18053 -0.00005 Stable 16 19 0.26757 0.26724 0.00033 Stable 17 18 0.01085 0.01099 -0.00014 Stable 17 23 0.18890 0.18904 -0.00014 Stable 17 21 0.05237 0.05141 0.00095 Stable 19 20 0.12447 0.12453 -0.00006 Stable 20 22 0.41818 0.41809 0.00009 Stable 20 23 0.30394 0.30364 0.00030 Stable 23 26 0.14388 0.14310 0.00077 Stable 12 25 0.25509 0.25507 0.00002 Stable 19 25 0.03086 0.03103 -0.00017 Stable 25 27 0.21627 0.21670 -0.00043 Stable 5 28 0.20626 0.20632 -0.00006 Stable
*Adopted from (Samuel et al., 2019)
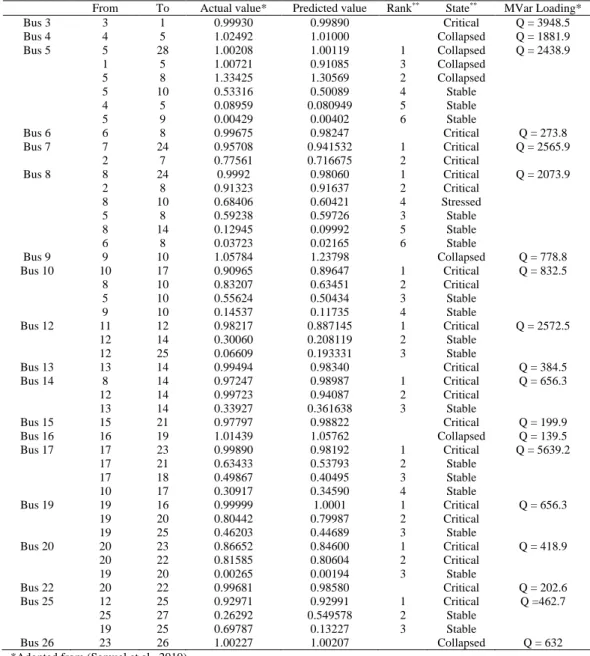
Table 5 (see in appendix) presents the actual with the predicted index values at maximum reactive power loading for each of the load buses. The results obtained indicate the ability of the proposed approach to predict voltage collapse in more complex test networks. These results are validated by those obtained in [1, 28]. Table 6 shows the ranking of buses in the NNG-28 bus system in ascending order from weakest to strongest. From the table, bus 16 was identified as the weakest bus in the system with a reactive power margin of 139.5 MVar and a percentage change of 32.06% in the voltage magnitude as it satisfies the criterion listed in [26]. The results obtained by the proposed approach agrees with those obtained in [1, 28]. An R-value of 0.9989 and an MSE value of 1.2527× 10⁻⁷were obtained using the developed
neural network model after cross-validation was done.
Table 6. Bus ranking in the NNG 28- bus system
Load Bus No From To Qmax Predicted value Ranking
16 16 19 139.5 1.05762 1 15 15 21 199.9 0.98822 2 22 20 22 202.6 0.98580 3 19 16 19 232.5 1.0001 4 6 6 8 273.8 0.98247 5 13 13 14 384.5 0.98340 6 20 20 23 418.9 0.84600 7 25 12 25 462.7 0.92991 8 26 23 26 632 1.00207 9 14 8 14 656.3 0.98340 10 9 9 10 778.8 1.23798 11 10 10 17 832.5 0.89647 12 4 4 5 1881.9 1.01000 13 8 8 24 2073.9 0.98060 14 5 5 28 2438.9 1.00119 15 7 24 7 2565.9 0.941532 16 12 11 12 2572.5 0.887145 17 3 3 1 3948.5 0.99890 18 17 17 23 5639.2 0.98192 19
5. CONCLUSION
This paper presented an ANN-based online voltage collapse prediction using the New Line Stability Index (NLSI_1). Simulations were carried out on the IEEE 14-bus system, and the Nigerian 330 kV, the 28-bus system and the results indicate that the proposed multilayer perceptron neural network-based approach could accurately predict the pre and post-contingency NLSI_1 index values under various reactive power loading. The results also suggest that there is an agreement between the actual and predicted index values obtained by conventional AC load flow and the proposed ANN approach. These results are further validated by those found in previous research work.
ACKNOWLEDGEMENTS
The authors would like to acknowledge and appreciate the Covenant University Centre for Research, Innovation, and Discovery for their support towards publishing this research work.
APPENDIX
Table 5. Comparison of actual with the predicted index values at maximum load- ability
From To Actual value* Predicted value Rank** State** MVar Loading*
Bus 3 3 1 0.99930 0.99890 Critical Q = 3948.5 Bus 4 4 5 1.02492 1.01000 Collapsed Q = 1881.9 Bus 5 5 28 1.00208 1.00119 1 Collapsed Q = 2438.9 1 5 1.00721 0.91085 3 Collapsed 5 8 1.33425 1.30569 2 Collapsed 5 10 0.53316 0.50089 4 Stable 4 5 0.08959 0.080949 5 Stable 5 9 0.00429 0.00402 6 Stable Bus 6 6 8 0.99675 0.98247 Critical Q = 273.8 Bus 7 7 24 0.95708 0.941532 1 Critical Q = 2565.9 2 7 0.77561 0.716675 2 Critical Bus 8 8 24 0.9992 0.98060 1 Critical Q = 2073.9 2 8 0.91323 0.91637 2 Critical 8 10 0.68406 0.60421 4 Stressed 5 8 0.59238 0.59726 3 Stable 8 14 0.12945 0.09992 5 Stable 6 8 0.03723 0.02165 6 Stable Bus 9 9 10 1.05784 1.23798 Collapsed Q = 778.8 Bus 10 10 17 0.90965 0.89647 1 Critical Q = 832.5 8 10 0.83207 0.63451 2 Critical 5 10 0.55624 0.50434 3 Stable 9 10 0.14537 0.11735 4 Stable Bus 12 11 12 0.98217 0.887145 1 Critical Q = 2572.5 12 14 0.30060 0.208119 2 Stable 12 25 0.06609 0.193331 3 Stable Bus 13 13 14 0.99494 0.98340 Critical Q = 384.5 Bus 14 8 14 0.97247 0.98987 1 Critical Q = 656.3 12 14 0.99723 0.94087 2 Critical 13 14 0.33927 0.361638 3 Stable Bus 15 15 21 0.97797 0.98822 Critical Q = 199.9 Bus 16 16 19 1.01439 1.05762 Collapsed Q = 139.5 Bus 17 17 23 0.99890 0.98192 1 Critical Q = 5639.2 17 21 0.63433 0.53793 2 Stable 17 18 0.49867 0.40495 3 Stable 10 17 0.30917 0.34590 4 Stable Bus 19 19 16 0.99999 1.0001 1 Critical Q = 656.3 19 20 0.80442 0.79987 2 Critical 19 25 0.46203 0.44689 3 Stable Bus 20 20 23 0.86652 0.84600 1 Critical Q = 418.9 20 22 0.81585 0.80604 2 Critical 19 20 0.00265 0.00194 3 Stable Bus 22 20 22 0.99681 0.98580 Critical Q = 202.6 Bus 25 12 25 0.92971 0.92991 1 Critical Q =462.7 25 27 0.26292 0.549578 2 Stable 19 25 0.69787 0.13227 3 Stable Bus 26 23 26 1.00227 1.00207 Collapsed Q = 632
*Adopted from (Samuel et al., 2019) **Based on the predicted value
REFERENCES
[1] I. A. Samuel, "A New Voltage Stability Index For Predicting Voltage Collapse In Electrical Power System Networks," Covenant University, 2017.
[2] P. T. Son and N. Voropai, "The Major Outage in South Vietnam in 2013 : The Nature of Blackout, Security Measures and Strategy of National Power System Modernization," International Conference on Problem of Critical Structures, pp. 177-182, 2015.
[3] O. P. Veloza and F. Santamaria, "Analysis of major blackouts from 2003 to 2015: Classification of incidents and review of main causes," The Electricity Journal, vol. 29, no. 7, pp. 42-49, 2016.
[4] Y. K. Wu, S. M. Chang, and Y. L. Hu, "Literature Review of Power System Blackouts," Energy Procedia, vol. 141, pp. 428-431, 2017.
[5] B. Liu, B. Zhou, D. Jiang, Z. Yu, X. Yang, and X. Ma, "Distributed Accommodation for Distributed Generation- From the View of Power System Blackouts," Advances in Green Energy Systems and Smart Grid. Springer, Singapore, vol. 925, pp. 236-246, 2018.
[6] H. Haes Alhelou, M. Hamedani-Golshan, T. Njenda, and P. Siano, "A Survey on Power System Blackout and Cascading Events: Research Motivations and Challenges," Energies, vol. 12, no. 4, 2019.
[7] P. Kundur, "Power System Stability And Control," McGraw-Hill, Inc., 1994.
[8] S. Sahu, S. Reddy, and S. Kumar, "New Voltage Stability Index (NVSI) for Voltage Stability Analysis in Power System," Int. J. Electr. Electron. Eng. Res., vol. 2, pp. 13-20, 2012.
[9] M. Beiraghi and A. M. Ranjbar, "Online Voltage Security Assessment Based on Wide-Area Measurements," IEEE Trans. Power Deliv., vol. 28, no. 2, pp. 989-997, 2013.
[10] J. Xu, C. Ren, W. Qin, X. Han, and P. Wang, "Voltage stability analysis based on adaptive fuzzy logic considering load fluctuation," IEEE International Conference on Power System Technology (POWERCON), pp. 1-5, 2016. [11] S. B. Panda and S. Chauhan, "Voltage Collapse Prediction By Neuro-Fuzzy (ANFIS) Scheme," Int. J. Electr.
Electron. Data Commun., vol. 2, no. 10, pp. 12-16, 2014.
[12] K. S. Sajan, V. Kumar, and B. Tyagi, "Genetic algorithm-based support vector machine for online voltage stability monitoring," Int. J. Electr. Power Energy Syst., vol. 73, pp. 200-208, 2015.
[13] A. K. Sharma, A. Saxena, B. P. Soni, and V. Gupta, "Voltage stability assessment using artificial neural network,"
IEEMA Engineer Infinite Conference (eTechNxT), pp. 1-5, 2018.
[14] D. Devaraj and J. Preetha Roselyn, "Online voltage stability assessment using radial basis function network model with reduced input features," Int. J. Electr. Power Energy Syst., vol. 33, no. 9, pp. 1550-1555, 2011.
[15] O. P. Rahi, A. K. Yadav, H. Malik, A. Azeem, and K. Bhupesh, "Power system voltage stability assessment through the artificial neural network," Procedia Eng., vol. 30, no. 2011, pp. 53-60, 2012.
[16] N. Aminudin, et al., "Risk of Voltage Collapse Using Multi-Layer Feed-Forward Neural Network and Generalized Regression Neural Network," Appl. Mech. Mater., vol. 793, no. May 2016, pp. 483-488, 2015.
[17] T.-T. Nguyen, "The neural network-based control system of direct current motor driver," International Journal of Electrical and Computer Engineering (IJECE), vol. 9, no. 2, pp. 1445-1452, 2019.
[18] V. Jayasankar, N. Kamaraj, and N. Vanaja, "Estimation of voltage stability index for power system employing artificial neural network technique and TCSC placement," Neurocomputing, vol. 73, no. 16-18, pp. 3005-3011, 2010.
[19] T. Peter and R. P. Sajith, "Voltage stability assessment in power systems using Artificial Neural Networks," Annu. Int. Conf. Emerg. Res. Areas Magn. Mach. Drives, AICERA/iCMMD 2014 - Proc., pp. 1-6, 2014.
[20] I. A. Samuel, J. Katende, C. O. A. Awosope, and A. A. Awelewa, "Prediction of Voltage Collapse in Electrical Power System Networks using a New Voltage Stability Index," Int. J. Appl. Eng. Res., vol. 12, pp. 190-199, 2017. [21] M. Hasani and M. Parniani, "Method of combined static and dynamic analysis of voltage collapse in voltage
stability assessment," Proc. IEEE Power Eng. Soc. Transm. Distrib. Conf., vol. 2005, pp. 1-6, 2005.
[22] I. Kumarswamy and P. Ramanareddy, "Analysis of Voltage Stability Using L-Index Method I. Introduction II. Fundamentals : Single Generator and Load System," Int. J. Electr. Eng., vol. 4, no. 4, pp. 483-498, 2011.
[23] M. Mathew, S. D. Babu, P. S. Venkataramu, and M. S. Nagaraj, "Effect of TCSC on Line Voltage Stability Indices under Single Line Outage Condition," Int. J. Innov. Res. Electr. Electron. Instrumentation Control Eng., vol. 3, no. 8, pp. 101–105, 2015.
[24] H. H. Goh, Q. S. Chua, S. W. Lee, B. C. Kok, K. C. Goh, and K. T. K. Teo, "Evaluation for Voltage Stability Indices in Power System Using Artificial Neural Network," Procedia Eng., vol. 118, pp. 1127-1136, 2015. [25] N. M. Nawi, W. H. Atomi, and M. Z. Rehman, "The Effect of Data Pre-processing on Optimized Training of
Artificial Neural Networks," Procedia Technol., vol. 11, pp. 32-39, 2013.
[26] M. Sanaye-pasand and A. Rezaaei-Zare, "Review and Simulation of Static Indices in Detection of Proximity To Voltage Collapse," Detection of Proximity to Voltage Collapse, 2003.
[27] C. Subramani, S. Sekhar, D. M. Arun, and M. Jagdeshkumar, "Simulation technique for voltage stability Analysis and contingency ranking in power systems," International Journal of Recent Trends in Engineering,
vol. 2, no. 5, pp. 1-5, 2009.
[28] I. A. Samuel, J. Katende, C. O. A. Awosope, A. A. Awelewa, A. I. Adekitan, and F. A. Agbetuyi, "Power system voltage collapse prediction using a new line stability index (NLSI-1): A case study of the 330-kV Nigerian National Grid," International Journal of Electrical and Computer Engineering (IJECE), vol. 9, no. 6, pp. 5125-5133, 2019.
BIOGRAPHIES OF AUTHORS
Samuel Isaac obtained his PhD Electrical and Electronics Engineering from Covenant
University, Ota, Nigeria, where he is currently a Senior Lecturer in the Department of Electrical & Information Engineering. His research areas include power system voltage stability and operation, reliability, and maintenance.
Soyemi Adebola is a master's student studying Electrical and Electronics Engineering in
the Department of Electrical & Information Engineering, Covenant University, Ota, Nigeria. Her research interests are Robotics and automation, power system control, operation, and reliability.
Awelewa Ayokunle obtained his PhD Electrical and Electronic Engineering from Covenant
University, Ota, Nigeria. He is currently a postdoctoral fellow in the Centre for Energy and Electric Power, Department of Electrical Engineering, Tshwane University of Technology, South Africa.His research areas include power system stabilization and control, and modelling and simulation of dynamical systems.
Katende James is a Professor of Electrical Engineering and a lecturer in the Department of
Electrical and Computer Engineering, Namibia University of Science and Technology, Windhoek, Namibia. His research areas include robotics and automation, power system and control, modelling and simulation of dynamical systems, and renewable energy.
Awosope Claudius is a Professor of Electrical Engineering and a lecturer in the Department of
Electrical & Information Engineering, Covenant University, Ota. His research areas include Power system reliability, operation and maintenance.