DOCUMENT DE TREBALL
XREAP2007-09
SHIFTING DEATH TO THEIR ALTERNATIVES:
THE CASE OF TOLL MOTORWAYS
SHIFTING DEATH TO THEIR ALTERNATIVES:
THE CASE OF TOLL MOTORWAYS
*Daniel Albalate†
Abstract:
A renewed interest on the use of tolls for funding motorways and regulating their
demands has been recovered in the last years. However, less attention has been put to
the road safety effects derived from this policy. Although toll motorways show quality
levels equal or above free motorways, charging users for the use of better infrastructure
shifts some traffic to their low quality adjacent alternatives. In the present study we test
whether charging for the use of the better road might negatively affect road safety in the
worst adjacent road. The results confirm our hypothesis opening a new concern.
Keywords:
Road Safety, Tolls, Motorways and Transportation.
JEL code:
H23;
I18; R48.
*
Acknowledgments
:
This research has received financial support from the Spanish Commission of Science and Technology (CICYT, SEJ2006-04985). I wish to thank Gines de Rus for hosting me in his research group in the University of Las Palmas de Gran Canaria (Spain) during the period I needed to carry out and write this study. I am also grateful to David López-Rodríguez, Montserrat Guillén and Xavier Fageda for their comments and suggestions, and to the rest of my colleagues in the Research Unit of Public Policy and Economic Regulation at the University of Barcelona. Particularly, I thank to Germa Bel for his critical and permanent advice. The usual disclaim applies.† Contact: Daniel Albalate. Grup de Recerca en Polítiques Públiques i Regulació Econòmica (PPRE) i Institut de Recerca d’Economia Aplicada (IREA). Universitat de Barcelona, Departament de Política Econòmica, Av. Diagonal 690, 08034, Barcelona, Spain. Email:albalate@ub.edu.
1. Introduction
A renewed interest on the use of tolls has been recovered over the last decade. In urban environments, tolls are mainly used to fight congestion costs while in interurban routes, particularly in the cases of motorways, bridges and tunnels, they play a double role in funding the infrastructure and regulating its traffic.
Concerns on congestion, distributional effects and political acceptability are the main aspects took into account by policy makers when they consider whether to use tolls or not when regulating the entrance to big cities or city centres. Indeed, plenty of recent literature reveal the benefits of congestion charges in practice (Santos, 2004; Santos and Gordon, 2006; De Palma et al., 2005; Leape, 2006; Glaister and Graham, 2006; Hensher and Puckett, 2007); while others face the public problem of road pricing acceptance (Brownstone et al., 2003; Raux and Souche, 2004; Fujii et al.; 2004; Jaensirisak et al. 2005; Shade and Baum, 2007).
Regarding inter-urban roads, governments usually find in toll establishment a solution to their budget constraint, especially when facing large investment needs in road infrastructures. The implementation of tolls due to these reasons is usually associated with the private sector involvement and the use of standard Build-Operate-and-Transfer franchise contract schemes (Engel et al., 2004).
It is well known, since the seminal works by Pigou (1920), Knight (1924), Walters (1961) and Vickrey (1969), that externalities should be internalized by charging road users in order to seek for allocative efficient outcomes. This concern was mainly thought to fight congestion costs and less attention was devoted to other externalities that have recently gained increasing importance like environmental effects, noise and road accidents (Verhoef et al., 1995). For the latter case, which is the core of our analysis, Edlind and Karaca-Mandic (2006) provide estimates on the size (and the sign) of the aggregate accident externality of driving in the US, finding substantial
negative externalities even in states with moderate traffic density.1
Some recent works also show how accidents increase with congestion cuts, emerging a trade-off between both externalities (Shefer and Rietveld, 1997; Dickerson et al, 2000; Martin, 2002; Noland and Quddus, 2005). However, toll setting in practice has been usually decided to fight congestion and funding infrastructure without taking into account road safety outcomes.
1 In fact, Edlin and Karaca-Mandic (2006) estimate insurance externalities by using panel data on
state-average insurance premiums and loss costs, finding that the increase in traffic density from a typical additional driver increases total state-wide insurance costs of other drivers by $1,725–$3,239 per year.
In fact, the use of tolls has never been opened to question in terms of road safety. Nevertheless, using tolls in order to charge the best roads may shift those road users that are not willing to pay
for the use of the tolled road (the so-called ‘rat-running’ drivers), even when its quality is
usually higher than its alternative road. May and Milne (2000) assert that road charging may encourage widespread diversion onto minor routes. This effect, that according to Verhoef et al. (1996) may be positively related with the elasticity of demand and negatively related with the
quality of the adjacent road, shifts some vehicles to the worst route.2 Some of them would have
used the best road if it had been free (or less expensive) and consequently, this diversion may also produce more accidents and victims.
For instance, Rothengatter (2004) claims that after setting tolls for heavy vehicles in Austria truck traffic was being diverted onto streets and roads, what is a clear example of the “rat-running” effect aforementioned. Furthermore, the potential negative safety implications of road pricing is recognised in the DfT Feasibility Study of Road Pricing in the UK, that stresses that “the impact of re-routing, if it were to occur, could in certain places and at certain times result in an increase in accident levels. This is due to the increased number of vehicles using smaller roads, not built for a high level demand, which could lead to higher accident rates” (Department for Transport, 2004; p.143). Following the same rationale, Broughton and Gower (1998) estimated that a 10 percent diversion of motorway traffic from the motorways in Kent (UK)
would increase the number of injury accidents in its entire county by about 3 ½ per cent.3
In the present paper we try to answer this hypothesis, which is whether charging users in tolled motorways, and therefore in the best quality road, damages road safety in untolled adjacent alternatives. Indeed, the results support the existence of this negative externality. This result provides a new concern for policy makers and arises some policy implications of great relevance. One of these consequences is that we should take into account road safety effects before deciding whether to use or not tolls to fund or/and regulate motorways. Furthermore, the decision on public investments must also consider these factors when deciding the resources devoted to the maintenance of these adjacent roads or the level of tolls established.
2 Among other factors, the first effect is also dependent from the second. The rationale is the lower is the
quality of the adjacent road, the more inelastic becomes the demand for the tolled motorway due to the minimization of the generalized travel costs, which include time but also expected accidents, carried out by the road user.
3 A previous study by Gower et al. (1998) suggested that a toll of 2.5p per mile (at 1994 prices) would
produce a 10% diversion level. Linked to this, Broughton and Gower (1998) estimated that this increase in the traffic flow would increase the number of injury accidents in the entire county by about 3.5 per cent taking into account traffic flows and alternative road capacities.
The present study attempts to contribute to both the road safety and transportation literatures, providing a new concern that needs to be further treated because of its importance. For instance, in terms of road safety, it is important to remember that the number of fatalities makes of road accidents one of the main causes of death in the world and the economic losses derived from crashes may be as high as the 2 per cent of GDP in western economies. Therefore, improving our understanding of its determinants is of great relevance, particularly if the factors treated were mistreated by the past literature.
This study is organized in the following form. First, we briefly introduce the related literature that might help us in our attempt to test the main hypothesis. In the third section, we describe the empirical strategy that we follow across the study and introduce the data and a first descriptive analysis. Non-parametric analysis can be found in the fifth section while the sixth is devoted to parametric estimation and its results. Finally, some concluding remarks are stated in the last section.
2. Related literature
The relationship between tolls and road safety (in their adjacent roads) has not been a major topic in the transportation literature yet. However, we can collect useful results from studies that treated similar concerns regarding road safety to understand and attempt to test the main hypothesis. Several groups of studies can be identified in the road safety literature.
First, we can mention the works inspired by the seminal work of Peltzman (1975) that try to find the main determinants of road accidents by using different levels of sophisticated techniques. This literature is closely related with the literature on insurance, risk and economic
behaviour. The so-called “offsetting behaviour”, for instance, has been of extreme relevance in
these fields.4 Loeb (1987) for determinants and Hoffer et al. (1995) and Sen (2001) regarding
the “offsetting behaviour effect” are some relevant examples.
Others, devoted their work to evaluate the effectiveness of regulatory and technical changes and enforcement interventions in order to fight road fatalities. Some of them treated the cases of
changes in speed limits (Lave, 1985; Dee and Sela, 2003), in illegal blood alcohol content levels
(Dee, 2001; Albalate, 2008), in mandatory seat belt devices (Garbacz, 1992; Loeb, 2001; and
4 The offsetting behaviour describes the situation in which a driver that enjoys better safety devices or is
Cohen and Einav, 2003), in regulatiory enforcement efforts (Welky and Zlatoper, 2007) and
many other laws and public interventions.5
More related to our work, two other groups can be mentioned and more deeply discussed. Those studies that focuse the attention on understanding which infrastructure characteristics and environmental factors influence road safety outcomes. From this group of studies we can mention Milton and Mannering (1998) and Falhaut (2004). The former isolate the effects of various highway geometric and traffic characteristics. The number of lanes, its length, the posted speed, or the share of heavy vehicles are found as relevant factors having an influence on the crash risk. Besides, Flahaut (2004) finds that 2-lane configuration is by far the most frequent type promoting road unsafety. The 2+2 lane configuration (two in each direction), is associated to safer outcomes. However, Martin (2002) stresses that in light traffic, the number of crashes is higher on 3-lane than on 2-lane motorways and higher at weekends, what implies that traffic flows and consequently speed, seem to play a more important role than infrastructure quality. In the same direction, Noland and Oh (2004) and Milton and Mannering (1998) find that increases in the number of lanes appear to be associated with increased fatalities and accidents.
Finally, a last group of studies treated the relationship between congestion (traffic-flows) and accidents. Newberry (1988) and Vitalino and Held (1991) find nearly proportional patterns, while Shefer and Rietveld (1997) and Martin (2002) show parabolic functional relationships. Dickerson et al. (2000) also confirmed a non-linear pattern, revealing that the nearly-proportional relationship may be erroneous since it may result from the aggregation of heterogeneous accident-flow relationships which do not exhibit proportionality. In particular, the magnitude of accident externality varies between road classifications and geographical areas. For the latter, Noland and Quddus (2005) asserts that the positive effect of congestion on safety outcomes may not be occurring in urban zones but may still be present on motorways and high speed roads.
Furthermore, Shefer and Rietveld (1997) stresses that traffic composition plays a role too, in the sense that more heavy vehicles in traffic adversely affect road safety, jointly to speed factors (average and variance).6
Since congestion is identified as a negative externality, this increase in the number of vehicles in the road offers positive externalities in terms of road safety that must also be considered and
5 See, for example, Loeb (1990) and Leigh (1994) for studies on vehicle safety inspections.
6 Rienstra and Rietveld (1996) find that speed variation is higher in motorways and roads with higher
somehow can offset part of the negative effects that arise from waste of time and pollution. In fact, as it is explained in Peirson et al. (1998), although more cars in a road may increase crash risk, higher levels of traffic promotes a slow down in the average speed that makes driving a safer activity by lowering probabilities of fatal accidents. Indeed, road accidents may still continue to increase but the severity of these accidents will result in injuries or physical damage to motor vehicles (Shefer and Rietveld, 1997). This is what leads Noland and Quddus (2004) to claim that increasing speeds by fighting congestion may have adverse safety consequences. The present study takes advantage of these results in order to attempt a different concern, which is the relationship between setting tolls in the best quality road (toll motorways) and the accident externalities suffered for this reason in the worst quality adjacent roads. In the next section we describe the data used and the empirical strategy pursued.
3. Empirical strategy and data
To test our main hypothesis we take advantage of the particular and exceptional situation given
in Spain. This is a country which presents tolled and untolled routes in its motorway network.7
This mixed and rare model, offers two different types of regimes that allow us to compare the adjacent conventional freeways, which show lower quality and are quite homogeneous in the whole country. These roads are called “National Roads” and belong to the primary network of the state (high speed conventional roads). For all these reasons, comparing those national roads that compete with tolled motorways, with those adjacent to the untolled, gives us the opportunity to test whether their safety outcomes are affected by the regime established in the high capacity infrastructure.
After describing in this section the Spanish database used and the variables employed to test the main hypothesis, a first stage of the empirical strategy is the use of descriptive statistics and non-parametric estimations (in the next section) in order to give a first overview of the problem analyzed. This stage is thought as a complement to the parametric analysis carried out later and to provide the functional relationships that exist between safety outcomes and the rest of variables.
Multivariate analysis is presented in the fifth section. Least squares estimates are applied to estimate the effect of being the alternative to a tolled motorway in terms of road safety, while other factors are also considered to avoid confounding effects.
3.1. Data and variables
Data on accidents is collected from the “Traffic Map” of the Spanish General Traffic Directorate, which is database containing information on accidents involving victims per km,
average speeds and traffic composition from national roads and free motorways.8 Since we are
only interested in those sections that compete with motorways (tolled and untolled), we only use the data collected by the control stations established there, avoiding the use of data related to other not adjacent sections.
This study uses the information regarding the year 2002 when 123 control stations were placed
in national roads adjacent to motorways.9 These 123 stations belong to the permanent, primary
and secondary station types, which are the ones that report the aforementioned information. Third level stations are not considered since no consistent and robust information is available there.
Table 1 displays the variables used in the next sections, their definition and finally, their
descriptive statistics. Also, in the appendix (A1), we reporttheir correlations.
<< Insert Table 1 about here >>
The variable used to identify road safety outcomes is the number of accidents involving victims
per km, which is the variable reported by the “Traffic Map” database.10 Fortunately, since road
characteristics are quite homogeneous across national roads in Spain, we do not need to suffer from not having infrastructure characteristics in that database. In fact, we only distinguish conventional roads and free motorways (or dual carriageways), both competing with another
8 The Database does not offer information on toll motorways since in Spain those infrastructures are
franchised to the private sector. Furthermore, the database does not contain data on the provinces that belong to the regions of the Basque country and Navarra.
9 The same database is available for the year 2004 but several provinces of special interest (having
national roads close to motorways) do not provide information on accidents per km, though they give the rest of information. Since these losses are not randomly distributed in the territory and due to the downfall in the total number of observations, we decided to carry out the study with the 2002 database. However, similar results are found using 2004 data on the variable of interest, which is whether tolls have an impact on road unsafety. Other variables do not show the same consistency using that database and the power of explanation of the model of estimation used is lower. These results are available upon request.
10 Control stations collects data on sections of different lengths. This is the reason why the variable
tolled or untolled motorway. This binary variable which receives value 1 when the control station is placed in a motorway and 0 when is placed in a conventional road, is thought to capture the infrastructure quality factor that may affect road safety. In both cases they are alternatives to a tolled or untolled motorway.
Therefore, the variable of interest in the current study is the use a binary variable to identify, using 1 in such a case, those roads adjacent to tolled motorways, and 0 those close to a free motorway. Information on average daily traffic (ADT) and average speeds are also taken into account. Moreover, the database provides information on traffic composition, displaying the data sorted by type of vehicle (light, heavy and motorbikes) and the number of foreigners using that road.
The number of vehicles in the province where the control station is placed and the distance from this station to the nearest big city are both also considered in the present study.
Finally, in order to know whether being a link between two countries may make a difference, we also introduce the variable border, which identifies those sections close to international borders.
3.2. Descriptive analysis
Table 2 shows some descriptive statistics for the 123 control stations chosen, first for the total sample and afterwards sorted by type of alternative (alternative to tolled motorway or alternative to free motorway).
<<Insert Table 2 about here >>
As it is shown, those national roads competing with a tolled motorway present higher average daily traffic (ADT) - the double for light vehicles and more than three times for heavy vehicles- and slower average speeds. More importantly, they suffer more accidents involving victims per km than those that compete with untolled motorways. Again, their composition also shows bigger percentages of heavy vehicles.
This information seem to point out that something different is happening in routes which are adjacent to tolled motorways. After examining this information, one could conclude that those routes with tolled motorways shift traffic to the untolled alternative, which is a lower quality infrastructure and thus, more accidents happen. Since more vehicles – particularly heavy vehicles - are placed in national roads, congestion levels and therefore, average speed levels are
also affected. This could explain why drivers usually drive fast in those national roads adjacent to untolled motorways.
Toll motorways are usually set in those corridors accounting for higher levels of traffic and this could explain the high number of accidents. In fact, since private franchisers operate those infrastructures, enough traffic is needed to recover the investment and achieve a significant financial benefit from their operation. Therefore, toll motorways are not randomly established in the territory. This could also explain why they are usually (not always) established in places with high economic activity and high number of vehicles in the province, and why their average speeds respond to it. In addition, since the literature finds that congestion helps road safety outcomes, descriptive results would suggest that congestion may offset the effects of high traffic, but not enough to provide a decreasing relationship.
Table 3 displays more descriptive statistics allowing for some interactions that may help to
clarify some relationships between variables. This table 3 will be of a very important help in the
interpretation of results reported by the parametric analysis in section 5.
Descriptive analysis from table 3 also suggests that those routes placed close to urban
agglomerations suffer more accidents due to high ADT, even when they report slower speeds. The same can be added when taking into account the number of vehicles that are driven in the province where the control station is established.
Free motorways, which are at the same time substitutes from another motorway (tolled or untolled), are obviously showing higher speeds due to its physical characteristics, higher ADT and therefore, more accidents per km, than the rest of national roads. Moreover, they are placed in areas with a high motorization level, justifying the need for larger infrastructures. The same share of heavy vehicles is found between free motorways (adjacent to another motorway) and national roads, what means that given the high ADT suffered by these roads, many more trucks travel using free motorways when they are available.
In sections close to international borders average speeds are lower, the presence of heavy vehicles bigger, and accidents per km are less than the sample mean. In fact, average daily traffic for light vehicles is quite low in comparison with the sample mean. On the contrary, the number of trucks is closer to its mean.
Finally, descriptive analysis suggests that those corridors where more foreigners drive (they enjoy a bigger share), worse safety records are found, even though they are obviously more present in sections close to borders.
<< Insert Table 3 about here >>
4. Non-parametric analysis
Once examined some descriptive statistics, we proceed to undertake some non-parametric
estimations. Kernel regressions presented in figures 1 and 2 offer similar results and also
provide information on the functional relationships between these variables and accidents involving victims. First, we find an increasing relationship between accidents and ADT that becomes decreasing after reaching a certain level. This inverted U-shape relationship is consistent with the recent literature finding non-linear functional forms as mentioned in section 2.
<< Insert Figures 1 and 2 about here >>
Regarding average speed, we find a very short first interval in which speed is positively correlated with accidents but fast this becomes linear and decreasing.
Again, a decreasing relationship arises when we replicate this estimation with the share of trucks, the number of vehicles in the province and the distance from the control station to the nearest big city. We find a clear decreasing and quite lineal form for the latter, meaning that urban environments produce more accidents involving victims per km. A more strange non-lineal relationship exists between the share of trucks and accidents involving victims per km, and especially for the number of vehicles in the province. Indeed, being in a province with a high level of motorization imply more accidents until a certain number of vehicles, where the relationship changes and becomes decreasing and further becomes quite stable. On the contrary, more difficult is to identify the relationship between motorbikes and accidents, though some increasing trend is found in its higher percentatges.
Finally, the number of foreigners, which may be used to see the role played by tourists and to identify great international corridors, seem to report an inverse U-shape relationship with accidents per km. More foreigners imply more accidents per km but after a certain point this relationship also becomes decreasing.
On the other hand, non-parametric regressions are not applied to binary variables because of the lack of relevance, since no observations reporting outcomes different from 0 or 1 are offered. In fact, if we carry out spline regressions for these kind of variables we find only a linear relationship. For instance, for the binary variable identifying untolled motorways competing with another tolled or untolled one, we find a positive relationship between them and accidents involving victims per km. On the contrary, the Spline for the dummy related to sections close to an international border does provide a clear decreasing relationship. On regards the dummy identifying national roads competing against toll motorways a clear positive pattern is found.
These splines for binary variables are displayed in the appendix (A2).
As was mentioned above, descriptive analysis and non-parametric estimations are informative and useful to complement multivariate analysis, interpret its results and explain some of the relationships that exist between variables. Next section attempts to explain these relationships in a clearer and more robust way by taking into account all factors that may play a role in the effect of tolls on their alternatives.
5. Parametric estimation and results
The lack of theoretical background on the question studied in the current research prevents from having a common model to be improved or modified and tested. However, we can take advantage of previous literature on road safety to determine the relationships that may exist between accidents involving victims per km and different regressors. Useful information may also be obtained from univariate analysis stated above.
A common semilog model is considered in this section to examine the role tolls play in the
safety outcomes found in national roads. Equation 1 presents that model, where Yi denotes the
number of accidents involving victims per km reported by the ith control station, X is the vector
of regressors described in table 1, and εi ~ iid N(0,σ2) denotes the random error.
lnYi = α + βXi + εi (1)
Least Squares estimates for semilog models correcting by heteroskedasticity and taking into
account all control variables are applied. Results may be checked in table 4.11
<< Insert table 4 about here >>
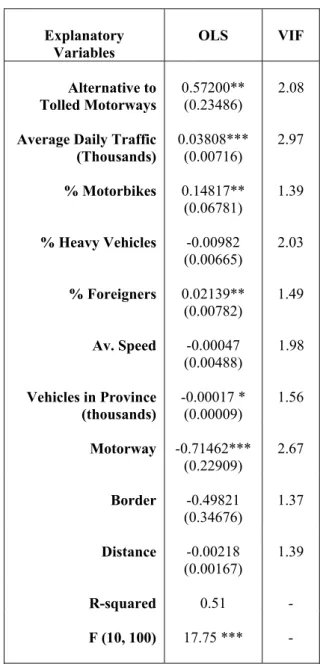
As we can see, the coefficient associated to the variable identifying a national road being alternative to a tolled motorway appears statistically significant and showing positive sign. Therefore, from OLS estimation, we find that having tolls may lead to more accidents per km in their alternative conventional and untolled road, even when controlling by several factors including ADT and number of vehicles in the province.
Regarding the rest of variables, though this study is not focused in how and why accidents are produced beyond the variable of interest, it is interesting to see how they influence road safety in terms of our dependent variable. ADT, as expected, is one of the strongest factors explaining accidents involving victims per km.
Traffic composition is also analized and reports opposite results. The share of motorbikes is associated with worse safety outcomes, while the share of heavy vehicles does not seem to play a significant role, at least in terms of the dependent variable used to denote that road safety. In fact, past research found mixed results on the role played by heavy vehicles. Some studies support the idea that trucks are associated to unsafety while others just find the opposite result. Milton and Mannering (1998), for instance, found negative relationships between them and crashes but linked this result to the low ADT enjoyed by those routes where trucks present high shares. Particularly, they explain that “where ADT is low, truck percentages rapidly increase with only a few additional trucks. Hence, where ADT is low, accident frequencies may decrease because of a lack of conflicts, not because of increased truck traffic”.
Going back to table 3, when we sort the sample by the share of heavy vehicles, we do realize
that their concern is consistent with the descriptive statistics of our sample. If we consider the absolute number of heavy vehicles and the distance to big cities, we realize that this type of vehicle enjoys bigger shares in national roads with low ADT which are far from urban agglomerations. Therefore, since fewer accidents are suffered in provinces with low numbers of vehicles and low ADT, trucks appear to be related with safer results. In both cases, the share of trucks and the number of accidents are just consequences of low ADT. This also explains why the share of heavy vehicles is positively related to speed, something which may seem contra-intuitive.
The fact of considering the vehicles in the province and the distance to a big city may partially explain why in our results we do not find a negative but statistical significant relationship
between percentages of heavy vehicles and accidents, as was suggested by the univariate analysis in previous sections.
Similar concerns may apply in the case of average speed. As is shown in previous sections, where ADT levels are low and therefore fewer accidents happen, drivers usually drive fast. The fact of not finding many other vehicles and therefore avoiding conflicts in the road may prevent of having a positive effect on accidents involving victims. Besides, we should take into account that the variable capturing speed is an average, while some studies like Shefer and Rietveld (1997) provide more interesting concerns on its variance (speed differences).
In the same direction, being a motorway (or a dual carriageway) is associated to fewer accidents involving victims per km. The quality of the road in this case in terms of number of lanes, two carriageways and better pavement justifies this result. Therefore, having a good substitute benefits road safety when a toll motorway is established.
In table 3, we observe that higher speeds are found in free motorways competing against other motorways (tolled or untolled) than in conventional national roads. At the same time, these are better infrastructures that receive high ADT and are usually established close to big cities in provinces with high levels of motorization. For sure, good outcomes are expected from its better quality. However, univariate analysis was unable to distinguish this quality from other elements leading to confounding effects. Multivarite analysis provides the expected relationship.
Moreover, this result cannot be compared with the works of Martin (2002), Noland and Quddus (2005) or Milton and Mannering (1998), who specifically found a positive statistically significance from considering more lanes in the same road. On the contrary, it is consistent with results reported by Flahaut (2004).
The number of vehicles in the province is negatively correlated with accidents. Probably
congestion in such areas – slower speeds apply in these provinces as shown in table 3 – may
partially explain this result. In any case, this is consistent with Albalate (2008) where motorization is found negatively related with the rate of road fatalities in Europe. Furthermore, ADT in these places could be so high that reach the point we asserted in the non-parametric estimation which is also confirmed by recent studies treated in section 2, where after a certain
ADT level, more vehicles just reduce the number of accidents with victims. In fact, in table 3
we found that those routes placed in provinces with high number of vehicles presented the highest ADT levels.
Regarding borders and the presence of foreigners, we find that only the second one is statistically significant. The coefficient associated to the dummy denoting those sections close to an international border, does not appear statistically significant and positively correlated with road safety, as it was suggested in previous sections. Multivariate analysis clarify this effect by taking into account the low ADT and slow speeds that apply in these sections. On the contrary, the presence of foreigners, which is showing statistically significant effects, provides bad impacts on road safety. Both results are especially interesting since the presence of foreigners in international borders is very high.
As a result, high Average Daily Traffic, particularly light vehicles and foreigners, and being the alternative to a tolled motorway, have a negative impact on road safety, described as the number of accidents involving victims per km. On the contrary, better infrastructures (being a motorway instead of a conventional road) and being placed close to urban agglomerations, in provinces presenting high levels of motorization, and absence of congestion captured by higher average speeds in interurban roads are positively related with road safety.
Variance inflation factors (VIF) are also tested in order to check possible multicollinearity
problems. The third column in table 4 displays their results. As is shown, no regressor suffers
from a VIF greater than 10, which is the rule of thumb associated with potential collinearity. This test is more powerful than correlation analysis since it captures associations between more
than two independent variables.12
To summurize, setting tolls in motorways seem to affect road safety in the adjacent roads, even when we control by several factos that may play a role in the production of road accidents involving victims. Some other relationships of interest are also reported thanks to multivariate analysis.
6. Concluding Remarks
The use of tolls is being widespread around the world due to its ability to regulate traffic demands and fund infrastructure projects. Researchers and practitioners put their efforts in developing the double function of tolls, applying optimal pricing schemes to fight congestion, particularly in urban and metropolitan areas, and solving budget constraints in interurban routes.
12 VIF values are given by (1-R
i2)-1, where Ri2 is the R2 from regressing the ith independent variable on
all the other independent variables. “It is a measure of the amount by which the variance of the ith coefficient estimate is increased (relative to no collinearity) due to its linear association with the other explanatory variables” (Kennedy, 2003; pag. 213).
However, its road safety effects are not usually evaluated and, as it is shown in the present study, may be substantially large and negative.
Indeed, setting tolls in the best infrastructure seems to shift road unsafety to their adjacent and lower quality alternatives. After controlling by several factors, we find that those roads competing with tolled motorways presented more accidents involving victims than those roads competing against untolled motorways.
In fact, we have seen how having a free motorway competing against another motorway produce fewer accidents involving victims than simple conventional roads competing against them. Therefore, investments in quality or making roads (tolled motorways and conventional roads) more substitutes may have a positive impact in terms of road crashes.
For sure, further research is needed to understand the reasons behind this effect. For instance, more information on infrastructure characteristics, investments in construction and maintenance, behavioural attitudes and environmental factors should be introduced in the analysis to make sure the robustness of this relationship. Moreover, case studies and spatial autocorrelation estimation models may also be some of the future improvements to the estimation strategies carried out in this direction. Other improvements in the limited data available should also be guaranteed.
In spite of these limitations and possible improvements, our results also arise some interesting public policy implications too. First, one question we need to answer is whether or not optimal pricing schemes should also take into account and introduce the unsafety externality imposed to
the alternative roads. In this direction, if high tolls provide more “rat-running” effect and shifts
unsafety to the untolled alternative, we may have reasons to reduce such a price level in order to internalize that externality and minimize road unsafety. Perhaps, not only congestion should be captured by first best pricing but also accident externalities, and furthermore, not only in the same road (second best pricing).
Otherwise, if optimal pricing does not include the unsafety shift to other roads, governments should take into account them and provide the enough investment to make sure that those routes are as safe as those that compete with untolled motorways.
Besides, governments should also consider these safety outcomes in the analysis that lead them to establish tolls in their high capacity roads, particularly when this network already exists.
References
Albalate, D. (2008) “Lowering blood alcohol content levels to save lives: the European
experience”, Journal of Policy Analysis and Management, 27(1),forthcoming.
Bel, G. and Fageda, X. (2005) “Is a mixed funding model for the highway network sustainable
over time? The Spanish Case”, in G. Ragazzi & W. Rothengatter, eds., Procurement and
Financing of Motorways in Europe. Elsevier, pp. 195-211.
Brownston, D., Ghosh, A., Golob, T., Kazimi, C. and Van Amelsfort, D. (2003) “Drivers_ willingness-to-pay to reduce travel time: evidence from the San Diego I-15 congestion
pricing project” Transportation Research PartA, 37, pp. 373–387.
Broughton, J., and Gower, P. (1998) The likely effects of motorway tolling on accident risk –
phase 2. TRL Report TRL352. Transport Research Laboratory: Crowthorne, United
Kingdom.
Cohen, A. and Einav, L. (2003) “The effects of mandatory seat belt laws on driving behavior
and traffic fatalities”, The Review of Economics and Statistics 85 (4), pp. 828-843.
Dee, T. (2001) “Does setting limits save lives? The case of 0.08 BAC laws”, Journal of Policy
Analysis and Management, 20(1), pp. 111-128.
Dee, T. and Sela, R. (2003) “The fatality effects of highway speed limits by gender and age”,
Economic letters, 79, pp. 401-408.
De Palma, A., Kilani, M. and Lindsey, R. (2005) “Congestion pricing on a road network: A
study using the dynamic equilibrium simulator METROPOLIS”, Transportation Research
Part A, 39, pp. 588–611
Department for Transport (2004). Feasibility Study of Road Pricing in the UK. Department for
Transport. London.
Dickerson, A., Peirson, J. and Vickerman, R. (2000) “Road Accidents and Traffic Flows: An
Econometric Investigation”, Economica, New Series, 67(265), pp. 101-121.
Edlin, A. and Karaca-Mandic, P. (2006) “The accident externality from driving”, Journal of
Political Economy, 2006, 114(5), pp. 931-955.
Engel, E., Fischer, R. and Galetovic, A. (2004) “Toll competition among congested roads”
Topics in Economic Analysis & Policy , 4( 1), article 4.
Flahaut, B. (2004) “Impact of infrastructure and local environment on road unsafety Logistic
modelling with spatial autocorrelation”, Accident Analysis and Prevention, 36, pp.
1055-1066.
Fujii, S., Garling, T., Jakobsson, C. and Jou, R. (2004) “A cross-country study of fairness and infringement on freedoms as determinants of car owners’ acceptance of road pricing”,
Garbacz, C. (1992) “More Evidence on the Effectiveness of Seat Belt Laws”, Applied Economics, 24, pp. 313-315.
Glaister, S. and Graham, D. (2006) “Proper Pricing for Transport Infrastructure and the Case of
Urban Road Congestion”, Urban Studies, 43(8), pp. 1395–1418.
Gower, P., Shearn, S. and Mitchell, J. (1998) “Motorway tolling: Modelling the impact of
diversion” TRL Report TRL349. Transport Research Laboratory: Crowthorne, Berks.
Hensher, D. and Pukett, S. (2007) “Congestion and variable user charging as an effective travel
demand management instrument”, Transportation Research Part A, 41, pp. 615–626
Hoffer, G., Millner, E. and Peterson, S. (1995) “Are Drivers of Air-Bag-Equipped Cars More
Aggressive? A test of the Offsetting Behavior Hypothesis”, Journal of Law and
Economics, 35, 251-263.
Jaensirisak, S., Wardman, M. and May, A. (2005) “Explaining variations in public acceptability
of road pricing schemes”, Journal ofTransport Economics and Policy, 39(2), pp. 127–
153.
Kennedy (2003) A guide to econometrics.
Knight, F. (1924) “Some fallacies in the interpretation of social cost” Quarterly Journal of
Economics, 38, pp. 582-606.
Leape, J. (2006) “The London congestion charge” Journal of Economic Perspectives, 20(4), pp.
157–176.
Lave, C. (1985) “Speeding coordination and the 55-mph limit”, American Economi Review, 75, pp. 582-606.
Leigh, P. (1994): Non-random assignment, vehicle safety inspections laws and highway
fatalities. Public Choice 78, 373-387.
Loeb (1987) “The determinants of automobile fatalities, with special consideration to policy
variables” Journal of Transport Economics and Policy, 21, pp. 279-288.
Loeb, P. (1990) “Automobile safety inspection: Further econometric evidence” Applied
Economics, 22, 1697-1704.
Loeb, P. (2001) The effectiveness of seat belt legislation in reducing driving-involved injury rates in maryland. Transportation Research Part E 37, 297-310.
Martin, J. (2002) “Relationship between crash rate and hourly traffic flow on interurban
motorways”, Accident Analysis and Prevention, 34, pp. 619-629.
May, A. and Milne, D. (2000) “Effects of alternative road pricing systems on network
performance”, Transportation Research Part A, 34(6), pp. 407-436.
Milton, J., Mannering, F., 1998. The relationship among highway geometrics, traffic-related
elements and motorvehicle accident frequencies. Transportation 25, 395–413.
Noland, R. and Oh, L. (2004) “The effect of infrastructure and demographic change on
traffic-related fatalities and crashes: a case study of Illinois country-level data”, Accid. Anal.
Prev. 36, pp. 525–532.
Noland, R. and Quddus, M. (2004) “A spatially disaggregate analysis of road casualties in
England” Accident Analysis and Prevention, 36, pp. 973–984
Noland, R. and Quddus, M. (2005) “Congestion and Safety: A Spatial Analysis of London”,
Transportation Research: Part A: Policy and Practice, 39(7-9), pp. 737-54.
Peltzman, S. (1975) “The effects of automobile safety ragulations”, Journal of Political
Economy, 83 (4), pp. 677-725.
Peirson, J., Skinner, I. and Vickerman, R. (1998) The microeconomic analysis of the external
costs of road accidents, Economica, 65, pp. 429-440.
Pigou, A. (1920) The Economics of Welfare. London: MacMillan.
Raux, C. and Souche, S. (2004) “The Acceptability of Urban Road Pricing: A Theoretical
Analysis Applied to Experience in Lyon”, Journal of Transport Economics and Policy,
38(2), pp. 191-216
Rienstra, S. and Rietveld, P. (1996) “Speed Behaviour of Car Drivers: A Statistical Analysis of
Acceptance of Changes in Speed Policies in the Netherlands”, Transportation Research:
Part D: Transport and Environment, 1(2), pp. 97-110.
Rothengatter (2004) “Motorways and motorway finance in Germany and Austria”, in Ragazzi,
G and W. Rothengatter (eds.), Procurement and Financing of Motorways in Europe.
London: Elsevier, pp. 75-91.
Santos, G. (2004) “Urban Congestion Charging: A Second-Best Alternative”. Journal of
Transport Economics and Policy, 38(3), pp. 345-369.
Santos, G. and Gordon, F. (2006) “Road Pricing: Lessons from London”, Economic Policy, 46,
pp. 263-305.
Shade, J. and Baum, M. (2007) “Reactance or acceptance? Reactions towards the introduction
of road pricing”, Transportation Research Part A, 41, pp.41-47.
Shefer, D. and Rietveld, P. (1997) “Congestion and safety on highways: towards an analytical
model. Urban Studies, 34, pp. 679-692.
Sen, A. (2001) “An empirical test of the offset hypothesis”, The Journal of Law and Economics
44, pp. 481–510.
Shefer, D. and Rietveld, P. (1997) “Congestion and safety on highways: towards an analytical
model”, Urban Studies, 34(4), pp. 679-692.
Verhoef, E.T., P. Nijkamp and P. Rietveld (1995) “Second-best regulation of road transport
externalities”, Journal of Transport Economics and Policy, 29(2), pp. 147-167.
Verhoef, E.T., P. Nijkamp and P. Rietveld (1996) “Second-best congestion pricing: the case of
Vickrey, (1969) “Congestion Theory and transport investment” Amercian Economic Review, 59,
pp. 251-260.
Vitalino, D. and Held, J. (1991) “Road accident external effects an empirical assessment”,
Applied Economics, 23, pp. 373-378
Walters, A. (1961) “The theory and measurement of private and social cost highway
congestion”, Econometrica, 23, pp. 373-378.
Welky, A. and Zlatoper, T. (2007) “The impact of highway safety regulation enforcement
Tables and figures
Table 1: Definitions of Variables and Descriptive Statistics.
Variables Definition Obs. Mean SD
Acc/km Number of Accidents Involving Victims/Km. 123 1.2 1.1
Alternative to
Tolled Motorway National Road competing against a Tolled Motorway (Binary Variable) 123 0.6 0.5 ADT Average Daily Traffic 123 16,800 1,734
% Moto Share of Motorbikes on Total ADT 123 0.86 0.07
% Heavy Share of heavy Vehicles on Total ADT 123 18.7 14.3
% Foreigners Share of Foreigners on Total ADT 123 4.20 0.92
Av. Speed Average Speed Collected in Control Stations (Km/h) 111 86.5 19.1 Motorway Free Motorway competing against a Tolled or
Untolled Motorway (Binary Variable) 123 0.1 0.3 Vehicles in
Province
Number of Road Vehicles in the Province. 123 671,506 808,593 Border Control Station placed close to International Border
(Binary Variable)
123 0.1 0.3 Distance Distance (Km) to the nearest big city having more
than 200.000 inhabitants 123 79.7 49.9
Note: The total number of control stations of interest is 123. However, some of them do not provide information on average speeds. This is the reason of not having 123 observations in that case.
Table 2: Comparing types of alternatives.
Stations Acc/Km Heavy % vehicles % Foreigners Average Speed Vehicles in Province Sample Average 1.21 18.7 4.20 86.5 671,506 Alternatives to Toll 1.49 21.3 4.61 82.1 849,751 Alternatives to Free 0.84 14.9 3.60 94.1 402,320
Table 3: Descriptive statistics sorted by groups.
Stations ACV/KM ADT % Motorbikes % Heavy % Foreigners Av. Speed Vehicles in Province Distance ACV/Km < 1.2 - 9,828 0.71 20.4 3.66 90.5 555,867 90.5 ACV/Km ≥ 1.2 - 28,885 1.11 15.9 5.15 79.1 871,947 60.8 ADT < 16,800 0.89 - 0.84 21.5 5.35 88.3 375,278 96.1 ADT ≥ 16,800 1.93 - 1.99 13.3 2.08 82.8 1,263,963 46.7 % Motorbikes < 0.86 1.16 14,387 - 22.1 4.21 88.8 493,594 85.2 % Motorbikes ≥ 0.86 1.40 21,998 - 11.4 4.18 80.3 1,054,699 67.7 % Heavy < 18.7 1.42 19,084 1.24 - 2.54 84.3 802,778 69.7 % Heavy ≥ 18.7 0.87 12,233 0.81 - 7.52 90.9 408,960 99.6 % Foreigners < 4.20 1.20 17,221 0.82 16.2 - 87.1 718,507 73.2 % Foreigners ≥ 4.20 1.35 15,496 0.97 26.5 - 84.7 525,800 99.5 Average Speed < 86.5 1.42 17,159 0.92 14.4 4.15 - 786,999 70.3 Average Speed ≥ 86.5 1.06 16,470 0.81 22.8 4.25 - 565,035 88.3 Motorway = 1 2.13 54,166 0.81 18.5 2.15 105.6 1,288,125 47.4 Motorway = 0 1.12 11,610 0.87 18.8 4.49 84.4 585,864 84.1 Vehicles in Province < 671,506 0.97 10,602 0.69 21.1 4.80 21.1 - 93.5 Vehicles in Province ≥ 671,506 2.00 34,427 1.36 12.1 2.51 12.1 - 40.4 Border = 1 0.80 10,955 0.98 25.0 24.07 77.2 366,539 114.9 Border = 0 1.27 17,262 0.85 18.2 2.63 87.3 695582 76.9 Distance < 79.7 1.54 23,406 1.05 14.6 2.44 82.0 1,035,192 - Distance ≥ 79.7 0.90 9,398 0.65 23.3 6.18 91.5 263.926 -
Figure 1: Kernel Regressions for Accidents involving victims. [k(6), np(100)]
A. Kernel Regression for Acv/km B. Kernel Regression for Acv/km C. Kernel Regression for Acv/km
Average Daily Traffic (ADT) % Motorbikes % Heavy vehicles
Kernel regression, bw = __00000F, k = 6 Grid points 264 99146 .483604 5.14475 Kernel regression, bw = __00000F, k = 6 Grid points 0 .056244 .953265 2.67 Kernel regression, bw = __00000F, k = 6 Grid points 2.47 97.1 .47 1.86442
Figure 2: Kernel Regressions for Accidents involving victims. [k(6), np(100)]
D. Kernel Regression for Acv/km E. Kernel Regression for Acv/km F. Kernel Regression for Acv/km % Foreigners Distance to big cities (km) Number of vehicles in Province
Kernel regression, bw = __00000F, k = 6 Grid points 0 5240 .881576 3.81571 Kernel regression, bw = __00000F, k = 6 Grid points 0 244 .200178 1.82653 Kernel regression, bw = __00000F, k = 6 Grid points 80070 3.6e+06 .678136 2.41715
Table 4: Parametric Estimation Results. Least Squares Estimates for semilog models. (N= 111). Dependent Variable: ln Accidents involving victims per km.15
Explanatory
Variables OLS VIF
Alternative to
Tolled Motorways 0.57200** (0.23486) 2.08 Average Daily Traffic
(Thousands) 0.03808*** (0.00716) 2.97 % Motorbikes 0.14817** (0.06781) 1.39 % Heavy Vehicles -0.00982 (0.00665) 2.03 % Foreigners 0.02139** (0.00782) 1.49 Av. Speed -0.00047 (0.00488) 1.98 Vehicles in Province (thousands) -0.00017 * (0.00009) 1.56 Motorway -0.71462*** (0.22909) 2.67 Border -0.49821 (0.34676) 1.37 Distance -0.00218 (0.00167) 1.39 R-squared 0.51 - F (10, 100) 17.75 *** -
Note 1: Heteroskedastic-consistent standard errors are reported in parenthesis. * Statistically significant at the 10% level; ** at 5% level and *** at 1% level.
Note 2: The number of observations dropped from 123 to 111 due to the lack of information for at least one of the variables used in the specification.
15 Since several observations lay between 0 and 1 we re-scaled the dependent variable in order to avoid
Appendix
A1: Correlations between variables employed in the analysis.
Acc/Km Alternative to Tolled
ADT %Motorbikes % Heavy % Foreigners Av. Speed Motorway Vehicles Border Distance
Acc/Km 1 Alternative to Tolled 0.2794 1 ADT 0.6580 0.3034 1 % Motorbikes 0.1924 -0.1170 0.1107 1 % Heavy -0.2264 0.3700 -0.1374 -0.3762 1 % Foreigners 0.0557 0.2043 -0.0416 0.0597 0.1408 1 Av. Speed -0.2227 -0.3055 -0.0358 -0.2203 0.3389 -0.1813 1 Motorway 0.3422 0.1289 0.6957 -0.0839 0.0754 -0.0429 0.3332 1 Vehicles 0.1897 0.2288 0.4006 0.3775 -0.2466 -0.0565 -0.1827 0.1617 1 Border -0.1014 -0.0033 -0.0626 0.1097 -0.0509 0.4817 -0.1363 -0.0924 -0.0893 1 Distance -0.3019 -0.1095 -0.3726 -0.2046 0.2353 0.2230 0.1781 -0.1469 -0.3721 0.1912 1
A2. Spline Regressions for Accidents involving victims.
A. Spline Regression for Acv/km B. Spline Regression for Acv/km C. Spline Regression for Acv/km
Motorway (or dual carriageway) Border Alternative to Tolled Motorway
.9 1 1. 1 1. 2 1. 3 1. 4 M edia n s p line 0 .2 .4 .6 .8 1 motorway .6 .7 .8 .9 1 Median spli ne 0 .2 .4 .6 .8 1 border .4 .6 .8 1 1. 2 M e dian s p line 0 .2 .4 .6 .8 1 TOLL
2006
CREAP2006-01
Matas, A. (GEAP); Raymond, J.Ll. (GEAP)
"Economic development and changes in car ownership patterns" (Juny 2006)
CREAP2006-02
Trillas, F. (IEB); Montolio, D. (IEB); Duch, N. (IEB)
"Productive efficiency and regulatory reform: The case of Vehicle Inspection Services" (Setembre 2006)
CREAP2006-03
Bel, G. (PPRE-IREA); Fageda, X. (PPRE-IREA)
"Factors explaining local privatization: A meta-regression analysis" (Octubre 2006)
CREAP2006-04
Fernàndez-Villadangos, L. (PPRE-IREA)
"Are two-part tariffs efficient when consumers plan ahead?: An empirical study" (Octubre 2006)
CREAP2006-05
Artís, M. (AQR-IREA); Ramos, R. (AQR-IREA); Suriñach, J. (AQR-IREA) "Job losses, outsourcing and relocation: Empirical evidence using microdata" (Octubre 2006)
CREAP2006-06
Alcañiz, M. (RISC-IREA); Costa, A.; Guillén, M. (RISC-IREA);Luna, C.; Rovira, C.
"Calculation of the variance in surveys of the economic climate” (Novembre 2006)
CREAP2006-07
Albalate, D. (PPRE-IREA)
"Lowering blood alcohol content levels to save lives: The European Experience” (Desembre 2006)
CREAP2006-08
Garrido, A. (IEB); Arqué, P. (IEB)
“The choice of banking firm: Are the interest rate a significant criteria?” (Desembre 2006)
CREAP2006-09
Segarra, A. (GRIT); Teruel-Carrizosa, M. (GRIT)
"Productivity growth and competition in spanish manufacturing firms: What has happened in recent years?”
(Desembre 2006)
CREAP2006-10
Andonova, V.; Díaz-Serrano, Luis. (CREB)
"
P
olitical institutions and the development of telecommunications” (Desembre 2006)CREAP2006-11
Raymond, J.L.(GEAP); Roig, J.L.. (GEAP)
"Capital humano: un análisis comparativo Catalunya-España” (Desembre 2006)
CREAP2006-12
Rodríguez, M.(CREB); Stoyanova, A. (CREB)
"Changes in the demand for private medical insurance following a shift in tax incentives” (Desembre 2006)
CREAP2006-13
Royuela, V. (AQR-IREA); Lambiri, D.;Biagi, B.
"Economía urbana y calidad de vida. Una revisión del estado del conocimiento en España” (Desembre 2006)
CREAP2006-14
Camarero, M.; Carrion-i-Silvestre, J.LL. (AQR-IREA).;Tamarit, C.
"New evidence of the real interest rate parity for OECD countries using panel unit root tests with breaks” (Desembre 2006)
CREAP2006-15
Karanassou, M.; Sala, H. (GEAP).;Snower , D. J.
"The macroeconomics of the labor market: Three fundamental views” (Desembre 2006)
2007
XREAP2007-01
Castany, L (AQR-IREA); López-Bazo, E. (AQR-IREA).;Moreno , R. (AQR-IREA) "Decomposing differences in total factor productivity across firm size”
(Març 2007)
XREAP2007-02
Raymond, J. Ll. (GEAP); Roig, J. Ll. (GEAP)
“Una propuesta de evaluación de las externalidades de capital humano en la empresa" (Abril 2007)
XREAP2007-03
Durán, J. M. (IEB); Esteller, A. (IEB)
“An empirical analysis of wealth taxation: Equity vs. Tax compliance” (Juny 2007)
XREAP2007-04
Matas, A. (GEAP); Raymond, J.Ll. (GEAP)
“Cross-section data, disequilibrium situations and estimated coefficients: evidence from car ownership demand”
(Juny 2007)
XREAP2007-05
Jofre-Montseny, J. (IEB); Solé-Ollé, A. (IEB)
“Tax differentials and agglomeration economies in intraregional firm location” (Juny 2007)
XREAP2007-06
Álvarez-Albelo, C. (CREB); Hernández-Martín, R.
“Explaining high economic growth in small tourism countries with a dynamic general equilibrium model” (Juliol 2007)
XREAP2007-07
Duch, N. (IEB); Montolio, D. (IEB); Mediavilla, M.
“Evaluating the impact of public subsidies on a firm’s performance: a quasi-experimental approach” (Juliol 2007)
XREAP2007-08
Segarra-Blasco, A. (GRIT)
“Innovation sources and productivity: a quantile regression analysis” (Octubre 2007)
XREAP2007-09
Albalate, D. (PPRE-IREA)
“Shifting death to their Alternatives: The case of Toll Motorways” (Octubre 2007)


![Figure 1: Kernel Regressions for Accidents involving victims. [k(6), np(100)]](https://thumb-us.123doks.com/thumbv2/123dok_us/82010.2509322/23.1263.108.1112.332.620/figure-kernel-regressions-accidents-involving-victims-k-np.webp)
![Figure 2: Kernel Regressions for Accidents involving victims. [k(6), np(100)]](https://thumb-us.123doks.com/thumbv2/123dok_us/82010.2509322/24.1263.106.1137.323.645/figure-kernel-regressions-accidents-involving-victims-k-np.webp)