Number 197
The cost of production milk
Article 1
July 2017
The cost of production milk
H. B. Munger
Iowa State College
Follow this and additional works at:
http://lib.dr.iastate.edu/bulletin
Part of the
Agricultural Economics Commons
, and the
Dairy Science Commons
This Article is brought to you for free and open access by the Extension and Experiment Station Publications at Iowa State University Digital Repository. It has been accepted for inclusion in Bulletin by an authorized editor of Iowa State University Digital Repository. For more information, please contactdigirep@iastate.edu.
Recommended Citation
Munger, H. B. (2017) "The cost of production milk,"Bulletin: Vol. 16 : No. 197 , Article 1. Available at:http://lib.dr.iastate.edu/bulletin/vol16/iss197/1
January, 1921 Bulletin No. 197
THE COST OF PRODUCING MILK
AGRICULT U RAL E X PE R IM E N T STATION IO W A STATE COLLEGE OF AGRICULTU RE
ANI) TIIE M ECHANIC ARTS
FARM MANAGEMENT SECTION
O FFIC ERS AND STAFF
IOWA AGRICULTURAL EXPERIM ENT STATION Raym ond A. Pearson, M .S.A ., L L .D ., President
C. F. Curtiss, M .S.A ., D.S., Director
W H . Stevenson, A .B ., B .S.A ., Vice-Director A G R IC U L T U R A L E C O N O M IC S
E. G. Nourse, P h.D ., Chief C. W . H am m ans, B.S. (in A .) , Asst. A G R IC U L T U R A L E N G IN E E R IN G
J . B. Davidson, B.S., M .E., A.E., Chief E. V. Collins, B .S. in A .E ., B.S. in W . A. Foster, B.S. in E., B. Arch., Agron., Assistant Chief
Assistant
A G R O N O M Y
W . H . Stevenson, A .B ., B .S.A., Chief P aul Emerson, B .S., M.S., P h.D ., As-H . D. As-Hughes, B.S., M .S.A ., Chief in sistant Chief in Soil Bacteriology
Farm Crops F. S W ilk ins, B.S., M.S., Assistant P. E. Brown, B.S., A.M ., Ph.D ., Chief Chief in Farm Crops
in Soil Chemistry and Bacteriology T. H. Benton, B.S., M .S., Soil Sur-L . C. B urnett, B .S.A ., M .S., Chief in veyor
Cereal Breeding H. J . Harper, B.S., M.S., Field Exper-L. W . Form an, B.S.A., M.S., Chief in iments
Field Experiments D. S. Gray, Soil Surveyor
J . L. Robinson, B .S., M S., Superin- W. G. Baker, B S., Field Experiments tendent of Co-operative Experiments P. E. Nordaker, B.S., Soil Surveyor H . W . Johnson, B.S., M.S., Assistant C. L. Orrben, B.S., Soil Surveyor
Chief in Soil Chemistry
A N IM A L H U S B A N D R Y
H. H. Kildee, B .S.A., M.S., Chief P. S. Shearer, B .S., Chief in A n im al J. M. Evvard, B.S. A., M.S., Chief in Breeding
Swine and Beef Cattle Production M. D. Helser, M.S.. B .S.A., Chief in L. B. Sharp, M.S., Superintendent of Meat Investigation
Experiments in A n im al Husbandry A . C. McCandlish, M.S., Chief in D airy C. C. Culbertson, B.S. in A .H ., As- H u bandry
sistant Chief in A n im a l H usbandry G. E. Weaver, M.S., Assistant Chief in G. V. Glatfelter, M.S., Assistant in Dairy H usbandry
A n im al Husbandry II. A. Bittenben^er, B.S.A., Chief in A. R. Lam b, M .S., Chief in N u tritio n Poultry Husbandry
B A C T E R IO L O G Y
R . E. Buchanan, M. S., Ph. D., C h ie f; Associate in D airy and Soil Bacteriology B O T A N Y A N D P L A N T P A T H O L O G Y
L. H. Pam m el, B .A gr., M.S , P h.D ., J . C. Gi’m an. B.S. M .S , P h.D ., As- Chief sistant Chief in P la n t Pathology Charlotte M. K in g , Assistant Chief R. F. Croford, Assistant in P la n t L . E. Melhus, B.S., P h.D ., Chief in Pathology
P la n t Pathology
C H E M IS T R Y
W . G. Gaessler, B.S., M .S., A c tin g A . R . L am b, B.S., M .S., Assistant
Chief Edith W ilson, Assistant
D A IR Y IN G
M. Mortenson, B .S.A ., Chief W . A. Cordes, B.S., M.S., Assistant in B. W . H am m er, B .S.A., Chief in Dairy D airying
Bacteriology
E N T O M O L O G Y
E. D. Ball, B.S., M.S., Ph.D ., Chief I. L. Ressler, B .A., M.S., Assistant in F. A. Fenton, B.A., M.S., P h.D ., As- Entomology
sociate Chief in Entom ology W allace Park, B .S., M.S., Assistant in A lbert H artzell, B.S., M .A ., Assistant Apiculture
in Entomology
F A R M M A N A G E M E N T H. B. Munger, B.S., Chief
H O R T IC U L T U R E A N D F O R E S T R Y
S. A. Beach, B .S.A., M.S., Chief Rudolph A . R udnick, B.S., Assistant in T. J. Maney, B.S., Chief in Pomology Truck Crops
Harvev L L antz, B.S., Assistant Chief G. B. M acDonald, B.S.F., M .F., Chief
in Pomology in Forestry
H. H. Plagge, Assistant in Pomology Fran k H . Culley, B S.A., M .L .A ., Chief A. T. E rw in, M .S., Chief in Truck in Landscape Architectui’e
Crops
R U R A L S O C IO L O G Y G. H. Von Tungeln, P h.B ., M .A ., Chief
B U L L E T IN SE C T IO N
F. W . Beckman, Ph.B., B ulletin Edi- C lara French Lawrence, Assistant Bul-
tor letin Editor
THE COST OF PRODUCING MILK
By H. B. Munger
A study of milk production costs on 58 farms near Mason City, Cerro Gordo county, Iowa, covering the year November 1, 1916, to November 1, 1917, shows that the net cost of the 4,108,036 pounds of milk produced by the 900 cows on these farms was $3.15 per 100 pounds under the conditions for that year. A ll charges that could properly be made against the milk were included and all credits were also considered.
On some farms the cost of production was less, as low as $1.80 per 100 pounds, and on soaie it was much higher, as high as $5.60 per 100 pounds. Feed and bedding costs, at the prices prevailing in Cerro Gordo county in the period covered, amount ed to $2.15 per 100 pounds of milk, while man and horse labor costs totaled 76 cents per 100 pounds. The cost for equipment, buildings, cows, bull service and other items made a total of 60 cents per 100 pounds. The credit for calves and manure was found to be 36 cents per 100 pounds of milk produced.
This investigation of the cost of producing milk was made in the fall of 1917 for the year which began November 1, 1916, and closed November 1, 1917. All of the 58 farms studied produced whole milk or cream for the Mason City market. They averaged 231 acres in size and maintained an average of 15V? cows per farm. Altho dairying was one of the principal sources of in come on these farms, they were not what are ordinarily called specialized dairy farms. Receipts, other than from dairying, were not secured in this study, but probably a larger source of income than dairying is hogs, while considerable amounts of corn and oats are sold.
METHODS OF W ORK
The survey method was used in this study to determine the cost of milk production. A trained investigator visited each farmer and from a prepared questionnaire secured the various items of cost. The farmers were interested in the s t u d y and
tried to give accurate records. In a few cases they were unable to give satisfactory answers and such records were not used. A number of the farmers were members of a cow-testing associa tion and were therefore in position to give accurate records of feed consumed by the cows, as well as of production of milk.
In calculating the cost of producing milk in this study, the cow was used as the unit. That is, the cost of growing young stock to maintain the dairy herd was eliminated and only the
cost of keeping the cows actually in the milking herd was con sidered. In this study it has been assumed that the growing of young stock and the production of milk are two distinct enter prises. Whenever heifers freshening for the first time entered the milking herd, they were valued at the current market price.
Cows produce three different products of value: milk, calves and manure. The relative values of these products vary with different conditions. In this study milk has been considered the main product, and calves and manure the by-products. Prom the total cost of keeping the cows is subtracted the value of calves and manure, in order to arrive at the net cost of milk.
ITEMS OF COST OF PRODUCING M ILK
The various items of cost in producing milk have been divided in this study as follows: feed, bedding, man labor, horse labor, equipment, buildings, cow cost, bull cost, and miscellaneous.
FEED COST
Feed is the largest item of cost and will be considered under the various heads of grain, hay and other dry roughage, silage and pasture. Table I gives the prices of feeds on which the cost of milk in this study is based. Farm-grown feeds are charged at market price less the cost of hauling to market. Purchased feeds are charged at the price paid and the cost of hauling is included in the labor costs.
Grain. Grain constituted the largest single item of the feed cost, representing about one-third of the total (table I I ) . Corn was two-thirds of the cost of grain, while oats was the other principal feed. Practically all of the corn and oats was grown on the farm where fed. Thirty-nine pounds of grain, costing 67.6 cents, were required in the production of 100 pounds of milk.
Hay and Other Dry Roughage. Hay and other roughage rep resented 26.2 percent of the total feed cost (table I I I ) . Mixed hay, clover hay and timothy hay made up nearly 80 percent of the hay and other dry roughage feed. Xinetv-six pounds of hay and other dry roughage, costing 54.4 cents, were required in the production of 100 pounds of milk. Most of the alfalfa fed. was purchased.
Silage and Other Succulent Feeds. Silage was the principal succulent feed used (table IV ). Ten tons of sugar beet tops and eight tons of green sweet corn stalks were fed. On the average for the farms studied, 117.1 pounds of succulent feeds, costing 43 cents, were used in producing 100 pounds of milk.
T A B LE I — P R IC E S OF P R IN C IP A L F E E D S U SED
Corn, per bushel Oats, per bushel Shorts per to n ..
Price per unit
$ .96
____ .58 Corn silage, per to n ____
Price per u nit _________ 7.35
__ 13.35 38.00
___ 32.92 T im othy hay, per t o n ... _________ 13.37________ 15.74 ___ 38.61 A lfa lfa hay
W ild hay, e Straw , per
_________ 16.80 B ran, per ton .. .
C o tto n seed meal, ___ 41.7732.03 er t o n --- ... ... 4.94--- 10.70
__ 45.36 _________ 5.34
TABLE II—AMOUNT AND VALUE OF GRAIN FED TO PRODUCING 4,108,036 POUNDS OF MILK
900 COWS T otal weight in pounds T otal value A m o unt required per 100 lbs. of m ilk Cost per 100 lbs. m ilk Percent of to ta l value of grain Corn ________ _ 1,088,696 $18,715 26.5 $ .456 67.3 Oats _____________ 291,232 5,288 7.1 .129 19.0
Corn meal ___ 36,OIK) 216 .8 .005 .8
Shorts --- 20,000 380 .5 .009 1.4
A lfa lfa meal --- 13,000 214 .3 .005 .7
Mill feed ________ 800 22 .02 .001 .1
Red dog f l o u r -- 2,000 45 .05 .001 .2 Gluten feed _____ 21,600 417 • o .010 1.5
B ran --- 64,900 1,040 1.6 .025 3.7
C o tton seed meal 40,080 837 1.0 .020 3.0 Linseed oil meal 28,000 635 .7 .015 2.3 ' 1,606,308 $27,809 39.1 $ .670 100.0
TABLE III—AMOUNT AND VALUE OF HAY AND OTHER DRY ROUGHAGE FED TO 900 COWS PRODUCING 4,108,036
POUNDS OF MILK
T o tal A m o u nt | Percent o f i weight Total required i Cost per T otal value of
in value per 100 lbs. 100 lbs. hay and
pounds m ilk m ilk roughage
Mixed hay ____ ___ 1,159,500 $ 7,740 28.2 $ .188 34.6 Clover --- ____ 664,000 5,226 16.2 .127 23.4 T im othy ___ 586,000 3,916 14.3 .095 17.5 A lfalfa ______ ___ 165,000 1,386 4.0 .034 j 6.2 W ild hay ___ ___ 192,000 1,027 4.7 .025 i 4.6 Corn stover ___ ___ • 784,500 : 2,099 19.0 .051 9.4 Straw ___ 393,500 972 9.6 .024 4.3 Total ____ ___ 3,944,500 $22,363 96.0 $ .544 j 100.0
TABLE IV--AMOUNT AND VALUE OF SILAGE AND OTHER SUCCULENT FEEDS FED TO 900 COWS PRODUCING
4,108,036 POUNDS OF MILK T otal i weight in i pounds T otal value A m o u nt 1 required per 100 lbs. of m ilk Cost per 100 lbs. Percent of to ta l value of silage, etc. Silage --- 4,771,500 $17,526 116.2 $ .427 99.4 Beet t o p s --- 20,000 70 . o .002 .4
pounds of m ilk lbs. silage, etc. Sweet corn stalks,
green --- 16,000 40 .4 .001 .2
TABLE V—VALUE OF PASTURE USED BY 900 COWS IN THE PRODUCTION OF 4,108,036 POUNDS OF MILK
Total value Value o f 1695 acres of pasture land, $230,125 1 Interest and taxes—5 ^ percent of $260,125--- --- --- $14,307 Depreciation and repair o f fences --- 1,910 M anuring pasture --- --- , 378 Grass seed _________ ____ _________________________________________________________ l^> Mowing weeds ____________________________________________________________________ 2 Rent o f 32 acres of pasture _____________________________________ ____ __________ 99 ___ T o tal--- --- --- --- --- . $16,715
Pasture. In determining the pasture cost, each farmer was asked the number of acres of pasture used by his herd of milk cows during the season. In case other stock occupied the pasture with the dairy herd the farmer calculated the proper charge that should be made against the cows. On the 58 farms 1,695 acres of land, valued at $260,125, were pastured. The average value of pasture land was $153 per acre. In addition 32 acres were rented. The cost of pasture was determined by charging 5V2
percent on the value of land (5 percent interest, V2 percent taxes) and adding depreciation and repair of fences, manuring pasture, re-seeding, mowing weeds and cash paid out for pasture. A total of 1,727 acres (including 32 acres rented) were pastured, costing $16,715 or $9.68 per acre. The pasture cost per 100 pounds of milk was 40.6 cents. Nearly two acres of pasture were required per cow. It is to be pointed out that in the above esti mate of pasture costs, allowance is made for the manure dropped while on the pasture in the low interest rate or rental charged. The manure item in the following table refers to manure applied from the barns.
Corn Stalks Pastured. Four hundred thirty-three acres of corn stalks were pastured and valued at $414. In case horses were pastured in the same field with cows, allowance was made in figuring the charge for the dairy herd.
TABLE VI— TOTAL AMOUNT AND VALUE OF FEED USED BY 900 COWS PRODUCING 4,108,036 POUNDS OF MILK
A m ount
Grain ________ _____________ 1,606,308 lbs. H a y and other rough ag e.. 3,944,500 lbs. Silage and other succulent
feeds --- 4,807,500 lbs. Pasture --- 1727 acres Corn stalks pastured ---- 433 acrrs S alt _______ _____________ 29,823 lbs. T otal value A m o u nt required per 100 lbs. o f m ilk Value per 100 lbs. m ilk 1 Percent | o f to ta l | value of feed $27,809 39.1 $ .676 32.6 22,330 96.0 .544 26.2 17,633 117.1 .430 20.7 16,715 .403 19.6 414 .0’ 0 .5 304 . i .007 .4 Total. $85.244 $2.073 100.0
Salt. Salt to the amount of 29,823 pounds (152.17 barrels), costing $304, was used during the year by 900 cows.
Summary of Feed Cost. In table V I are summarized the dif ferent kinds of feed used by 900 cows during the year. On the average, 39.1 pounds of grain, 96 pounds of hay and other dry roughage and 117.1 pounds of succulent feeds in addition to pasture were used in the production of 100 pounds of milk. The feed cost per 100 pounds of milk is $2,073. This was more than the price received by farmers for milk at the time the in vestigation was made.
BEDDING
A total of 546 tons of bedding were used by900cows,or a little over one-half ton per cow. The total value of bedding was $2,778, or 1.9 percent of the gross cost of milk production, and 7 cents per 100 pounds of milk. Oat straw was the principal material used for bedding, a small amount of poor quality hay making up the remainder.
MAN LABOR
For convenience in getting the data from farmers, the time required in the production of milk was divided into various operations, such as milking, feeding, care of milk utensils, haul ing feed and bedding, hauling milk and other miscellaneous work (table V II). In all, 147.4 hours of labor were required per cow and 3.228 hours per 100 pounds of milk. The labor cost of 100 pounds of milk was 64.58 cents.
Xo effort was made to determine the labor rates on individual farms. From the results of cost accounts kept on other farms in various parts of the state, a rate of 20 cents per hour was decided upon and is used in all calculations in this study.
TABLE VII— MAN LABOR COST OF PRODUCING 4,108,036 POUNDS OF MILK
T otal hours
o f m an labor T otalvalue H ours per 100 lbs. o f m ilk Value per loo lbs. o f m ilk M ilking _____________________ 54,163 $10,833 1.318 $ .2637 Other daily c h o r e s -- - 40,599 9,320 1.134 .226S H au lin g feed and bedding. 6,040 1,208 .147 .0294 Milk h a u l i n g _______________ 23,569 4,714 .574 .1148 Miscellaneous work _______ 2,275 455 .055 .0111 T otal_________________ 132.649 526,530 3.228 $ .6458
HORSE LABOR
The cost of horse labor was determined in a manner similar to that of man labor (table V I II ) . From the results of cost accounts a rate of 10 cents per horse ho'-r was considered con servative. It required 57.3 hours of horse labor per cow or 1.2 hours per 100 pounds of milk. About two-thirds of the horse labor was used in milk hauling.
TABLE V III—HORSE LABOR COST OF PRODUCING 4,108,036 POUNDS OF MILK
Total hours
horse labor Totalvalue H ours per 100 lbs. o f m ilk Value p^r 100 lbs. o f m ilk M ilk h a u lin g
---H au lin g feed and miscellan 33,481 3348 .8 .OS
eous w o r k --- 17,137 1714 .4 .04
T o tal__________________ 51,618 5062 1.2 .12 EQUIPMENT
Equipment for the dairy enterprise includes milking machine, engine, milk wagons, cans, pails, strainers and other minor equipment. Items of cost are represented by depreciation, re pairs and interest on the average inventory. Depreciation was found by dividing the present value of each piece of equipment by its probable years of usefulness. All estimates were made by the farmers. Seven and a half percent is charged on the average inventory value, 7 percent being for interest and V2 per cent for taxes.
Of the total cost of dairy equipment, $1,971 is accounted for by depreciation. About one-third of the total value of equip ment was found in milking machines, the depreciation on which was considered high by most farmers. The equipment charge is about .2 percent of the gross cost of producing 100 pounds of milk.
TABLE IX— D AIRY EQUIPMENT COST OF PRODUCING 4,108.036 POUNDS OF MILK
Value o f equipment beginning o f year___________________ ______ ______ ' $7,930 New equipment purchased _____________________________________________ 1,513 T otal of beginning inventory and equipment purchased______________ $9,443 Value of equipment close of year_______________________________________ 7,472 Depreciation --- $1,971 Repairs ________ _____ ________________________ ___________________________ 257 Interest on average inventory at 7.5 percent-... ... ... ... 578 T otal cost-_____ ____________________________ ______ _________________ $2,806
BUILDINGS
Building charges against the dairy business are difficult to determine accurately. Depreciation of buildings is a part of the cost and this is influenced by the life of the building. In this study the value of buildings in their present condition was secured and also an estimate of their future years of usefulness. Present value divided by future life is the depreciation.
On many farms horses, and to some extent hogs, were kept in the same barn with the dairy cows. In such cases farmers estimated the proportion of the building used by the cows and these estimates were made the basis of the building charges.
A n average investment of $61,278 was found in buildings, or nearly $70 per cow. The building cost includes depreciation,
TABLE X —BUILDING COST IN PRODUCING 4,108,036 POUNDS OF MILK Value 1st inventory --- --- --- --- --- $327203 Value 2d inventory _______________________________________________________________ 60,254 Depreciation --- 2,029 Insurance __________________________________________________________________________ 259 Repairs --- ---- --- --- --- 2,137 Interest ($61,278 a t 5V2 ) ___________________ ______________________________________ 3,370 ________________ T ota l___________________________________ _________ _________________ $ 7,795
insurance, repairs, interest and taxes. The total building charge is a little over 12 percent of the value of buildings. The aver age depreciation was 3.3 percent, indicating that the buildings occupied by the dairy stock are calculated to last about thirty years. Five percent is charged for interest on buildings and one-half percent for taxes. No attempt was made to secure taxes, but it has been found that these closely approximate .5 percent of the actual valuation. Buildings are no small item in the cost of producing milk. In this study the cost of buildings represents 5.25 percent of the gross cost and 19 cents per 100 pounds of milk.
COW COST
One of the costs of producing milk is the maintenance of the dairy herd. During the year this study was made, 194 cows were sold and 15 cows died. This would indicate that cows are kept in the milking herd on these farms an average of 4V2
years. The depreciation on these cows was $1,159. Interest at 7 percent and taxes V2 percent on the average inventory value of the cows amounted to $1,157.75. The items of depre ciation, interest and taxes total $6,934 and make up what is termed the cow cost. This represents 4.8 percent of the gross cost of producing milk, or 17 cents per 100 pounds of milk.
TABLE X I—COW COST OP PRODUCING 4,108,036 POUNDS OP MILK
Number Averagevalue valu*T otal Cows on farms at beginning o f year________________
Cows purchased ___________________ ________ _________ Heifers freshened entering herd ______________ _____
890 94 134 $85 94 72 $75,254 8,819 10,670 T otal _________________________________________ 1118 $94,743 Cows on farm s at end o f year . . . _______
Cows so'd ______ . . . ______ ___ __ Cows d ie d _________ _____ _________________________ 909 194 15 *87 76 $78,75514,709 129 T otal . . . ___________ _________________________ 1118 $93,534 Depreciation __ _ _ __ _______________ ____ _______
Interest (7 percent) and taxes (% percent) on average inventory value ______________ ________ ___________
1,159 5,775 T otal _________________________________________ $ 6,934
BULL COST
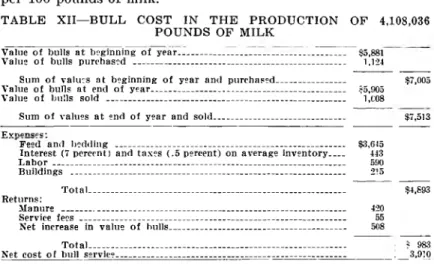
From each farmer keeping a bull was secured a detailed estimate showing the cost of maintenance, including feed, labor, depreciation or appreciation, interest and building charges. The cost of keeping bulls was secured separately from the costs of keeping the cows. Receipts from service fees were deducted from the total cost in order to determine the net cost chargeable to a herd. Forty-seven of the fifty-eight farms maintained bulls all or a part of the year. The total cost for all farms was $3,910, which constituted 2.7 percent of the gross cost, or 10 cents per 100 pounds of milk.
TABLE X II—BULL COST IN THE PRODUCTION OF 4,108,036 POUNDS OP MILK
Value o f bulls a t beginning of year--- --- --- $5,881 Value of bulls purchased _______________________________________________ 1,124
Sum o f values at beginning o f year and purchased_______________ $7,005 Value of bulls at end o f year--- --- --- $5,905 Value of bulls sold __________ ________________________ ______________ _ 1 ,C08
Sum o f values a t end of year and sold_____________________________ $7,513 F Ynpnccc
Feed and bedding ___________________________________ _______________ $3,645 Interest (7 percent) and taxes (.5 percent) on average inventory___ 443 L a b o r --- 590 Buildings --- --- 215 T o tal__________________________________________ _____________ _ $4,893 Returns: Manure --- --- --- ---- ---- 420 Service fe e s ___________________________________________________________ 55 Net increase in value o f bulls--- 508
T o ta l_________________________________________________________ i 983
Net cost of bull service--- --- --- ---)___3,910 MISCELLANEOUS COSTS
Table X I I I shows the miscellaneous items entering into the cost of producing milk. The largest single item was $641 paid out by farmers who hired their milk hauled. A total of $2,967 is classed as miscellaneous and represents 2.1 per cent of the gross cost, or 7 cents per 100 pounds of milk.
TABLE X III— MISCELLANEOUS COSTS IN PRODUCING 4,108,036 POUNDS OF MILK
i T otal value
Milk hauling --- --- $641.00 Feed grinding _________________________________________________________________ 407.30 Veterinary fees --- --- --- 394.50 Cow testing association fees _________________________________ ______ ________ 354.00 Insurance on cows --- 310.10 Breeding fe e s __________________________________________________________________ 202.50 Expense in buying cows --- 176.90 Medicines and disinfectants __________________________________________________ 158.90 Milk testing, acids, etc. ... —--- --- --- 110.00 Registration fees --- --- --- --- 87.00 Advertising ___________________________________________________________________ 75.00 Ice _____________________________________________________________________________ 50.00 T o ta l____________________________ -— --- --- --- $2,967.20
RETURNS OTHER THAN MILK
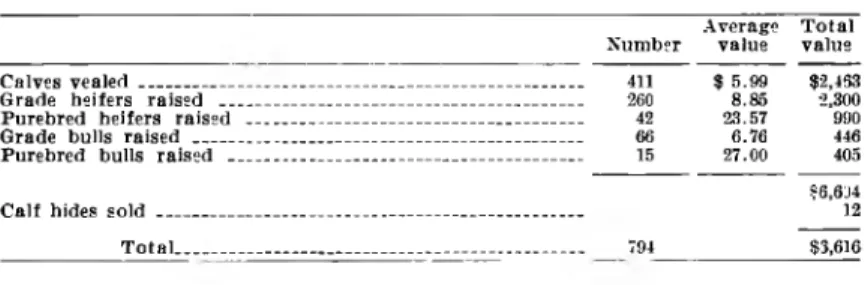
Calves. The 900 cows produced 794 calves, or about 88 for every 100 cows. The remaining cows either did not freshen or lost their calves. Table X IV shows the number vealed and the number of heifers and bulls, loth grades and pure breds, that were raised.
In this study calves were valued at birth and an estimate secured from farmers as to the amount of milk fed to calves. This, together with milk used in the house, was credited to the dairy herd at the same price as milk sold. The value of calves at birth amounted to $6,616 or $7.35 per cow and 16 cents per 100 pounds of milk.
TABLE XIV— CALVES
Number Average value T otal value Calves v e a le d --- --- _____ ___________________ 411 $ 5.99 $2,433 Grade heifers raised ___ _ __________ ___________________ 260 8.85 2,300 Purebred heifers r a is e d --- _ ____________________ 42 23.57 990 Grade bulls raised „ --- _ ___ ___________________ 66 6.76 446 Purebred bulls r a is e d --- ---- ___________________ 15 27.00 405 *6,6'J4
C alf hides sold __ _ . . -
12
T otal--- --- _ ____________________ 794 $3,616
MANURE
Each farmer estimated the number of tons of manure from cows hauled from barn and yards during the year. The total for all farms amounted to 5,400 tons. This was about 6 tons per cow. Manure was valued at $1.50 per ton at the barn, making a manure credit of $9.02 per cow or 20 cents per 100 pounds of milk. Xo account was taken of manure produced on pasture. I f this had been done the manure credit would have been higher and the pasture rate per cow would have been correspondingly higher, but the net result would remain unchanged.
DISPOSAL OF MILK
Table X V shows the disposal of milk. About 88 percent of it was sold, the rest being used in the house and by calves. In calculating the cost of producing milk the total amount was used as the basis.
TABLE XV— DISPOSAL OF MILK
Pounds of m ilk Milk sold — --- --- 3,607,567 Milk used by calves vealed --- 144,839 Milk used by calves raised ____________________________________________________ 203,953 Milk used in house --- 151,677 T otal_________________ ________________ ____________________________ 4,108.036
SUMMARY OF COSTS OF PRODUCING 4,108,036 POUNDS OF M ILK
A summary of the cost of producing milk is given in table X V I. The feed cost per cow was $94.72, or about 60 percent of the gross cost. Labor was the next largest factor of the cost of production, representing 18.4 percent of the gross cost. The total gross cost per cow was $160.03.
TABELE XVI— SUMMARY OF COST OF PRODUCING MILK ] Percent o f Cost per Cost per. 100 Item I T otal cost to ta l cost cow lbs. o f milk Feed _______________ _________ ______ ii»,244 50.2 $94.72 *2.08 B e d d in g _________ ___________________ 2.778 1.9 3.09 .07 M an labo r --- 26,530 18.4 29.48 .64 Horse labor ________________________ 5,002 3.5 5.62 .12 E quipm ent ... ... 2,803 2.0 3.12 .07 Buildings ... 7,795 5.4 8.06 .19 Cow cost ____________________ ______ 6,934 4.8 7.70 .17 B ull cost ... -... -— 3,910 2.7 4.34 .10 M iscellaneous________________________ 2,967 2.1 3.30 .07 T otal c o s t ... ... — £144,026 100.0 $160.03 $3.51 Credits n o t m i l k ________ ___________ C a lv e s ... 6,616 7.35 .16 M a n u r e __________________________ 8,115 9.02 . 20
T o tal cre d its________________ 14,731 16.37 .33 _______ Net c o s t _____________________ SI29,295 $143.63________ $3.15
The value of calves and manure per cow was $16.37, sub tracting which from the gross cost gives $143.66 or the yearly net cost per cow. The average production of milk per cow was 4,565 pounds, costing $3.15 per hundred pounds.
Values of feed, labor and other factors entering into the cost of producing milk are continually changing. The amounts of feed and labor required per 100 pounds of milk remain about the same, regardless of prices. In this area where the average production per cow was 4,565 pounds, the approximate cost of producing 100 pounds of milk can be determined by taking the various amounts of feed and labor and using current values.
W ith the prices prevailing at the time of this study (1916-17), the cost of producing 100 pounds of milk is obtained as shown in the accompanying figures. I t will be noted that only the main items of feed and man and horse labor are worked out in detail. They are readily figured. However, the equipment, building, cow cost, bull cost and other miscellaneous items, as well as the credits not milk, are not so readily figured. For practical purposes, 12 percent of the total cost of feed and labor may be assumed to cover these items. W hen this 12 percent is added to the cost of feed and man and horse labor, it gives the net cost of 100 pounds of milk.
Grain, 39.1 p o u n d s --- $ .670
H ay, 67.3 pounds --- ---- --- --- --- --- .439
Other dry roughage, 28.7 p o u n d s --- --- --- .075
Silage, 117.1 pounds --- .130
Pasture, 3.7 d a y s --- .406
M an labor, 3.23 hours ___________________________________________________________ ______ .646 Horse labor, 1.2 hours --- --- .120
Cost o f feed, m an and horse l a b o r --- $2,822 12 percent o f feed and labor c o s t ---- --- --- .338 Net cost o f 100 pounds o f m ilk —--- --- --- -- ---- --- $3.160
The average number of pasture daj\s per 100 pounds of milk was obtained as follows: The average number of days that cows were on pasture multiplied by the number of cows gives the total days of pasture, dividing which by the total hundred weight of milk produced gives the number of days per 100 pounds.
The prices of feedable crops are influenced in a large measure by the demand for them as feed for hogs, beef cattle, dairy cat tle and other live stock. In this area dairy cattle form a small part of this demand. Unless the price of milk is sufficiently high to pay for the feed and other costs in the production of milk, farmers will turn to the raising of other live stock, or will sell crops. It is important to the consumer that the producer shall receive a price for milk that will bring about an adequate and continuous supply. In the region of this study and in others where similar conditions are found, it is believed that data here in presented will be of help in establishing a fair price for milk.
VARIATION IN COST OF PRODUCING M ILK
While the average cost of producing milk was $3.15 per 100 pounds, there was a wide variation in cost on different farms. Table X V II shows the variation in cost in various herds.
Two farms produced milk for slightly under $1.80 per 100 pounds. On one farm the cost was over $5.60. About 40 per cent of the farms, having 42 percent of the cows, produced 46 percent of the milk for $3.15 or less per 100 pounds. Sixty percent of the farms produced milk at a cost higher than the average. Farmers received approximately $2.00 per hundred for milk during the year of this study. Only 5 out of 58 pro duced milk for $2.00 or less. More than nine-tenths of the farmers received less than market prices for feeds consumed by cows, or less than 20 cents per hour for their labor on the dairy herd, or both.
This was at a time when feel prices had advanced, but prices of milk and other dairy products had not come into adjust ment. Shortly following the conclusion of this study the milk producers’ organization made a contract with the distributors
TABLE XV II—VARIATION IN COST OF PRODUCING 100 POUNDS OF MILK Cost of Producing 100 pounds o f milk Cumula- ; Number tive percent o f o f number farms o f farms Number of cows C u m u la tive percent of number o f cows Pounds o f m ilk produced C u m u la tive percent o f m ilk produced S I.80 end less •> 3.4 22.0 2.4 141,308 3.4
1.81-82.00 3 8.6 61.5 9.3 345,457 11.8 2.01- 2.20 4 15.5 59.0 15.8 336,239 20.0 2.21- 2.40 3 20.7 64.5 23.0 292,942 27.2 2.41- 2.60 3 25.0 50.5 2S.6 229,229 32^7 2.61 ■ 2.80 ___ ___ ___
__
2.81- 3.00 4 32.8 45.0 33.6 217,198 38.0 3.01- 3.20 5 41.4 88.0 43.4 415,917 48.2 3.21 3.40 7 53.4 88.0 53.2 473,682 59.7 3.41-• 3.60 5 62.1 63.0 60.2 287,246 66.7 3.61 ■ 3.80 4 69.0 55.0 63.3 291,889 73.8 3.81-■ 4.00 3 74.1 20.5 68.6 100,523 76.2 4.01-■ 4.20 2 77.6 43.5 73.4 123,910 79.2 4.21 ■ 4.40 5 85.2 72.5 81.5 283,881 86.2 4.41- 4.6J 1 87.9 33.5 85.2 101,940 88.6 4.61 • 4.80 2 91.4 48.0 90.6 202,209 93.6 4.81'■ 5.00 1 93.1 7.0 91.3 32,786 94.4 5.01 ■ 5.20 3 98.3 67.0 98.8 203,258 99.4 5.21 - 5.40__
___ ___ ___ ___ 5.41 - 5.60__
__
___ ___ ___5.61 and over 1 100.0 11.0 1CO.O 25,442 100.0
T otal 58 899.5 4,108,036
whereby they received $3.15 per hundred for milk testing 3.5 percent butterfat, and 5 cents per hundred additional for milk testing 0.1 percent above this standard. The average test for the herds studied was 3.7 percent, making an average price for milk of $3.25 per hundred.
SEASONAL COST OF M ILK PRODUCTION
In this study the year was divided into periods in order to determine the relative costs of producing milk at different sea sons of the year. The usual practice is to turn the cows out about the 10th of May, feeding them nothing but pasture for a period of four to five months. When pasture becomes short, farmers feed some grain and roughage in addition. Thus, in this study the year was divided into three parts: Full pasture season, part pasture season and winter season. Each farmer was asked the date when his cows were turned out to pasture, when extra feed was given in addition to pasture and, finally, when the winter feeding period began. Likewise, feed, bedding and man and horse labor were obtained according to the amounts used during the different seasons. In table X V I I I these are charged in proportion to the amounts actually used in different seasons. The remaining items of cost, i. e., equipment, buildings, cow cost, bull cost and miscellaneous, are yearly costs, not vary ing with the seasons as feed and labor. These costs are, there fore, apportioned according to the length of the different seasons.
Value of calves is credited according to the length of the various seasons. No manure is credited to the full pasture season. The manure credit is divided between the part pasture and winter seasons on the basis of the amounts of feeds con sumed during those seasons.
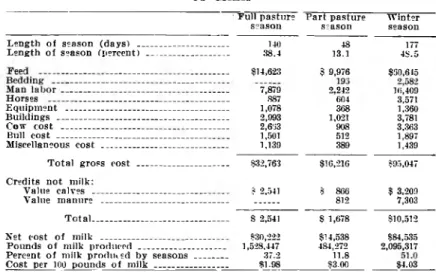
TABLE X V III— SEASONAL COST OF PRODUCING 4,108,036 POUNDS OF MILK
Full pasture
season P a rt pasture ssason W interseason Length of season (days) ____________
Length of season (percent) --- -________ --- 38.4140 13.148 4S.5177 _______ $14,623 $ 9,976 $30,615 _______ 7,879 2,242 604 10,4093,571 Horses _____________________ _______ 887 E quipm ent ... ... 1,078 368 1,360 Buildings --- --- --- 2,993 1,021 3,781 Cow cost _______________
__
______
2,633 908 3,363 Bull cost _____________ 1,501 512 1,897 Miscellaneous c o s t ______... ...---
1,139 389 1,439 T otal gross cost --- $32,763 $16,216 $95,047 Credits n o t milk:Value calves . . ___ ? 2,541 $ 866 $ 3,209 Value manure --- --- --- ---- 812 7,303 T o tal_____ _____ ________ _____ — - $ 2,541 $ 1,678 $10,512 Net cost o f m ilk ___________ __ ______ __ $30,222 $14,538 $84,535 Pounds of m ilk produced ... ... 1,528,447 484,272 2,095,317 Percent of m ilk prodiked by se a so n s _______
Cost per 100 pounds of m ilk ... $1.9837.2 $3.0011.8 $4.03
The cost per 100 pounds of milk was $1.98 while cows were on full pasture, $3.00 while on part pasture and part other feed, and $4.03 during the winter season. On these farms and with feed prices prevailing at the time, the cost of producing milk was twice as much in winter as in summer. This cannot be at tributed to a lack of winter production. The winter season was 48.5 percent of the year, during which time 51 percent of the milk was produced. The results indicate that pasture was a relatively cheap feed.
The price received by farmers for milk should bear a close relationship to the cost of production at different seasons in order to insure a year-round supply. Otherwise, farmers will so adjust production that the bulk of the milk will be produced at the time of year when costs are lowest.
The year is the production cycle of a cow. Even tho milk is produced at a lower cost in summer, yet a cow must be maintained in winter in order to have her for summer pro duction. The farmer’s problem in this connection is to deter mine whether the largest year’s profit from the dairy enterprise will be secured by producing most of his milk in summer or in
winter. Table X IX shows the relation of time of freshening to costs, production and profits.
TABLE X IX — RELATION OF FALL AND SPRING FRESHENING TO COSTS, PRODUCTION AND PROFITS
Tim? of~fr?sh?ning Sept. 1-Jan. 1 J a n . 1-July 1 Number o f farms --- --- --- 24 13 Number o f cows --- 345 150 Pounds o f m ilk per c o w _______________________________ 4903 3579 Value o f m ilk per cow _______________________________ £97.00 *70.00 Returns except milk per cow ________________________ 13.00 15.00 Feed cost per cow ____________________________________ 94.00 77.00 Other costs per cow --- 74.00 03.09 Net cost of m ilk per cow _____________________________ 152.00 125.00 Loss per cow _________________________________________ 55.00 55.00 Feed cost per 100 pounds o f m i l k --- --- 1.92 1.96 T o tal net cost per 100 pounds of m ilk_______________ 3.10 3.49 Value per 100 pounds o f m i l k --- 1.98 1.93 Loss per 100 pounds o f m i l k --- --- $1.12__ _____ $1.53
All of the cows on 24 farms freshened between September 1 and January 1. All of the cows on 13 farms freshened be tween January 1 and Ju ly 1. Roughly, this classification divides the farms into fall and spring freshening groups. On the re maining 21 farms the cows freshened tliruout the year and for tliis reason are not included in the above table.
Cows on farms practicing winter dairying produced, on an average, 37 percent more milk than those on farms where most of the milk was produced in summer. Probably these cows were naturally better producers. Usually 10 to 15 percent greater production can be expected by having cows freshen in the fall rather than spring. A higher net cost per cow was found on farms where the cows fall-freshened, but due to higher pro duction the average yearly cost per 100 pounds of milk was 39 cents less than on those farms where cows freshened in the spring. The loss per 100 pounds of milk was greater on the latter group of farms, but with smaller production, their loss per cow was no greater than on farms where cows fall-freshened. I f the price of milk had been lower, summer production would have had the advantage. If the price had been higher, farms producing winter milk would have fared better than the sum mer producers. The best time of year to have cows freshen de pends on the average yearly price received for milk and the cost of producing it, In this study cows freshening in the fall produced milk more economically and in normal times with a fair price for milk, would have made greater profit than cows freshening in the spring.