DigitalCommons@University of Nebraska - Lincoln
DigitalCommons@University of Nebraska - Lincoln
Faculty Publications: Agricultural Economics
Agricultural Economics Department
2001
Separating the Impacts of Crop Diversification and Rotations on
Separating the Impacts of Crop Diversification and Rotations on
Risk
Risk
Glenn A. Helmers
University of Nebraska-Lincoln, [email protected]
Charles F. Yamoah
Soil Res. Inst., Kumasi, Ghana
Gary E. Varvel
University of Nebraska-Lincoln, [email protected]
Follow this and additional works at: https://digitalcommons.unl.edu/ageconfacpub
Part of the Agricultural and Resource Economics Commons
Helmers, Glenn A.; Yamoah, Charles F.; and Varvel, Gary E., "Separating the Impacts of Crop Diversification and Rotations on Risk" (2001). Faculty Publications: Agricultural Economics. 88.
https://digitalcommons.unl.edu/ageconfacpub/88
This Article is brought to you for free and open access by the Agricultural Economics Department at
DigitalCommons@University of Nebraska - Lincoln. It has been accepted for inclusion in Faculty Publications: Agricultural Economics by an authorized administrator of DigitalCommons@University of Nebraska - Lincoln.
Plant, R.E., D.S. Munk, B.R. Roberts, R.L. Vargas, D.W. Rains, R.L. fertilizer nitrogen deficiencies in winter wheat. Trans. ASAE 39: 1623–1631.
Travis, and R.B. Hutmacher. 2000. Relationships between remotely
sensed reflectance data and cotton growth and yield. Trans. ASAE Technicon Industrial Systems. 1986. Nitrate-nitrite in soil extracts. In-dustrial method no. 794-86T. Technicon Ind. Syst., Tarrytown, NY. 43:535–546.
Richardson, A.J., C.L. Wiegand, D.F. Wanjura, D.F. Dusek, and J.L. van Es, H.M., and C.L. van Es. 1993. Spatial nature of randomization and its effects on the outcome of field experiments. Agron. J. 85: Steiner. 1992. Multisite analyses of spectral-biophysical data for
sorghum. Remote Sens. Environ. 41:71–82. 420–428.
van Es, H.M., C.L. van Es, and D.K. Cassel. 1989. Application of SAS Institute. 1990. SAS/STAT user’s guide. Vol. 2. GLM-VARCOMP.
Version 6. 4th ed. SAS Inst., Cary, NC. regionalized variable theory to large-plot field experiments. Soil Sci. Soc. Am. J. 53:1178–1183.
SAS Institute. 1993. SAS/ETS user’s guide. Version 6. 2nd ed. SAS
Inst., Cary, NC. Walburg, G., M.E. Bauer, C.S.T. Daughtry, and T.L. Housley. 1982. Effects of nitrogen nutrition on the growth, yield, and reflectance Sembiring, H., W.R. Raun, G.V. Johnson, M.L. Stone, J.B. Solie, and
S.B. Phillips. 1998. Detection of nitrogen and phosphorus nutrient characteristics of corn canopies. Agron. J. 74:677–683.
Wiegand, C.L., J.D. Rhoades, D.E. Escobar, and J.H. Everitt. 1994. status in winter wheat using spectral radiance. J. Plant Nutr. 21:
1207–1233. Photographic and videographic observations for determining and mapping the response of cotton to soil salinity. Remote Sens. Envi-Stone, M.L., J.B. Solie, W.R. Raun, R.W. Whitney, S.L. Taylor, and
J.D. Ringer. 1996. Use of spectral radiance for correcting in-season ron. 49:212–223.
NOTES AND UNIQUE PHENOMENA
Separating the Impacts of Crop Diversification and Rotations on Risk
Glenn A. Helmers, Charles F. Yamoah, and Gary E. Varvel
ABSTRACT (Helmers et al., 1986). The benefit of crop rotations in reducing risk involves three distinct influences. First,
It has been commonly accepted that crop rotations reduce risk
conventionally practiced rotations involve
diversifica-compared with monoculture systems. Quantifying this phenomenon
requires that effects of yield stability on risk (positive or negative) tion, an offsetting phenomenon where low returns in arising from rotating crops be separated from other risk elements. one year for one crop are combined with relatively high
Using an ARS–University of Nebraska series of yields for corn (Zea returns from a different crop. Second, rotation cropping maysL.) and soybean [Glycine max(L.) Merr.] grown over a 14-yr is generally thought to reduce yield variability compared period, both in rotation and in monoculture, the impact of crop rota- with monoculture practices. Last, rotations, as opposed tion on risk was isolated and estimated. Risk was defined as the failure
to monoculture cropping, may result in overall higher
to meet an annual per-hectare net return target. A corn–soybean
crop yields as well as reduced production costs. Where
rotation had significantly less risk than monoculture practices.
Diversi-risk is defined as the failure to reach a target return,
fication was found to contribute to part of this reduction while higher
these influences may reduce risk by reducing the
sever-yields and reduced cost contributed to the remainder. This reduction
ity of the return failures.
in risk occurred even though the corn–soybean rotation had a higher yield variance.
Cropping System Risk
E
xperimental yield data on crops grown under Risk is generally considered a strong behavioral force monoculture conditions as well as when sequenced affecting decision making. At the farm level, higher risk are commonly available from cropping system research may or may not accompany higher profit alternatives. studies. Where the experiment is of sufficient duration, If higher profit alternatives involve less or no greater the risk consequences of alternative cropping systems risk than lower profit alternatives, the higher profit al-can be estimated using yield data along with price and ternative is the obvious choice. When higher profit alter-cost data. Further, in doing so, it is often possible to natives involve greater risk, a choice must be made separate the risk effects of crop rotation and crop diver- between the two objectives.sification. The risk benefits of crop diversification are Cropping system risk results from variability in re-generally well understood, but the additional effect of turns across time and arises from year-to-year changes rotational cropping on risk is less understood. Further, in yields, crop prices, and input costs. A number of it is important to understand the underlying causes when risk concepts and their analytic implementations exist rotations reduce risk. (Anderson et al., 1977; Harwood et al., 1999). Often The use of crop rotations have generally been thought variability or a second-moment concept is used in ana-to reduce risk compared with monoculture cropping lyzing risk of individual activities or a portfolio of activi-ties (Anderson et al., 1977; Freund, 1956). The portfolio analysis approach based on the foundation of utility G.A. Helmers, Dep. of Agric. Econ., P.O. Box 830922, Univ. of
Ne-braska, Lincoln, NE 68583-0922; C.F. Yamoah, Soil Res. Inst., Kumasi, maximization has also been linearized (Hazell, 1971). Ghana; and G.E. Varvel, USDA-ARS, P.O. Box 830934, Univ. of Another perspective of risk is how far and/or often Nebraska, Lincoln, NE 68583-0934. Journal Ser. no. 13371, Agric. returns fail to reach a below-mean target return level Res. Division, Univ. of Nebraska.
(Held et al., unpublished, 1982; available from the corre-sponding author) (Tauer, 1983; Watts et al., 1984). In Published in Agron. J. 93:1337–1340 (2001).
standard second-moment analysis, the mean is used as experiment is presented in Varvel (2000), and annual a target; however, a disadvantage of this approach is yields are available from Varvel (unpublished data, 2000). that the mean is different for each cropping system. A Using a different time period and different cropping below-mean target that is fixed across all systems does systems from this experiment, optimum crop–fertili-not have that disadvantage. zation system proportions were developed based on re-Another risk analysis approach is stochastic domi- turn variability, target variability, and safety first (Helm-nance (Quirk and Saposnic, 1962). First-degree stochas- ers et al., 1998). In that analysis, no attempt was made tic dominance rests on the axiomatic foundation that to quantify rotation risk vs. diversification risk. more is preferred to less and is implemented by compar- In developing net returns for each system, each year’s ing cumulative distribution function curves of alterna- harvest price for corn and soybean was used (Wellman, tives. Analysis of second- and third-degree stochastic 1999). For operating input costs, a 1998 cost was used dominance rests, however, on other behavioral assump- (Selley et al., 1999) for each system and deflated for
tions. prior years. For monoculture corn, monoculture
soy-Still another approach is when the risk focus is placed bean, corn following soybean, and soybean following on minimizing the probability of falling below adisaster corn, these costs (1998 basis) were $317.22, $292.70, target level (Moscardi and de Janvry, 1977; Atwood et $280.49, and $238.70 ha⫺1, respectively. Hence, net
re-al., 1988) (Watts et re-al., unpublished, 1989; available from turns (returns to land, labor, machine ownership, over-the corresponding author). This approach to risk, ter- head, and management) varied between years because medsafety first, has a strong intuitive appeal and empiri- of both yield and product price variability. The esti-cal support. From a survey of 149 producers in 12 states, mated net returns for four cropping sequences over the Patrick et al. (1985) reported that many producers, “in- 14-yr period are presented in Table 1. These cropping dicated what could be interpreted as substantial ‘safety- sequences are monoculture corn (CC), monoculture soy-first’ considerations in their decision making” (p. 237– bean (SBSB), corn following soybean (C/SB), and soy-238). In this paper, we used this approach and measured bean following corn (SB/C). For corn following soybean, risk as the cumulative sum of the shortfalls when annual corn was grown each year but on alternating plots with net returns fell below a specified net return target for soybean. This is similarly the case for soybean following the 14-yr analysis period. corn. The two monoculture sequences are also consid-ered systems. The other two systems developed here
Procedure
(CC-SBSB and C-SB) make use of the two monocultureseries as well as the two rotation sequence series, respec-To isolate the risk contribution to income stability
tively. from rotations as opposed to diversification alone, an
The series of annual net returns for a diversified sys-analysis was done using experimental dryland yield data
tem, constructed by averaging annual monoculture corn from eastern Nebraska for the 1985–1998 time period.
and monoculture soybean returns, is presented in Table This involved two crops (corn and soybean fertilized
1. It is termed diversified because no rotation is in-at 90 and 0 kg N ha⫺1, respectively) grown both in
volved, yet both crops are grown. This system could be monoculture and in rotation with the other crop. The
termed 50% monoculture corn and 50% monoculture entire experiment also involved other crops and other
soybean. In addition, the net-return series for a rotation-fertilization levels, but for simplicity, only two crop–
diversified system is also presented in Table 1. This is fertilization choices are used here (Peterson and Varvel,
1989a, 1989b). Also, the grain yield analysis of this found by averaging the annual entries for corn following
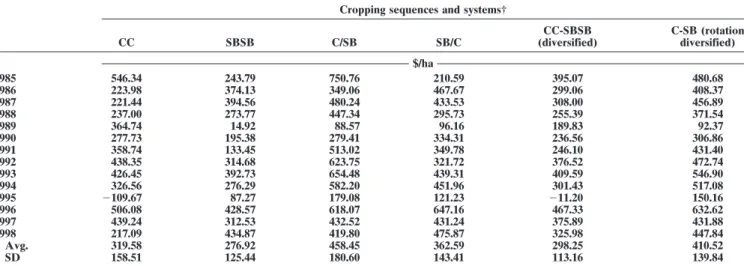
Table 1. Estimated net returns (1985–1998) for four cropping sequences and the diversified and rotation-diversified systems.
Cropping sequences and systems†
CC-SBSB C-SB (rotation CC SBSB C/SB SB/C (diversified) diversified) $/ha 1985 546.34 243.79 750.76 210.59 395.07 480.68 1986 223.98 374.13 349.06 467.67 299.06 408.37 1987 221.44 394.56 480.24 433.53 308.00 456.89 1988 237.00 273.77 447.34 295.73 255.39 371.54 1989 364.74 14.92 88.57 96.16 189.83 92.37 1990 277.73 195.38 279.41 334.31 236.56 306.86 1991 358.74 133.45 513.02 349.78 246.10 431.40 1992 438.35 314.68 623.75 321.72 376.52 472.74 1993 426.45 392.73 654.48 439.31 409.59 546.90 1994 326.56 276.29 582.20 451.96 301.43 517.08 1995 ⫺109.67 87.27 179.08 121.23 ⫺11.20 150.16 1996 506.08 428.57 618.07 647.16 467.33 632.62 1997 439.24 312.53 432.52 431.24 375.89 431.88 1998 217.09 434.87 419.80 475.87 325.98 447.84 Avg. 319.58 276.92 458.45 362.59 298.25 410.52 SD 158.51 125.44 180.60 143.41 113.16 139.84
† CC, monoculture corn; SBSB, monoculture soybean; C/SB, corn following soybean; SB/C, soybean following corn; CC-SBSB, corn and soybean grown each year but not in rotation; C-SB, corn and soybean grown each year and in rotation.
soybean and soybean following corn. This alternative is examined for each cropping system because the choice of a target is arbitrary. Deficits are obviously lower using termed rotation diversified because in addition to
hav-ing corn and soybean grown each year, each crop is a lower disaster target. For most cropping systems, net returns were noticeably low in 1989 and 1995. These grown in rotation.
The diversified system is rarely practiced and can be were caused by low yields resulting from abnormally low precipitation (Varvel, 2000).
considered artificial. Yet its construction is useful for analysis. Comparing its risk with the rotation-diversified system allows the identification of risk benefits of
rota-RESULTS
tions. The rotation-diversified system involves risk
ben-efits from both diversification and rotation while only Comparison of net-return variability (standard devia-risk benefits of diversification are observed for the di- tion of net returns) in Table 1 for monoculture corn, versification system. Diversification may reduce risk be- monoculture soybean, diversified, and rotation-diversi-cause a year of low returns for one crop may be offset fied systems allows a determination of the yield stability by high returns from another crop. The risk advantage phenomenon. In this case, diversification significantly of diversification relative to a single crop cannot be reduces net-return variability ($113.16) compared with evaluated using annual physical output from each sys- the average ($141.98) of monoculture corn ($158.51) tem. This is because (i) corn and soybean differ in their and monoculture soybean ($125.44). This is due to the relative value and (ii) the prices of corn and soybean offsetting phenomenon where when returns of one crop do not move uniformly through time. Hence, net returns are low, returns of the other crop tend not to be low. of each system are presented in Table 1. However, net-return variability is greater for the rota-Rotation risk involves two additional aspects. The tion-diversified system ($139.84) than for the diversified first is the phenomenon that by growing one crop after system. This is due almost exclusively to yield variability another, yield variability may be affected. The yield differences between the systems. Thus, rotation crop-variability component of rotation can be stabilizing (risk ping is seen here to be destabilizing with respect to reducing) or destabilizing (risk increasing). yields. Another perspective of this can be seen in the The second risk component derived from rotations comparisons of net-return variability of corn grown centers on the net-return benefits of rotations resulting under monoculture ($158.51) vs. following soybean from higher yields and reduced growing costs. Risk ben- ($180.60). It is also similarly seen when comparing the efits of rotations arising from these two aspects can be standard deviation of monoculture soybean ($125.44) observed by comparing risk for all systems where risk vs. rotation soybean ($143.41).
is defined as accumulated returns below a target level. An exact measure of the yield stability effect of rota-Risk defined as a deficit return is impacted by yield tions is the standard-deviation comparison of diversified variability because low yields lead to low returns. In vs. rotation-diversified systems using constant product addition, however, risk is impacted by influences that prices and input costs. This measure is expected to be lead one system to have persistently higher net returns close to the 81% proportional comparison ($139.84 vs. than another. $113.16) using the process for product prices and inputs The four cropping systems of Table 1 (monoculture previously described. This was, in fact, the case here corn, monoculture soybean, diversified, and rotation di- where when using constant product prices and input versified) were evaluated for average net returns and costs, the estimate was 74%.
risk, with their estimates placed in Table 2. Risk is calcu- Comparing the risk results for both monoculture sys-lated by totaling the dollar deficits for all years where tems with the diversification system (Table 2) again dem-returns fall below $250 ha⫺1. For example, for monocul- onstrates the benefits of diversification on risk.
Com-ture corn, this occurs in years 1986, 1987, 1988, 1995, pared with monoculture corn, diversification reduces and 1998. The deficits for these years total $460.16. In risk from $460.16 to $338.71 using $250 ha⫺1as the risk
target. Using monoculture soybean as the comparison, addition, net-return deficits under $100 ha⫺1were also
the benefits of diversification are even greater ($575.19 vs. $338.71). If the average risk of monoculture corn and
Table 2. Average net returns and risk of four systems involving
monoculture and rotational cropping. monoculture soybean ($517.68) is used as a comparison point, diversification reduces risk by 34.6%. Comparing
Risk-accumulated returns
the diversified and the rotation-diversified system
indi-Avg. net return Below $250 Below $100
cates that risk is further decreased with the
rotation-$/ha diversified system an additional 15.1%, from $338.71 to Monoculture cropping $257.47, due to enhanced yields and reduced costs. The
a) CC† 319.58 460.16 290.67
overall risk from rotational cropping is 49.7% of the
b) SBSB‡ 276.92 575.19 97.80
average of monoculture corn and monoculture soybean.
Diversified cropping
CC-SBSB§ 298.25 338.71 111.20 This overall reduction occurs in the face of what pre-Rotation diversified cropping viously was shown to be an increased yield variability
C-SB¶ 410.52 257.47 7.63
phenomenon arising from rotation cropping.
† CC, monoculture corn. When $100 ha⫺1 is used as the risk target, a more
‡ SBSB, monoculture soybean.
dramatic reduction in risk is observed from the rotation.
§ CC-SBSB, corn and soybean grown each year but not in rotation.
monoculture soybean are $209.67 and $97.80, respec- culture systems and rotation systems using yield trials, product prices, and input costs allows risk and yield tively, or an average of $153.74. Diversification results
in a 27.7% reduction (to $111.20 ha⫺1), but the rotation- stability comparisons to be made. The relative impacts
of rotations on risk and yield stability are expected to diversified system leads to a further 67.3% risk
reduc-tion (to $7.63 ha⫺1). differ significantly for different crops and locations.
It should be noted that when risk is defined only by
REFERENCES variability, the rotation-diversified system has a greater
standard deviation than the diversified system. How- Anderson, J.R., J.L. Dillon, and J.B. Hardaker. 1977. Agricultural decision analysis. Iowa State Univ., Ames.
ever, using the safety-first risk criterion of Table 2, the
Atwood, J.A., M.J. Watts, G.A. Helmers, and L.J. Held. 1988. Incorpo-opposite is true. This demonstrated that the diversified
rating safety-first constraints in linear programming production system has less upside potential than the rotation-diver- models. West. J. Agric. Econ. 13:29–36.
sified system even though the variability of the diversi- Freund, R.J. 1956. The introduction of risk into a programming model. Econometrica 24:253–263.
fied system is relatively low.
Harwood, J.L., R. Heifner, K. Coble, J. Perry, and A. Somwaru. 1999. The yield stability factor for the rotation is negative
Managing risk in farming: Concepts, research, and analysis. Agric. here (reduced stability); however, this should not be Econ. Rep. 774. Econ. Res. Serv., USDA, Washington, DC. assumed to always hold. Were risk defined only as vari- Hazell, P.B.R. 1971. A linear alternative to quadratic and semivariance
programming for farm planning under uncertainty. Am. J. Agric. ability in net returns, the rotation analyzed here
in-Econ. 53:53–62. creases risk because of increased yield instability.
How-Helmers, G.A., W. Dias, M.R. Langemeier, and J.A. Atwood. 1998. ever, the risk benefits resulting from increased yields Risk analysis of cropping systems using experimental cropping and lower costs from rotational cropping strongly over- system–fertilizer data. Am. Agric. Econ. Assoc., Salt Lake City, UT. ride the yield instability factor. Helmers, G.A., M.R. Langemeier, and J. Atwood. 1986. An economic analysis of alternative cropping systems for east-central Nebraska. Am. J. Altern. Agric. 1:153–158.
Moscardi, E., and A. de Janvry. 1977. Attitudes toward risk among
SUMMARY AND CONCLUSIONS
peasants: An econometric approach. Am. J. Agric. Econ. 59:710– 716.
Rotation cropping of corn and soybean was found
Patrick, G.R., P.N. Wilson, P.J. Barry, W.G. Boggess, and D.L. Young. to have a significant risk advantage over monoculture
1985. Risk perceptions and management responses: Producer-gen-production. Part of the reduced risk resulted from di- erated hypothesis for risk modeling. South. J. Agric. Econ. 17(2): versification inherent in a rotation. However, another 231–238.
Peterson, T.A., and G.E. Varvel. 1989a. Crop yield as affected by major influence was the positive yield interaction and
rotation and nitrogen rate: I. Soybean. Agron. J. 81:727–731. reduced production-cost aspect of the corn–soybean
ro-Peterson, T.A., and G.E. Varvel. 1989b. Crop yield as affected by tation. Risk was defined as the cumulative net-return rotation and N rate: III. Corn. Agron. J. 81:735–738.
deficits relative to a target net return for a 14-yr period. Quirk, J.P., and R. Saposnic. 1962. Admissibility and measurable utility functions. Rev. Econ. Stud. 29(2):140–146.
Statistical variability analysis was used to examine
Selley, R.A., P.K. Cox, R.T. Clark, T. Holman, and R.N. Klein. 1999. whether a corn–soybean rotation reduced yield
variabil-Nebraska crop budgets. EC99-872-S. Univ. of variabil-Nebraska Coop. ity compared with a system of 50% monoculture corn Ext., Lincoln.
and 50% monoculture soybean. It was found that the Tauer, L.W. 1983. Target MOTAD. Am. J. Agric. Econ. 65:606–610. Varvel, G.E. 2000. Crop rotation and nitrogen effects on normalized rotation led to increased yield instability. Thus, the corn–
grain yields in a long-term study. Agron. J. 92:938–941. soybean rotation had significant risk advantages over
Watts, M.J., L.J. Held, and G.A. Helmers. 1984. A comparison of monoculture production but not because of enhanced target MOTAD to MOTAD. Can. J. Agric. Econ. 32:175–186. yield stability. Wellman, A.C. 1999. Crop and livestock prices for Nebraska
produc-ers. EC99-883-C. Univ. of Nebraska Coop. Ext., Lincoln. The process of analyzing net-return series for