2019
Evaluating the effects of rumen-protected glucose
(RPG) on production, metabolism, and
inflammation in transitioning dairy cows
Carrie Suzanne McCarthy
Iowa State University
Follow this and additional works at:https://lib.dr.iastate.edu/etd
Part of theAgriculture Commons, and theAnimal Sciences Commons
This Thesis is brought to you for free and open access by the Iowa State University Capstones, Theses and Dissertations at Iowa State University Digital Repository. It has been accepted for inclusion in Graduate Theses and Dissertations by an authorized administrator of Iowa State University Digital Repository. For more information, please [email protected].
Recommended Citation
McCarthy, Carrie Suzanne, "Evaluating the effects of rumen-protected glucose (RPG) on production, metabolism, and inflammation in transitioning dairy cows" (2019).Graduate Theses and Dissertations. 17054.
by
Carrie Suzanne McCarthy
A thesis submitted to the graduate faculty
in partial fulfillment of the requirements for the degree of MASTER OF SCIENCE
Major: Animal Science
Program of Study Committee:
Hugo A. Ramirez-Ramirez, Co-major Professor Lance H. Baumgard, Co-major Professor (Jayasooriya-Arachchige) Ranga Appuhamy
Jason Ross
The student author, whose presentation of the scholarship herein was approved by the program of study committee, is solely responsible for the content of this thesis. The Graduate
College will ensure this thesis is globally accessible and will not permit alterations after a degree is conferred.
Iowa State University Ames, Iowa
2019
DEDICATION
This thesis is written in dedication to my grandparents, Larry and Suzanne Rhinesmith and Sharon Shouse. Thank you all for your support throughout my college career. I am so thankful to have you here to keep pushing me. I love you!
TABLE OF CONTENTS
LIST OF FIGURES ... v
LIST OF TABLES ... vi
ACKNOWLEDGMENTS ... vii
ABSTRACT ... ix
CHAPTER 1: LITERATURE REVIEW ... 1
The Transition Period ... 1
Nutrient Partitioning During the Transition Period ... 1
Role of Hormones in the Transition Period ... 6
Energy Balance ... 9
Metabolic Disorders ... 10
Inflammation in the Transition Period ... 10
Rumen Acidosis ... 11
Fatty Liver ... 14
Ketogenesis and Ketosis ... 15
Endotoxemia ... 16
Nutritional and Management Strategies to Mitigate Effects of NEBAL ... 17
Propylene Glycol ... 17
Ionophores ... 18
Fat Supplementation ... 19
Protein Supplementation... 20
Carbohydrate Supplementation ... 21
The Small Intestine’s Ability to Absorb Glucose ... 24
References ... 27
CHAPTER 2: EFFECTS OF FEEDING RUMEN-PROTECTED GLUCOSE ON LACTATION PERFORMANCE, ENERGETIC METABOLISM AND INFLAMMATION IN TRANSITIONING DAIRY COWS ... 45
Abstract ... 45
Introduction ... 46
Materials and Methods ... 48
Animals, Diets, and Experimental Design ... 48
Sampling and Data Collection ... 49
Results ... 52
Dry Matter Intake, Fecal pH, and BW... 52
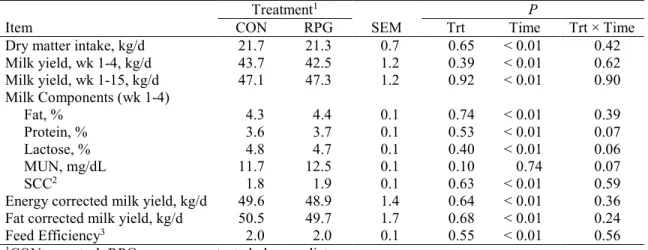
Milk Yield and Composition ... 52
Blood Metabolites, Hormones, and Acute Phase Proteins ... 53
Discussion ... 54
Conclusion ... 58
References ... 64
CHAPTER 3: SUMMARY AND IMPLICATIONS ... 67
References ... 69
APPENDIX: EVALUATION OF THE METHOD OF SAMPLE PREPARATION FOR THE DETERMINATION OF FECAL PH IN DAIRY COWS ... 70
LIST OF FIGURES
Page
Figure 1. Fates of mobilized fat from adipose tissue in the lactating dairy cow.
Adapted from Drackley (1999) ... 5
Figure 2. Effects of rumen-protected glucose on (A) DMI and (B) fecal pH. T
reatments: CON = control diet and RPG = rumen-protected glucose diet. ... 60
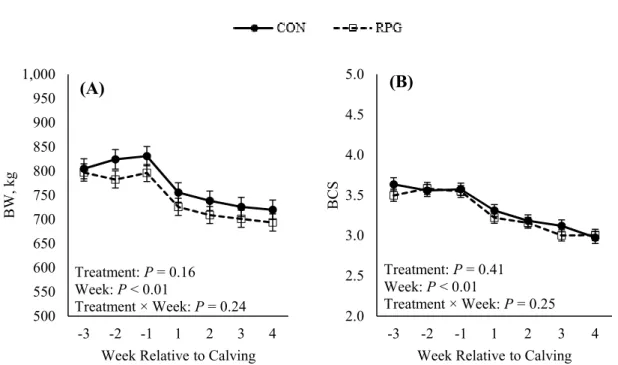
Figure 3. Effects of rumen-protected glucose on (A) BW and (B) BCS. Treatments: CON = control diet and RPG = rumen-protected glucose diet... 61
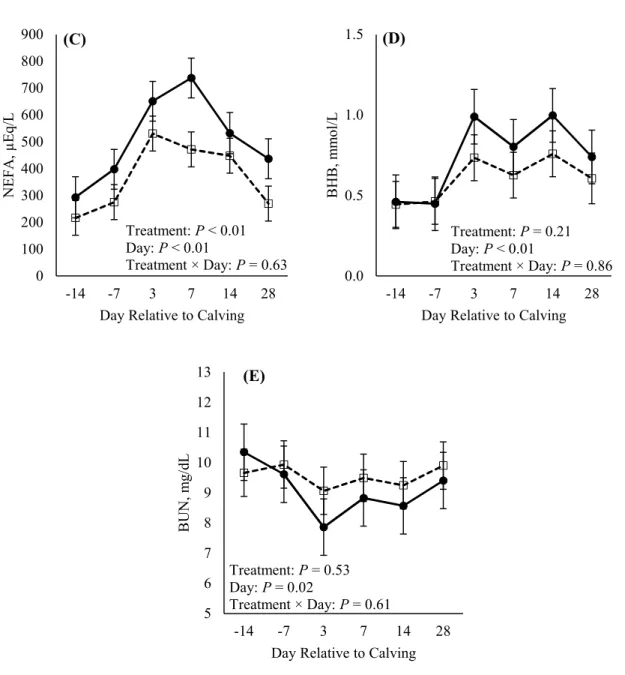
Figure 4. Effects of rumen-protected glucose on circulating (A) glucose, (B) insulin, (C) NEFA, (D) BHB, and (E) BUN. Treatments: CON = control diet and RPG = rumen-protected glucose diet. ... 62
Figure 5. Effects of rumen-protected glucose on circulating (A) LBP and (B) Hp.
Treatments: CON = control diet and RPG = rumen-protected glucose diet. ... 63
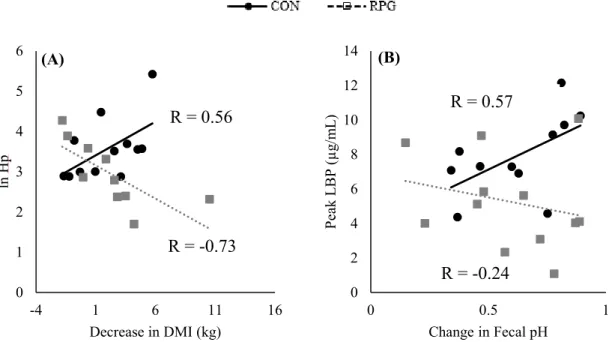
Figure 6. Correlations of the (A) decrease in DMI and Hp concentrations and (B)
LIST OF TABLES
Page
Table 1. A partial list of metabolic changes associated with the transition period in ruminants ... 5
Table 2. A partial list of alterations in the response to homeostatic responses that occur in different tissues and processes during lactogenesis and early lactation in
ruminants... 8
Table 3. Milk yield responses to glucose infusion ... 26
Table 4. Dry matter intake responses to glucose infusion ... 26
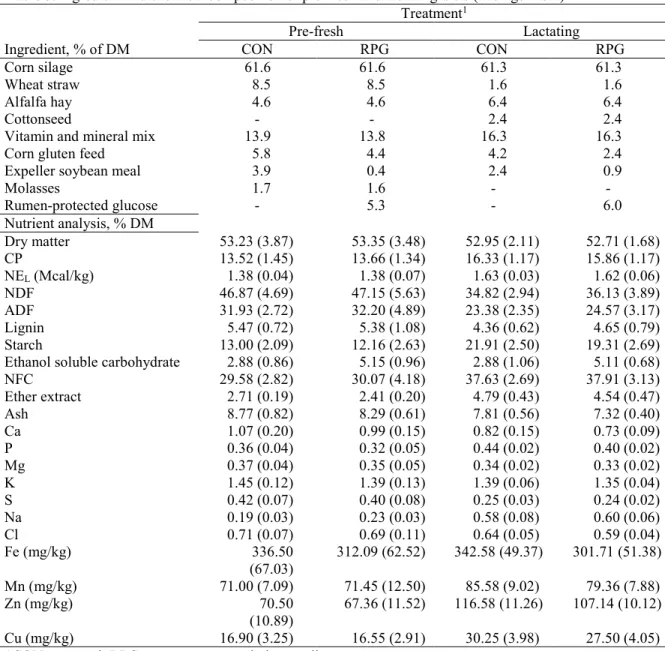
Table 5. Ingredient and chemical composition of pre-fresh and lactating diets (average ± SD) ... 59
Table 6. Production performance of post-partum dairy cows fed a control (CON) diet or a diet supplemented with rumen-protected glucose (RPG) ... 60
ACKNOWLEDGMENTS
First, I would like to acknowledge my major professors, Dr. Lance Baumgard and Dr. Hugo Ramirez-Ramirez. Lance, I will forever be grateful for your “thorough and intensive” interview on the walk back to Kildee Hall after one of your Animal Science 319 lectures. Allowing me to work with your graduate students ignited my love of science and research. Without your mentorship, I would never have ended up where I am today. Hugo, I am thankful that you took a chance on me as a graduate student. You have given me ample opportunities to get “boots on the ground” experience on different farms (even in a different country!), and those experiences are invaluable to me. Your leadership has helped me become the person I am today.
I would also like to acknowledge my colleagues, Dr. Sara Kvidera, Erin Horst, Mohammad Al-Qaisi, Johanna Mayorga, Megan Abeyta, Brady Goetz, Dr. Mathew O’Neil, Ashley Thomas, Brooke Dooley, Emily Branstad, and Layla King. I would not have been able to do this without all of your dedication, hard work, support, and friendship. Thank you all for your help and for all of the fun we had along the way!
Thank you to all of my family members who have been supportive of me throughout my college career. Especially to my mom, Sara. Without your support, I would not be where I am today. You always joke that I didn’t get my brains from you, but you sure showed me how to never give up even when times get hard. You have been there for me through tears of laughter, frustration, and stress. Thank you for being my best friend. I love you very much!
Finally, thank you to my wonderful husband, Shaun McCarthy. Thank you for always being there for me. You were my rock through this whole experience. Even when we were minutes, miles, states, or even countries apart, I knew you were just a phone call away if I
needed anything. Thank you for watching Bailey while I was away for conferences, and for making dinner while I was working on writing this paper. I love you, and I can’t wait to see where life takes us next!
ABSTRACT
The transition period is an energetically demanding time for the dairy cow. Successfully converting from a pregnant, non-lactating state to a non-pregnant, lactating state requires exquisite metabolic adaptations to ensure adequate glucose sparing for lactation onset. The inability to effectively partition nutrients towards lactation is associated with metabolic disorders. Dysfunctional glucose trafficking may not only predispose cows to maladapt to lactogenesis, but also limit milk synthesis and reproductive function during established lactation. Therefore, we hypothesized that glucose availability may limit milk yield (MY) during the transition period. Consequently, objectives were to determine the effects of feeding a rumen-bypass glucose product during the periparturient period on milk production, energetic metabolism, and inflammatory response in dairy cows.
CHAPTER 1: LITERATURE REVIEW
The Transition Period
In dairy production, the time frame encompassing 3 weeks prepartum through 3 weeks postpartum is loosely defined as the transition period (Grummer, 1995; Zapata, 2015). The transition period is named as such because the cow undergoes a physiological transition from a late gestation, non-lactating state to a non-pregnant, lactating state. Prior to parturition, the dairy cow faces a substantial metabolic strain to support a growing fetus followed by the large energetic demand of lactation. Concomitant with these metabolic adaptations, dry matter intake (DMI) typically decreases prior to parturition (Weber et al., 2013; Song et al., 2016). Fetal growth, parturition and the onset of lactation require an orchestrated partitioning of nutrients, chiefly energy and protein, into different metabolic pools such as fetal tissue and membranes, mammary gland, and the gastrointestinal tract (GIT; Goff and Horst, 1997). Maladaptation to these metabolic shifts leads to inefficient utilization of nutrients; as a result, transition dairy cows are at a higher risk of health disorders. In fact, it is estimated that up to 50% of transitioning dairy cows experience at least one negative health outcome (Drackley, 1999). In addition, it has been reported dairy cows, regardless of health status, experience some degree of systemic inflammation throughout the transition period (Bradford et al., 2015). Inflammatory responses ostensibly have detrimental effects on the cow’s well-being and productivity. Thus, it is important to implement nutritional and managerial strategies to help cows successfully navigate the transition period.
Nutrient Partitioning During the Transition Period
The transition period is a nutritionally challenging time; during pregnancy, the gravid uterus, fetus, and mammary gland increase their demand up to five-fold for fatty acids, up to
three-fold for glucose, and two-fold for amino acids (AA; Bell, 1995). Furthermore, lactation onset requires many tissues to undergo biological adaptations to metabolize all nutrient classes to meet the physiological demands of the mammary gland and other tissues (Baumgard et al., 2017). Major metabolic shifts include increased rate of adipose lipolysis, hepatic gluconeogenesis and skeletal muscle proteolysis (Bauman and Currie, 1980; Table 1). Beginning 3 weeks prior to parturition, DMI gradually decreases by 30 to 40% (Coppock et al., 1972; Grummer, 1995; Hayirli et al., 2002). Although not entirely understood, reduced DMI prior to parturition is associated with gut-fill due to a growing fetus (Ingvartsen et al., 1992) or physiological shifts mediated by endocrine mechanisms, namely increased circulating leptin and growth hormone (GH; Smith et al., 1976). Given the complexity of the various physiological processes during the transition period, it is vital for cows to partition nutrients accordingly to allow for copious milk production while maintaining a robust health status.
Working with sheep, Villalba et al. (2009) discovered that DMI decreased upon rumen distention, and subsequently increased when distention was relieved. Mimicking gut fill may have stimulated rumen stretch receptors triggering a satiety response (Grovum, 1979). Because a fetus is housed in the uterus, the stretch receptor theory may not be applicable to the transition cow scenario. However, it is reasonable to think that the volume of the enlarged uterus occupies more space in the abdomen, thus reducing the rumen’s physical expansion capacity. In accordance with this, Forbes (1968) reported that the growing fetus compromised feed intake at week 5 prior to parturition in ewes. Therefore, a similar situation may be envisioned in dairy cows such that a reduction in rumen expansion capacity and the growing fetus may partly explain the reduction in DMI prior to calving.
Endocrine regulation of feed intake may also be associated with metabolic shifts in the periparturient period. Concentration of circulating leptin, a hormone regulating appetite (Campfield et al., 1995; Halaas et al., 1995; Pelleymounter et al., 1995), has been reported to be highly correlated with percent body fat in rodents and humans (Considine et al., 1996; Weigle et al., 1997). At parturition, plasma leptin concentration has been reported to decrease by up to 50%, inducing greater DMI during lactation (Block et al., 2001). Alternately, GH increases after calving (Bell and Bauman, 1997) and it can induce lipolytic activity (Lee et al., 1974) when cows are in negative energy balance (NEBAL; Bell and Bauman, 1997), thus mobilization of adipose tissue for a systemic energy source. At the same this period is characterized by decreased insulin sensitivity, demonstrated in monogastrics (McGowan et al., 1992; Barb et al., 1998; Larsson et al., 1998) and ruminants (Morrison et al., 2001). This phenomenon is associated with the initiation of catabolic activities such as adipose tissue lipolysis (Chilliard, 1993). These metabolic alterations may, in part, cause metabolic ailments (i.e. ketosis), but also allow for increased energy supply for lactation.
In addition to the endocrine changes influencing nutrient partitioning, glucose homeostasis is important for cow health and performance (Bell, 1995; Beever et al., 1999). Glucose is an important fuel for ATP production and synthesis of proteins, lipids, and nucleotides (Scott et al., 1976; Threadgold and Kuhn, 1979). Although complex, regulation of circulating glucose is chiefly governed by insulin and glucagon; through their antagonistic effects, these hormones ensure plasma glucose is “spared” for milk synthesis (Baumgard et al., 2017). This is due to the role of glucose as the precursor for lactose synthesis and reducing equivalents for milk fat synthesis (Malpress and Morrison, 1950; Neville et al., 1983; Cant et al., 2002). Lactogenesis requires large quantities of glucose; the mammary gland utilizes
approximately 72 g of glucose to produce 1 kg of milk (Kronfeld et al., 1982). For high-producing dairy cows (milk yield ˃ 45 kg milk/d), the overall glucose turnover can exceed 3 kg/d with a large proportion being partitioned towards lactogenesis alone (Baumgard et al., 2017).
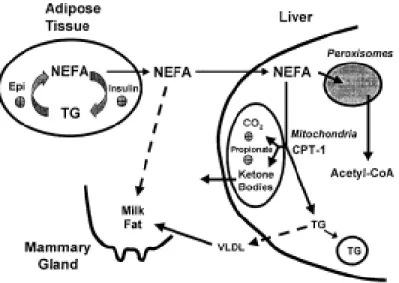
Furthermore, successfully managing body energy reserves is critical for navigating the transition period (McNamara, 1991, 2015). In order to spare glucose for milk synthesis, dairy cows increase their bioenergetic reliance on non-esterified fatty acids (NEFA; derived from adipose tissue mobilization) rather than glucose (Dunshea et al., 1990). In other words, the increase in circulating NEFA represents an alternative energy source that allows peripheral tissues to depend less on glucose and increase their dependence on lipids as a fuel source, thus sparing glucose for milk synthesis (Bauman and Currie, 1980; Drackley et al., 1991a, b). Blood NEFA concentrations are proportionate to the extent of NEBAL (Dunshea et al., 1990), in turn, hepatic NEFA uptake is proportionate to circulating levels (Drackley, 1999). There are 3 fates for NEFA entering the liver: they can be completely oxidized to carbon dioxide, re-esterified into a triglyceride (TG), or they can be partially oxidized to ketone bodies (Figure 1; Drackley, 1999; Nafikov et al., 2006). Non-esterified fatty acid-derived ketones can be used as a fuel source and precursors for milk fat synthesis for cows in NEBAL (Baumgard et al., 2017), therefore sparing glucose for production.
Figure 1.Fates of mobilized fat from adipose tissue in the lactating dairy cow. Adapted from Drackley (1999)
Table 1. A partial list of metabolic changes associated with the transition period in ruminants
Physiological Function Metabolic Change Tissues Involved Milk Synthesis Increased use of nutrients Mammary Lipid Metabolism Increased lipolysis
Decreased lipogenesis
Adipose Tissue
Glucose Metabolism Increased gluconeogenesis Increased glycogenolysis Decreased use of glucose and increased use of lipid as energy source
Liver
Muscle and other body tissues
Protein Metabolism Mobilization of protein reserves
Muscle and other body tissues
Role of Hormones in the Transition Period
The orchestration of nutrient partitioning at lactation onset is mostly governed by modified endocrine signaling. These shifts involve alterations in tissue set-points and tissue sensitivities to allow for glucose sparing and uptake by the mammary gland (Table 2; Baumgard et al., 2017). Collectively, this is a strategy the dam utilizes to decrease systemic utilization of glucose and switch fuel preference in peripheral tissues toward utilization of NEFA and ketones as energy substrates.
Growth hormone
Many of the homeorhetic adaptations to support lactation stem from the somatotropic axis (Bauman and Currie, 1980). For example, adipose tissue lipolysis and muscle proteolysis occur to accommodate for the energy deficiency that is commonly encountered during the transition period. This adaptation is mediated by increased GH concentration in the prepartum dairy cow, coupled with a decrease in systemic insulin sensitivity. Combined, these metabolic shifts result in a scenario that triggers adipose tissue lipolysis and decreased glucose oxidation in peripheral tissues (Bell and Bauman, 1997).
In 1937, Asimov and Krouze pioneered the work to discover the effects of a pituitary gland substance to increase MY in dairy cows by subcutaneously injecting crude pituitary gland extracts. Subsequent work by Young (1947) further refined the crude pituitary gland substance to discover that GH was the contributing factor to the galactopoietic effect. At that time, studies of long-term exposure to GH injections were hard to conduct because 6,000 mg of GH were needed to elicit greater milk synthesis, but the amount of GH recovered from an anterior pituitary is only 5 to 15 mg (Young, 1947). Therefore, research stalled until the advent of recombinant technology allowed for the in vitro production of bovine somatotropin (rbST)
with similar effects to its native form (Peel et al., 1983). The mechanisms of action of rbST involve increased hepatic gluconeogenesis and suppression of the inhibitory effect of insulin on gluconeogenesis (Peel and Bauman, 1987). In addition, rbST increases complete fatty acid oxidation in the liver (Pocius and Herbein, 1986). Thus, if glucose is limiting MY in early lactation, rbST may increase the amount of glucose readily available for milk production. There are numerous studies on dairy cows determining the effect of rbST on MY (Peel et al., 1983; Richard et al., 1985). Although there is variation in stage of lactation and the magnitude of the response, all rbST-treated cows have shown increased MY ranging from 2 to 5 kg/d more milk compared with non-treated cows (Peel and Bauman, 1987). Later work by Bauman (1999), demonstrated that rbST was more effective at increasing MY once cows were in a positive energy balance (EBAL).
Insulin
Due to its importance in glucose homeostasis, it is not surprising that insulin plays a major role in sparing glucose for the mammary gland. Glucose-stimulated insulin secretion from the pancreas is blunted at lactation onset (Rhoads et al., 2004) and this explains why early lactating cows are hypoinsulinemic (Kunz et al., 1985). There is also a decreased sensitivity and responsiveness to insulin in muscle and other tissues (Vernon, 1986; Petterson et al., 1993; Bell, 1995; Bell and Bauman, 1997). The liver has a reduced response to insulin, decreasing the ability to inhibit hepatic gluconeogenesis at the onset of lactation (Bauman and Elliot, 1983; Bauman, 2000). Furthermore, insulin has anti-lipolytic properties (Chakrabarti et al., 2013; Morigny et al., 2016), so the decreased insulin concentration prior to calving allows for increased lipolysis and ultimately increased circulating NEFA as energy substrate. The mammary gland does not have appreciable amounts of glucose transporter type 4 (GLUT4;
Zhao et al., 1996, Zhao and Keating, 2007), therefore, it is not affected by insulinemic state. In addition, adipose glucose transporter type 1 (GLUT1) expression is decreased in early lactation, with a gradual increase as the lactation progresses (Komatsu et al., 2005). Collectively, the decreased sensitivity to insulin by peripheral tissues and reduced glucose uptake by adipose tissue allow for increased availability of glucose for the mammary gland.
Glucagon
Glucagon is a hormone produced by the pancreas which has the capacity to increase concentration of circulating glucose through glycogenolysis, AA uptake, and increasing gene expression of phosphoenolpyruvate carboxykinase and pyruvate kinase (Brockman et al., 1975; Flakoll et al., 1994; Hippen et al., 1999; Bobe et al., 2003, 2009; Nafikov et al., 2006). By stimulating lipolysis, glucagon increases glycerol availability (Brockman et al., 1975) for hepatic metabolism through gluconeogenesis and glycolysis (Remond et al., 1993; Goff and Horst, 2001). Osman and colleagues (2010) reported increased circulating glucose with a concomitant decrease in blood NEFA and BHB concentrations when glucagon was subcutaneously administered to early-lactation dairy cows.
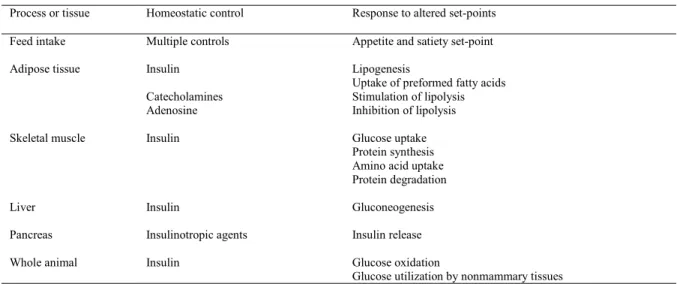
Table 2. A partial list of alterations in the response to homeostatic responses that occur in different tissues and processes during lactogenesis and early lactation in ruminants1
Process or tissue Homeostatic control Response to altered set-points
Feed intake Multiple controls Appetite and satiety set-point
Adipose tissue Insulin
Catecholamines Adenosine
Lipogenesis
Uptake of preformed fatty acids Stimulation of lipolysis Inhibition of lipolysis
Skeletal muscle Insulin Glucose uptake Protein synthesis Amino acid uptake Protein degradation
Liver Insulin Gluconeogenesis
Pancreas Insulinotropic agents Insulin release
Whole animal Insulin Glucose oxidation
Glucose utilization by nonmammary tissues
Energy Balance
Energy balance is calculated as the difference between energy consumed and energy expenditure in maintenance, growth, and milk synthesis. The EBAL for dairy cows is expressed as: EBAL = net energy intake – (net energy of maintenance + net energy of lactation; NRC, 2001). Beginning immediately prior to calving through up to 10 to 12 weeks in lactation, dairy cows are typically in NEBAL (Bertics et al., 1992; Grummer, 1995).
The net energy intake is determined by measuring the amount of feed consumed and its energetic content. The net energy for maintenance is calculated as: 0.08 × body weight (BW)0.75. Although this equation is thought to be precise, especially in times of thermoneutral conditions (Moore et al., 2005), the net energy of maintenance may be difficult to measure in transitioning dairy cows, due to marked changes in body composition and increasing splanchnic mass (McDonald et al., 1995). Genetic selection for high producing animals has been accompanied by an increase in fasting heat production, therefore, the NEm is thought to have increased concomitantly (Veerkamp and Emmans, 1995; Agnew and Yan, 2000; Morases et al., 2015). In addition to energy requirements for maintenance, the onset of lactation triggers further energy partitioning towards synthesis of milk and milk components. In dairy cows, the equation to determine net energy of lactation (NEL) is defined as: NEL (Mcal/kg) = [(0.0929 × milk fat %) + (0.0547 × milk crude protein %) + (0.0395 × milk lactose %)] × milk production (kg) in the NRC (2001). The NEL equation is thought to be relatively precise, given the concentrations of fat, protein, and lactose are known (Weiss, 2002). However, one caveat of this equation is the use of the crude protein (CP) concentration in the milk instead of true protein percent. Therefore, requirement for NEL may be overestimated (NRC, 2001).
Metabolic Disorders
The profitability of a dairy farm is influenced, in large part, by cow health and productivity (Dijkhuizen and Morris, 1997; Galligan, 2006). The transition period, specifically the onset of lactation, is accompanied by social, dietary, and metabolic pressures, ultimately leading to metabolic ailments (Carpenter et al., 2018). Metabolic problems are broadly defined as disorders related to the vast metabolic shifts typically occurring in the periparturient period (i.e. ketosis and hypocalcemia; Carpenter et al., 2018). These disorders may be due to energetic deficits in the peri-partum period, stressors associated with calving, and the need to partition nutrients to support colostrum and milk synthesis. Therefore, implementing dietary strategies to help alleviate the myriad of metabolic disorders occurring after parturition will likely improve animal production and well-being.
Inflammation in the Transition Period
Inflammation is a response to infection and tissue injury, and it involves many physiological and pathological processes triggered by components of the innate and adaptive immune systems (Medzhitov, 2008; Bradford et al., 2015). It has been reported that nearly all dairy cows endure some degree of inflammation (Bradford et al., 2015) through the transition period. During this period, there are multiple pools where bacteria and associated endotoxins may infiltrate into systemic circulation; these pools include the mammary gland (Hogan and Smith, 2003), uterus (Sheldon et al., 2002), and GIT (Eckel and Ametaj, 2016). When lipopolysaccharide (LPS), a glycolipid present on the outer membrane of gram-negative bacteria (Mani et al., 2012), infiltrates into systemic inflammation, leukocytes and immune-active tissues (i.e. hepatocytes) produce an inflammatory milieu including cytokines and acute phase proteins (i.e. LPS-binding protein [LBP], serum amyloid A [SAA], and haptoglobin
[Hp]) which mediate leukocyte trafficking, promote vasodilation, and clear pathogens. Additionally, in response to these processes, cows exhibit mild hyperthermia, anorexia, and decrease milk production (Dantzer and Kelley, 2007; Bradford et al., 2015). Acute phase proteins are reliable and widely accepted markers of overall health and inflammatory status of the dairy cow (Ceciliani et al., 2012), however understanding the role of inflammation in the transition period requires further investigation.
Inflammation has been noted postpartum in cattle, pigs, mice, and humans (DiSilvestro, 1986; Humblet et al., 2006; Rosenbaum et al., 2012a, b; Gregor et al., 2013). Qu and colleagues (2014) discovered increased circulating Hp after calving, even in the absence of apparent disease; cows with clinical disease had even greater circulating Hp concentrations compared to the healthy cows. This response may be due to inflammation originating in the uterus (Yuan et al., 2015), adipose tissue (Sadri et al., 2010), liver, (Loor et al., 2005), intestine (Gott et al., 2015; Abuajamieh et al., 2016), or potentially from psychosocial (Silva et al., 2013) or heat stress (Tao et al., 2013; Zhang et al., 2014). Although inflammation ideally helps the body overcome and adapt to an antigen, it may also contribute to the development of metabolic disorders throughout the transition period (Bradford et al., 2015).
Rumen Acidosis
Prior to parturition, dairy cows are typically fed a high forage diet (Humer et al., 2018), and the rumen papillae have a reduction in height and a reduced ability to absorb volatile fatty acids (VFA) compared to cows on a lactating diet (Goff and Horst, 1997; Kleen et al., 2003). After calving, dairy cow diets are then modified to include more concentrates in an effort to increase dietary energy density to support milk synthesis (Humer et al., 2018). Because the rumen has been adapted to a dry cow diet, the rumen papillae are unable to meet the absorptive
capacity required to accommodate the large influx of VFA produced from a readily fermentable diet (Goff and Horst, 1997; Kleen et al., 2003). When the increase in VFA and lactic acid concentrations exceed the rate of VFA removal, rumen pH decreases (Owens et al., 1998). This disorder is termed rumen acidosis and is classified as subacute ruminal acidosis (SARA) when ruminal pH is < 5.5 (Garrett et al., 1999), or acute rumen acidosis, in which the rumen pH is < 5.2 (Owens et al., 1998; Nagaraja and Lechtenberg, 2007). Reduced DMI, liver abscesses, diarrhea, laminitis, and milk fat depression can result from ruminal acidosis (Kleen et al., 2003).
Although the incidence of SARA may be difficult to quantify, some studies in the United States have estimated that it is between 19 and 26% in early and mid-lactation cows, respectively (Garrett et al., 1997; Plaizier et al., 2008). In beef cattle, treatment costs alone amount to approximately $4.6 million annually (USDA, 2016); Stone (1999) estimated economic losses due to SARA in a dairy herd to be $1.12 per cow per day. The source of losses can be attributed to reductions in MY, milk fat production, milk production efficiency, and increased lameness which may also lead to an increase in culling rate (Nocek, 1997; Stone, 1999). Due to the large economic impact of SARA, many feeding strategies have been researched to reduce incidences of rumen acidosis, including manipulation of fiber particle size, feeding buffers and alkalizers, and the use of direct fed microbials (DFM).
Physically effective fiber (peNDF) is based on physical characteristics of a feedstuff which influences chewing activity and the biphasic nature of contents in the rumen (Mertens, 1997), and is essential in dairy cow diets, especially in early and mid-lactation. Generally, peNDF is calculated by multiplying the NDF concentration by the proportion of feed maintained on a 1.18-mm sieve (Mertens, 1997). Chewing activity, salivary buffer secretion,
rumen motility and mixing are maintained by peNDF (Allen, 1997). Saliva entering the reticulorumen contains buffers to help regulate pH. To ensure proper rumination and saliva production for rumen buffering, it has been recommended that at least 40% of feed particles be longer than 8 mm (Heinrichs and Kononoff, 2002).
Direct fed microbials have been defined as “a source of live, naturally occurring microorganisms” (Yoon and Stern, 1995) which benefit the host animal by improving the intestinal microbial balance (Fuller, 1989). Because consumers have become increasingly concerned with antibiotic use in animal production, research with DFM on health and performance of food-producing animals has become increasingly popular. Although DFM are administered for a variety of reasons, their effect on ruminal fermentation is of importance for transitioning dairy cows. Krehbiel and colleagues (2003) stated DFM may prevent rumen acidosis. For example, lactic acid utilizing bacteria, such as Megasphaera elsdenii, have been
reported to decrease lactate accumulation when cows transition from a low- to high-concentrate diet (Greening, et al., 1991). Propionibacterium, also a lactic acid utilizing
bacteria, does not decrease the amount of lactate in the rumen, but is a very efficient propionate producer (Krehbiel et al., 2003). Interestingly, lactic acid producing bacteria (LAB) such as
Lactobacillus and Enterococcus have been shown to prevent rumen acidosis in transitioning
dairy cows (Nocek et al., 2002). One theory as to how LAB decrease the risk for rumen acidosis is that other ruminal microorganisms adapt to the lactate being produced, thus “priming” the rumen microbiome to adapt to a greater VFA load with a higher concentrate diet (Yoon and Stern, 1995).
Fatty Liver
The transition period is characterized by increased adipose tissue lipolysis, this increases circulating NEFA that can be incorporated by the mammary gland to produce milk fat; oxidized by peripheral tissues (mainly skeletal muscle) for energy or taken up by the liver (Reynolds et al., 2003). The liver can then oxidize the NEFA or secrete it, but the ruminant liver has a low capacity to export lipids (Reid et al., 1979; Kleppe et al., 1988; Drackley, 1999). Thus, triacylglycerol (TAG) accumulation is likely when the esterification rate exceeds the rate of oxidation plus export of very low-density lipoprotein (VLDL; Grummer, 1993). This condition leads to a metabolic disorder known as hepatic lipidosis, otherwise commonly referred to as “fatty liver”. This condition is a major welfare concern for high-producing dairy cows. Although the incidence of fatty liver is hard to determine because the diagnosis requires a liver biopsy, it is estimated that up to 50% of early lactation cows experience it to some extent (Reid, 1980; Grummer, 1993; Jorritsma et al., 2000, 2003). The estimated annual cost of fatty liver in the United States is over $60 million (Bobe et al., 2004) due to its detrimental effects on production (Littledike et al., 1981).
Even though hepatic lipidosis is hard to diagnose; mitigation and prevention are important because the disorder often leads to an increase in the incidence and severity of other diseases (Veenhuizen et al., 1991). Decreasing fatty acid mobilization, reducing liver fatty acid esterification, and increasing hepatic VLDL export would theoretically decrease the risk for fatty liver (Grummer, 1993). Unfortunately, research data on this subject is inconclusive and some strategies have been unsuccessful. For example, feeding prepartum dairy cows low- or high-energy diets (Grum et al., 1996; Douglas et al., 2004), or decreasing milk fat content to decrease the energy expense of lactation (Castañeda-Gutiérrez et al., 2005) did not diminish
rates of hepatic lipidosis. Similarly, administrating glucogenic precursors such as propylene glycol, propionate salts, and AA to alleviate lipolysis have resulted in inconsistent responses (Hoedemaker et al., 2004).
Ketogenesis and Ketosis
Post-parturition, circulating glucose and subsequently insulin, are decreased in the dairy cow, as a result, adipose tissue lipolysis occurs at an increased rate. In addition, an energetic deficit is likely to occur in early lactation due to the increased metabolic demands for milk production coupled with decreased DMI. In this scenario, NEFA are then mobilized and metabolized in 4 possible pathways: they can be directly used as an energetic substrate by peripheral tissues, such as skeletal muscle, incorporated into milk fat, esterified to a glycerol backbone in the liver, or intraconverted into a ketone body via incomplete hepatic fatty acid oxidation (Bell, 1979). The increase in circulating ketone bodies, namely acetoacetate, acetone, and β-hydroxybutyrate (BHB), is termed ketosis. This disorder can be classified as subclinical when blood BHB ≥ 1.2 mmol/L (Bobe et al., 2004), and clinical ketosis when circulating BHB ≥3.0 mmol/L (Oetzel, 2004; McArt et al., 2015).
Ketosis is the most prevalent post-partum metabolic disorder (Oetzel, 2004), and occurs more frequently in high producing cows. It is estimated ≥ 40% of dairy cows experience subclinical ketosis (McArt et al., 2015), whereas clinical ketosis affects about 20% of early lactation cows (Gillund et al., 2001). Estimated costs of ketosis are variable with no palpable consensus in published research. Nonetheless, it has been reported that each case of ketosis costs $77 ± 24 per case for primiparous cows and $181.91 ± 63.74 per case for multiparous cows; both amounting to much less than the previously estimated cost at $232.00 per case (Guard, 2008; Liang et al., 2017). Money loss due to decreased milk production is estimated
to be $1.00 ± 0.65 and $6.67 ± 1.69 per case for primiparous and multiparous cows, respectively (Liang et al., 2017). In addition, veterinary treatment costs were approximated at $52.44 ± 21.29 and labor costs were $11.76 ± 5.59 per case (Liang et al., 2017). The culling and death costs for primiparous cows were calculated to be $4.72 ± 1.06 and $5.42 ± 0.84, respectively, whereas the cost of culling and death for multiparous cows were estimated to be $6.87 ± 7.30 and $5.80 ± 0.85, respectively (Liang et al., 2017).
At the herd level, ketosis is associated with higher incidence of displaced abomasum (LeBlanc et al., 2005), reduced MY, increased culling rate, and increased death loss (Littledike et al., 1981; Duffield et al., 2009). Therefore, nutritional strategies that can decrease the incidence of ketosis on a commercial level would benefit multiple profitability metrics.
Endotoxemia
Although the most obvious and likely sources of endotoxemia are metritis and mastitis (Sheldon et al., 2002, Hogan and Smith, 2003), feeding regime may also predispose cows to face a surge in luminal endotoxin concentration as a result of lysis of certain rumen bacteria (Mao et al., 2013). The GIT serves a dual purpose: to digest and absorb dietary nutrients, and to prevent infiltration of unwanted compounds from the lumen into the bloodstream (Mani et al., 2012). The barrier function of the GIT is so critical to protect the cow from endotoxin infiltration that the majority of the immune system is harbored within the splanchnic bed (van der Heijden et al., 1987). Stressors that disrupt the epithelial barrier function, such as feed restriction or SARA, may lead to endotoxin translocation and cause systemic inflammation (Gozho et al., 2005; Emmanuel et al., 2007; Minuti et al., 2014). For example, Gozho et al. (2005) observed that concentration of circulating endotoxins increased by abruptly changing steers from a high fiber to a high-concentrate diet. The subsequent decrease in ruminal pH
occurring after ingesting a high concentrate-based diet may cause death and lysis of gram-negative bacteria, thus increasing concentration of LPS in the GIT (Nagaraja et al., 1987; Andersen et al., 1994; Mao et al., 2013).
Another stress factor that has been associated with increased endotoxemia is feed restriction. Recent work by Kvidera et al. (2017b) has shown that feed restriction of dairy cows compromises gut integrity. The response to increasing feed restriction resulted in altered morphology of the intestinal epithelium so that animals that were feed-restricted had decreased villus height and width as well as reduced crypt depth. These alterations in gut histology not only imply altered digestion and absorption processes but can also lead to loss of effective barrier function. In the same study, the authors also report increased concentration of circulating biomarkers of inflammation which may be a direct result of increased permeability due to loss of architectural integrity in the gut.
Endotoxemia causes decreased rumen motility by inhibiting smooth muscle contractions, ultimately causing decreased abomasal emptying (Eades, 1993; Wittek et al., 2004). Other metabolic diseases such as SARA and fatty liver are commonly associated with endotoxemia (Andersen, 2003; Eckel and Ametaj, 2016). Because endotoxin translocation has been shown to be caused by SARA (Nagaraja et al., 1987; Emmanuel et al., 2008; Khafipour et al., 2009) and feed restriction (Kvidera et al., 2017b), nutritional and managerial strategies that reduce these risks of may mitigate the negative impacts of endotoxemia.
Nutritional and Management Strategies to Mitigate Effects of NEBAL Propylene Glycol
Propylene glycol (PG) is commonly administered as a drench (Grummer et al., 1994) or in dry form in feed (Chung et al., 2009) for the treatment of ketosis. The latter authors
reported that feeding dry PG to early lactating dairy cows decreased the incidence of subclinical ketosis. When drenched, a spike in plasma glucose occurs within 30 min after administration (Struder et al., 1993; Grummer et al., 1994) due to an increase in the absorption of propionate by the rumen (Manns and Boda, 1967). Regardless of the delivery method, most PG leaves the rumen intact, while some is metabolized to propionate (Emery et al., 1964). Overall, PG has been shown to be an effective precursor for hepatic gluconeogenesis that results in decreasing circulating NEFA and BHB (Fisher et al., 1971; Struder et al., 1993; Hoedemaker et al., 2004), likely due to an increase in circulating glucose (Struder et al., 1993) and insulin (Sauer et al., 1973; Patton et al., 2004).
Ionophores
Ionophores, such as monensin, are broad-spectrum antibiotics predominantly affecting Gram-positive bacteria by interfering with ion transport across cellular membranes causing bacterial cell death (Duffield et al., 2008). This mode of action results in a shift in rumen microbial populations (Duffield et al., 2008) accompanied by a shift in VFA production favoring propionate (Richardson et al., 1976; Armentano and Young, 1983; McGuffey et al., 2001). This is important because propionate is the primary glucogenic precursor in well-fed ruminants. However, hepatic propionate uptake and metabolism can either increase (McCarthy et al., 2015) or have no effect on gluconeogenesis (Larsen and Kristensen, 2009 a, b). The ionophore-induced shift in microbial populations in dairy cows impacts rumen metabolism by: increasing the efficiency of energy metabolism, improving nitrogen metabolism, and reducing bloat and lactic acidosis (Schelling, 1984).
In addition to increasing gluconeogenic precursors, ionophores have been shown to decrease circulating BHB concentrations especially during early-lactation (Abe et al., 1994;
Duffield et al., 1998, 2008). Similarly, circulating NEFA concentrations have been shown to decrease with supplementation of monensin (Duffield et al., 2008); however, results have differed among studies. Although not consistent, plasma glucose concentrations have been shown to increase with supplementation of monensin (Melendez et al., 2004; Kennerman et al., 2006; Duffield et al., 2008). Because of the aforementioned reasons, feeding ionophores may be a practical way to reduce the incidence or severity of metabolic diseases associated with the transition period.
Fat Supplementation
Because DMI generally decreases prior to calving, increasing the energy density of the feed may be a solution to increase energy intake throughout the transition period. Supplying additional dietary fat to dairy cows would be one potential strategy. Andersen et al. (2008) speculated that by increasing the lipid content in the diet of prepartum dairy cows, their bodies become “primed” to improve lipid metabolism upon calving. As such, hepatic capacity for β-oxidation of long-chain fatty acids would increase, leading to prevention of fatty liver via decrease TAG concentration and an increase in hepatic glycogen (Grum et al., 1996; Petit et al., 2007).
Feeding dry cows supplementary dietary fat has shown inconsistent responses by either decreasing (Grum et al., 1996; Moallem et al., 2007; Karimian et al., 2015; Zapata et al., 2015) or not affecting (Afzalzadeh et al., 2010) prepartum DMI. However, these contradictions may be due to the different amounts and forms of fat that were supplemented, fatty acid profile, palatability, or possibly inhibition of fiber digestion (Reidelberger, 1994). When feeding moderate (2% fat supplement, 1.68 Mcal NEL/kg DM) or high (4% fat supplement, 1.74 Mcal NEL/kg DM) levels of rumen-inert free fatty acids to dry cows 4 weeks prior to parturition,
Afzalzadeh and colleagues (2010) reported the additional dietary fat did not affect prepartum DMI. They also discovered no differences due to fat supplementation on circulating NEFA concentrations or prepartum blood glucose, however, circulating glucose concentration was increased in the fat-supplemented groups (Afzalzadeh et al., 2010). Supplying additional fat to lactating cows has been researched to determine if additional energy improves MY, DMI (Onetti et al., 2001; Duske et al., 2009), or reproductive performance (Rodney et al., 2015). Although there was no difference in DMI prior to calving, Afzalzadeh and colleagues (2010) found that MY is increased with supplementation of high amounts (540 g/kg, 1.74 Mcal NEL/kg DM) of dietary fat prior to calving. This is contradicted by Hayirli et al. (2011), who found no differences in MY due to prepartum diets. Consequently, the effects of dietary fat on production variables in the transitioning dairy cow appears complex and dependent upon multiple parameters that are not clearly defined (Hayirli et al., 2011).
Protein Supplementation
In early lactation, the abrupt demand for synthesis of milk lactose and protein, increase the requirements for glucose and AA, respectively (Bertics et al., 1992; Reynolds et al., 2003). Consequently, there is a negative protein balance, estimated to be greatest at 7 days in milk (DIM; Grummer, 1995; Bell et al., 2000) in which AA are being mobilized from skeletal muscle and uterine smooth muscle (Gibb et al., 1992; Andrew et al., 1994). Drackley and colleagues (2001) hypothesized that feeding glucogenic AA can increase gluconeogenesis rates; interestingly, supplementing dairy cows with protein prior to calving provides inconclusive evidence to support this theory. For example, Putnam and Varga (1998) reported that, by increasing protein content in the dry-period diet, plasma glucose concentration increased, whereas VandeHaar et al. (1999) determined that supplying additional protein
prepartum had no effect on circulating glucose. The increase in circulating glucose concentration reported by Putnam and Varga (1998) may be attributed to the preferential role of gluconeogenic AA to support glucose supply in late lactation, due to the increasing levels of protein being fed. Contrary to this, Larsen and Kristensen (2013) reported that essential amino acids (EAA) did not produce more liver glucose release post-partum.
It is difficult to assess exactly how many dietary AA are taken up by the liver and what portion of absorbed AA are being utilized for gluconeogenesis. Additionally, protein appears to be partitioned toward protein synthesis over gluconeogenesis in early lactation. It is evident that further research is needed to elucidate the roles of specific AA on glucose metabolism. Utilization of labeled AA to aid in this research is warranted.
Carbohydrate Supplementation
Increasing carbohydrate balance in dairy cows to improve milk production has been of interest because of glucose’s role in lactose synthesis. Dietary carbohydrate supplementation can take the form of neutral detergent fiber (NDF; Rabelo et al., 2003) or non-fiber carbohydrates (NFC) such as starches or sugars (Harmon, 1992). Evidence of carbohydrate supplementation affecting milk production responses are based on experiments assessing the effects of infusing exogenous glucose intravenously (Fisher and Elliot, 1966; Amaral et al., 1990; Brown and Allen, 2013), ruminally (Knowlton et al., 1998), abomasally (Clark et al., 1977; Huntington and Reynolds, 1986; Knowlton et al., 1998; Reynolds et al., 2001; Relling and Reynolds, 2008; Larsen et al., 2010), and duodenally (Lemosquet et al., 1997; Reynolds et al., 2001; Hurtaud et al., 1998). The premise of these experiments is that exogenous glucose supplementation would decrease reliance on alternative gluconeogenic precursors (Larsen and
Kristensen, 2009 a, b); however, results vary greatly upon supplementing exogenous glucose to dairy cows (Table 3 and Table 4).
Many studies have evaluated the effects of increased plasma glucose concentrations during lactogenesis. Fisher and Elliot (1966) infused glucose into the jugular vein of dairy cows between 1 and 10 months into their lactation. They did not observe any differences in DMI; however, they did note a 1.2 kg/d increase in MY. Interestingly, other experiments have reported no differences in DMI or MY upon intravenous glucose infusion in early lactation dairy cows (Amaral et al., 1990; Brown and Allen, 2013). The variability in responses to intravenously infusing glucose may be dependent on stage of lactation and overall EBAL of the cow. Intravenous infusion of glucose failed to increase MY in early-lactating dairy cows (Chelikani et al., 2003; Brown and Allen, 2013); whereas intravenous exogenous glucose infusion in mid- and late-lactation cows report varying results (Al-Trad et al., 2009; Curtis et al., 2018; Leane et al., 2018).
Because some studies have found an increase in MY with intravenously supplying exogenous glucose to lactating dairy cows (Fisher and Elliot, 1966; Curtis et al., 2018), it has been of interest to determine if supplying glucose post-ruminally will have the same effect on MY. Abomasally or duodenally infusing glucose in early- and mid-lactation cows has had inconclusive effects on MY (Clark et al., 1977; Dhiman et al., 1993; Knowlton et al., 1998). Increased MY reported by Knowlton et al. (1998) may be attributed to infusing 500 g/d of glucose more than Dhiman and colleagues (1993). This may have supplied additional glucose to increase milk production.
Since intravenous or post-ruminal administration of glucose to dairy cows is not a practical procedure for routine on-farm management, finding a way to supply carbohydrates to
the small intestine (SI) may be beneficial to improve animal performance. Increasing the dietary carbohydrate concentration has been shown to increase MY (Emmanuel et al., 2007); this response is likely due to a greater amount of propionate being made available for hepatic gluconeogenesis. However, if VFA production exceeds the rate of removal of VFA from the rumen, acidosis may occur (Plaizier et al., 2008). Abaker and colleagues (2017) observed that cows being fed a high-grain diet had a transient increase in MY, and subsequently, declined after 9 weeks to levels even lower than that of the control cows. They concluded the cows fed the high-grain diet had increased LPS translocation from the GIT to the blood, and likely caused an innate immune response (Abaker et al., 2017). This would trigger glucose partitioning towards activated immune cells, which become obligate glucose utilizers (Calder et al., 2007), diverting energy away from milk production. In a similar study infusing starch into the rumen of early lactation dairy cows, MY tended to increase (Knowlton et al., 1998) with no detrimental effects on animal health. The discrepancy in animal health outcome between these studies may be related to the fact that a short duration may not have had the long-term consequences of a sustained regime. Therefore, it is plausible that disruption of gut barrier for LPS translocation is the result of either an abrupt change in diet or a sustained insult to the intestinal epithelium.
Because of the possible negative consequences of introducing additional carbohydrates into the rumen, considering the development and supplementation with a rumen-bypass glucose product may be beneficial, assuming the cow will be able to absorb and utilize the glucose that reaches the SI.
The Small Intestine’s Ability to Absorb Glucose
Carbohydrates are unique due to their dual role in digestion and physiology (Hall and Mertens, 2017). Compared to monogastric animals, the ability of the SI to digest and absorb starches and sugars typically is less important, due to carbohydrates being rapidly fermented in the rumen (Aschenbach et al., 2010). This limitation is controversial (Harmon and McLeod, 2001) because up to 50% of starch in a diet fed to ruminants may escape ruminal fermentation and reach the lower gut (Johnson and Bergen, 1982). Even though very little glucose is absorbed by the SI (Reynolds, 2006), many tissues rely on glucose as an energy source. Therefore, gluconeogenesis in the liver and kidneys and marginal glucose absorption by the SI are vital processes for the adult ruminant (Mayes, 1996).
Although only a proportion of dietary glucose enters the SI of ruminants, it has been recognized the metabolizable energy (ME) utilization from starch digested in the SI is more efficient than when the starch is fermented in the rumen (Armstrong et al., 1960). Even though the site of starch digestion remains ambiguous (Nocek and Tamminga, 1991; Reynolds et al., 1997), it has been reported that starch digestion in the SI is approximately 95% (Reynolds et al., 1997). The utilization of starch in the SI is influenced by many factors: 1) carbohydrase and pancreatic amylase activities in the intestine, 2) visceral metabolism of glucose, and 3) endogenous glucose regulation (Nocek and Tamminga, 1991).
Adequate access to starch granules by enzymes and the limited enzymatic activity for starch hydrolysis in ruminants may be limiting factors for intestinal starch digestion (Owens et al., 1986). In order for starch to be digested in the SI, enzymes capable of cleaving α-1-4 and α-1-6 glycolytic bonds are required. Pancreatic amylase cleaves off maltriose and maltose amylose in the SI (Nocek and Tamminga, 1991), and subsequently maltase activity yields
glucose (Coombe and Siddons, 1973). Because pancreatic amylase cannot hydrolyze α-1-6 bonds, hydrolysis of amylopectin is completed by isomaltase (Siddons, 1968). Additional protein in the diet has been shown to improve starch digestion in the SI (Rust et al., 1979; Veira et al., 1980) by sparing cholecystokinin-releasing peptide from trypsin digestion and allowing the release of cholecystokinin from the intestinal mucosa, thus, increasing amylase release (Fuskiki and Iwai, 1989). However, Remillard and Johnson (1984) reported that the infusion of amylase did not increase starch digestion in steers, implying amylase activity is not limiting starch digestion in the SI.
It is difficult to study how much glucose introduced to the SI is absorbed. Studies looking at nutrient absorption generally utilize catheters in the portal vein; however, these studies do not take into account the metabolism of glucose by intestinal epithelium (Kronfeld, 1976; Reynolds et al., 1991). Numerous studies (Lomax and Baird, 1983; Reynolds and Huntington, 1988) have found no net glucose absorption in the portal vein when fed a normal lactating diet, suggesting glucose absorption is limited or the glucose is being utilized by the gut. However, when infusing glucose, starch, or dextrin in the abomasum of steers, Kreikemeier et al. (1991) found a linear increase in portal vein glucose with increasing glucose infusion. From this study, the maximum rate of glucose in the portal vein was at 20 g/h when starch was infused, suggesting that hydrolysis, and not absorption, is a limiting factor. If glucose is absorbed, it has 5 fates: 1) oxidation, resulting in the production of CO2 and H2O, 2) partial glycolysis, producing either lactate or alanine from pyruvate, 3) stored as glycogen, 4) stored as fat, or 5) the carbons can be utilized for AA synthesis.
Because glucose is essential for lactose production, an increase in glucose concentration may seem a plausible way to increase MY. Many studies demonstrate increased
plasma glucose concentration when glucose is infused abomasally (Nichols et al., 2016; Gualdrón-Duarte and Allen, 2018); however, this is not practical in a commercial farm setting. Therefore, it may be beneficial to find a way to feed dairy cows in a way that delivers glucose to the SI to be absorbed and utilized for milk production.
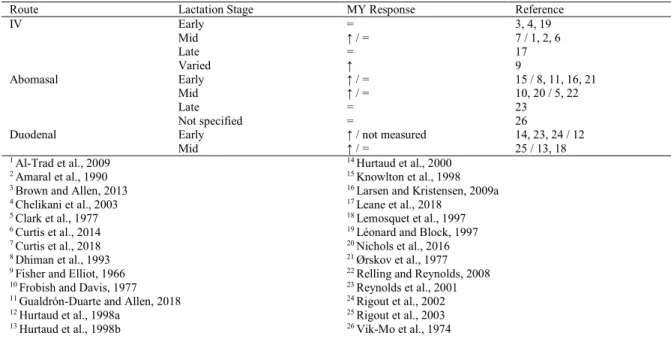
Table 3. Milk yield responses to glucose infusion
Route Lactation Stage MY Response Reference
IV Early = 3, 4, 19 Mid ↑ / = 7 / 1, 2, 6 Late = 17 Varied ↑ 9 Abomasal Early ↑ / = 15 / 8, 11, 16, 21 Mid ↑ / = 10, 20 / 5, 22 Late = 23 Not specified = 26
Duodenal Early ↑ / not measured 14, 23, 24 / 12
Mid ↑ / = 25 / 13, 18
1 Al-Trad et al., 2009 2 Amaral et al., 1990 3 Brown and Allen, 2013 4 Chelikani et al., 2003 5 Clark et al., 1977 6 Curtis et al., 2014 7 Curtis et al., 2018 8 Dhiman et al., 1993 9 Fisher and Elliot, 1966 10 Frobish and Davis, 1977 11 Gualdrón-Duarte and Allen, 2018 12 Hurtaud et al., 1998a
13 Hurtaud et al., 1998b
14 Hurtaud et al., 2000 15 Knowlton et al., 1998 16 Larsen and Kristensen, 2009a 17 Leane et al., 2018
18 Lemosquet et al., 1997 19 Léonard and Block, 1997 20 Nichols et al., 2016 21 Ørskov et al., 1977 22 Relling and Reynolds, 2008 23 Reynolds et al., 2001 24 Rigout et al., 2002 25 Rigout et al., 2003 26 Vik-Mo et al., 1974
Table 4. Dry matter intake responses to glucose infusion
Route Lactation Stage MY Response Reference
IV Early = 3, 4, 19 Mid ↑ / = 6 / 1, 2, 7 Late = 17 Varied = 9 Abomasal Early = / ↓ 11, 21 / 8, 15, 16 Mid = / ↓ 5, 10, 22 / 20 Late = 23 Not specified = 26 Duodenal Early = / ↓ 23, 12 / 14, 24 Mid = / ↑ 13, 18 / 25 1 Al-Trad et al., 2009 2 Amaral et al., 1990 3 Brown and Allen, 2013 4 Chelikani et al., 2003 5 Clark et al., 1977 6 Curtis et al., 2014 7 Curtis et al., 2018 8 Dhiman et al., 1993 9 Fisher and Elliot, 1966 10 Frobish and Davis, 1977 11 Gualdrón-Duarte and Allen, 2018 12 Hurtaud et al., 1998a
13 Hurtaud et al., 1998b
14 Hurtaud et al., 2000 15 Knowlton et al., 1998 16 Larsen and Kristensen, 2009a 17 Leane et al., 2018
18 Lemosquet et al., 1997 19 Léonard and Block, 1997 20 Nichols et al., 2016 21 Ørskov et al., 1977 22 Relling and Reynolds, 2008 23 Reynolds et al., 2001 24 Rigout et al., 2002 25 Rigout et al., 2003 26 Vik-Mo et al., 1974
References
Abaker, J. A., T. L. Xu, D. Jin, G. J. Chang, K. Zhang, and X. Z. Shen. 2017. Lipopolysaccharide derived from the digestive tract provokes oxidative stress in the liver of dairy cows fed a high-grain diet. J. Dairy Sci. 100:666-678.
Abe, N., I. J. Lean, A. R. Rabiee, J. Porter, and C. Graham. 1994. Effects of sodium monensin on reproductive performance of dairy cattle. Effects on metabolites in plasma, resumption of ovarian cyclicity and oestrus in lactating cows. Aust. Vet. J. 71:277-282. Abuajamieh, M., S. K. Kvidera, M. V. Sanz Fernandez, A. Nayeri, N. C. Upah, E. A. Nolan, S. M. Lei, J. M. DeFrain, H. B. Green, K. M. Schoenberg, W. E. Trout, and L. H. Baumgard. 2016. Inflammatory biomarkers are associated with ketosis in periparturient Holstein cows. Res. Vet. Sci. 12:359-365.
Afzalzadeh, A., M. H. Palizdar, H. Mahmoudzadeh, and A. Niasari-Naslaji. 2010. Effect of fat supplementation during transition period on plasma leptin and non-esterified fatty acid concentrations in Holstein cows. Anim. Sci. J. 81:309-315.
Agnew, R. E., and T. Yan. 2000. Impact of recent research on energy feeding systems for dairy cattle. Livest. Prod. Sci. 66:197-215.
Al-Trad, B., K. Reisberg, T. Wittek, G. B. Penner, A. Alkaassem, G. Gäbel, M. Fürll, and J. R. Aschenbach. 2009. Increasing intravenous infusions of glucose improve body condition but not lactation performance in midlactation dairy cows. J. Dairy Sci. 92:5645-5658.
Allen, M. S. 1997. Relationship between fermentation acid production in the rumen and the requirement for physically effective fiber. J. Dairy Sci. 80:1447-1462.
Amaral, D. M., J. J. Veenhuizen, J. K. Drackley, M. H. Cooley, A. D. McGilliard, and J. W. Young. 1990. Metabolism of propionate, glucose, and carbon dioxide as affected by exogenous glucose in dairy cows at energy equilibrium. J. Dairy Sci. 73:1244-1254. Andersen, P. H. 2003. Bovine endotoxicosis--some aspects of relevance to production
diseases. A review. Acta. Vet. Scand. 98:141-155.
Andersen, P. H., M. Hesselholt, and N. Jarløv. 1994. Endotoxin and arachidonic acid metabolites in portal, hepatic and arterial blood of cattle with acute ruminal acidosis. Acta Vet. Scand. 35:223-234.
Andersen, J. B., C. Ridder, and T. Larsen. 2008. Priming the cow for mobilization in the periparturient period: Effects of supplementing the dry cow with saturated fat or linseed. J. Dairy Sci. 91:1029-1043.
Andrew, S. M., D. R. Waldo, and R. A. Erdman. 1994. Direct analysis of body composition of dairy cows at three physiological stages. J. Dairy Sci. 77:3022-3033.
Armentano, L. E., and J. W. Young. 1983. Production and metabolism of volatile fatty acids, glucose and CO2 in steers and the effects of monensin on volatile fatty acid kinetics. J. Nutr. 113:1265-1277.
Armstrong, D. A., K. L. Blaxter, and N. M. Graham. 1960. Fat synthesis from glucose by sheep. Proc. Nutr. Soc. 19:31-32.
Aschenbach, J. R., N. B. Kristensen, S. S. Donkin, H. M. Hammon, and G. B. Penner. 2010. Gluconeogenesis in dairy cows: the secret of making sweet milk from sour dough. IUBMB Life. 62:869-877.
Asimov, G. J., and N. K. Krouze. 1937. The lactogenic preparations from the anterior pituitary and the increase of milk yield in cows. J. Dairy Sci. 20:289-306.
Barb, C. R., X. Yan, M. J. Azain, R. R. Kraeling, G. B. Rampacek, and T. G. Ramsey. 1998. Recombinant porcine leptin reduces feed intake and stimulates growth hormone secretion in swine. Domest. Anim. Endocrinol. 15:77-86.
Bauman, D. E. 1999. Bovine somatotropin and lactation: From basic science to commercial application. Domes. Anim. Endocrinol. 17:101-116.
Bauman, D. E. 2000. Regulation of nutrient partitioning during lactation: homeostasis and homeorhesis revisited. Pages 311-327 in Ruminant Physiology: Digestion, Metabolism, Growth, and Reproduction. P. B. Cronje, ed. CAB Publishing, New York, NY.
Bauman, D. E., and W. B. Currie. 1980. Partitioning of nutrients during pregnancy and lactation: A review of mechanisms involving homeostasis and homeorhesis. J. Dairy Sci. 63:1514-1529.
Bauman, D. E., and J. M. Elliot. 1983. Control of nutrient partitioning in lactating ruminants. Pages 437-468 in Biochemistry of Lactation. T. B. Mepham, ed. Elsevier Science Publishers B. V., Amsterdam, the Netherlands.
Baumgard, L. H., R. J. Collier, and D. E. Bauman. 2017. A 100-year review: Regulation of nutrient partitioning to support lactation. J. Dairy Sci. 100:10353-10366.
Beever, D. E., A. J. Hattan, C. K. Reynolds, and S. B. Cammell. 1999. Nutrient supply to high-yielding dairy cows. Pages 119-131 in Fertility in the High-Producing Dairy Cow. M. G. Diskin, ed. Occasional Publication No. 26. Br. Soc. Anim. Sci., Midlothian, UK. Bell, A. W. 1979. Lipid metabolism in liver and selected tissues and in the whole body of
ruminant animals. Prog. Lipid Res. 18:117-164.
Bell, A. W. 1995. Regulation of organic nutrient metabolism during transition from late pregnancy to early lactation. J. Anim. Sci. 73:265-278.
Bell, A. W., and D. E. Bauman. 1997. Adaptations of glucose metabolism during pregnancy and lactation. J. Mammary Gland Biol. Neoplasia. 2:2804-2819.
Bell, A. W., W. S. Burhans, and T. R. Overton. 2000. Protein nutrition in late pregnancy, maternal protein reserves and lactation performance in dairy cows. Proc. Nutr. Soc. 59:119-126.
Bertics, S. J., R. R. Grummer, C. Cadorniga-Valino, and E. E. Stoddard. 1992. Effect of prepartum dry matter intake on liver triglyceride concentration and early lactation. J. Dairy Sci. 75:1914-1922.
Block, S. S., W. R. Butler, R. A. Ehrhardt, A. W. Bell, M. Van Amburgh, and Y. Boisclair. 2001. Decreased concentration of plasma leptin in periparturient dairy cows is caused by negative energy balance. J. Endocrin. 171:339-348.
Bobe, G., B. N. Ametaj, J. W. Young, and D. C. Beitz. 2003. Potential treatment of fatty liver with 14-day subcutaneous injections of glucagon. J. Dairy Sci. 86:3138-3147.
Bobe, G., J. C. Velez, D. C. Beitz, S. S. Donkin. 2009. Glucagon increases hepatic mRNA concentrations of ureagenic and gluconeogenic enzymes in early-lactation dairy cows. J. Dairy Sci. 92:5092-5099.
Bobe, G., J. W. Young, and D. C. Beitz. 2004. Invited review: Pathology, etiology, prevention, and treatment of fatty liver in dairy cows. J. Dairy Sci. 87:3105-3124.
Bradford, B. J., K. Yuan, J. K. Farney, L. K. Mamedova, and A. J. Carpenter. 2015. Invited review: Inflammation during the transition to lactation: New adventures with an old flame. J. Dairy Sci. 98:6631-6650.
Brockman, R. P., E. N. Bergman, P. K. Joo, and J. G. Manns. 1975. Effects of glucagon and insulin on net hepatic metabolism of glucose precursors in sheep. Am. J. Physiol. 229:1344-1349.
Brown, W. E., and M. S. Allen. 2013. Effects of intrajugular glucose infusion on feed intake, milk yield, and metabolic responses of early postpartum cows fed diets varying in protein and starch concentration. J. Dairy Sci. 96:7132-7142.
Calder, P. C., G. Dimitriadis, and P. Newsholme. 2007. Glucose metabolism in lymphoid and inflammatory cells and tissues. Curr. Opin. Clin. Nutr. Metab. Care 10:531-540. Campfield, L. A., F. J. Smith, Y. Guisez, R. Devos, and P. Burn. 1995. Recombinant mouse
OB protein: evidence for a peripheral signal linking adiposity and central neural networks. Science 269:546-549.
Cant, J. P., D. R. Trout, F. Qiao, and N. F. Purdie. 2002. Milk synthetic response of the bovine mammary gland to an increase in the local concentration of arterial glucose. J. Dairy Sci. 85:494-503.
Carpenter, A. J., C. M. Ylioja, L. K. Mamedova, K. E. Olagaray, and B. J. Bradford. 2018. Effects of early postpartum sodium salicylate treatment on long-term milk, intake, and blood parameters of dairy cows. J. Dairy Sci. 101:1437-1447.
Castañeda-Gutiérrez, E., T. R. Overton, W. R. Butler, and D. E. Bauman. 2005. Dietary supplements of two doses of calcium salts of conjugated linoleic acid during the transition period and early lactation. J. Dairy Sci. 88:1078-1089.
Ceciliani, F., J. J. Ceron, P. D. Eckersall, and H. Sauerwein. 2012. Acute phase proteins in ruminants. J. Proteomics 75:4207-4231.
Chakrabarti, P., J. Y. Kim, M. Singh, Y. K. Shin, J. Kim, J. Kumbrink, and K. V. Kandror. 2013. Insulin inhibits lipolysis in adipocytes via the evolutionarily conserved mTORC1-Egr1-ATGL-mediated pathway. Mol. Cell. Bio. 33:3659-3666.
Chelikani, P. K., D. H. Keisler, and J. J. Kennelly. 2003. Response of plasma leptin concentration to jugular infusion of glucose or lipid is dependent on the stage of lactation of Holstein cows. J. Nutr. 133:4163-4171.
Chilliard, Y. 1993. Dietary fat and adipose tissue metabolism in ruminants, pigs and rodents: a review. J. Dairy Sci. 76:3897-3927.
Chung, Y. H., I. D. Girard, and G. A. Varga. 2009. Effects of feeding dry propylene glycol to early postpartum Holstein dairy cows on production and blood parameters. The Animal Consortium. 3:1368-1377.
Clark, J. H., H. R. Spires, R. G. Derrig, and M. R. Bennink. 1977. Milk production, nitrogen utilization and glucose synthesis in lactating cows infused postruminally with sodium caseinate and glucose. J. Nutr. 107:631-644.
Considine, R. V., M. K. Sinha, M. L. Heiman, A. Kriauciunas, T. W. Stephens, M. R. Nyce, J. P. Ohannesian, C. C. Marco, L. J. McKee, T. L. Bauer, and J. F. Caro. 1996. Serum immunoreactive-leptin concentrations in normal-weight and obese humans. N. Engl. J. Med. 334:292-295.
Coombe, V. B., and R. C. Siddons. 1973. Carbohydrates of the bovine small intestine. Br. J. Nutr. 30:269-276.
Coppock, C. E., C. H. Noller, S. A. Wolfe, C. J. Callahan, and J. S. Baker. 1972. Effect of forage-concentrate ratio in complete feeds fed ad libitum on feed intake prepartum and the occurrence of abomasal displacement in dairy cows. J. Dairy Sci. 55:783-789. Curtis, R. V., J. J. M. Kim, D. L. Bajramaj, J. Doelman, V. R. Osborne, and J. P. Cant. 2014.
Decline in mammary translational capacity during intravenous glucose infusion into lactating dairy cows. J. Dairy Sci. 97:430-438.
Curtis, R. V., J. J. M. Kim, J. Doelman, and J. P. Cant. 2018. Maintenance of plasma branched-chain amino acid concentrations during glucose infusion directs essential amino acids to extra-mammary tissues in lactating dairy cows. J. Dairy Sci. 101:4542-4553.
Dantzer, R., and K. W. Kelley. 2007. Twenty years of research on cytokine-induced sickness behavior. Brain Behav. Immun. 21:153-160.
Dhiman, T. R., C. Cadorniga, and L. D. Satter. 1993. Protein and energy supplementation of high alfalfa silage diets during early lactation. J. Dairy Sci. 76:1945-1959.
Dijkhuizen, A. A., and R. S. Morris. 1997. Animal Health Economics: Principles and Applications. University of Sydney, Post-Graduate Foundation in Veterinary Science. Purdue University Press, West Lafayette, IN.
DiSilvestro, R. A. 1986. Plasma levels of immunoreactive ceruloplasmin and other acute phase proteins during lactation. Proc. Soc. Exp. Biol. Med. 183:257-261.