State Individual Income Tax Comparisons for 2012
South Carolina Revenue and Fiscal Affairs Office
Frank A. Rainwater
Executive Director
Gordon O. Shuford
Economic Research
State Individual Income Tax Comparisons for 2012
SC Revenue and Fiscal Affairs Office
Page 1
State Individual Income Tax Comparisons for 2012
Findings
•
The average South Carolina tax return reported $49,802 in federal adjusted gross income in
2012, equaling 79.5% of the national average of $62,645. See Table 1.
•
In 2012, 81.5% of South Carolina taxpayers reported federal adjusted income of less than
$50,000. Internal Revenue Service data report that only five states had a higher percentage
of taxpayers in this income range. See Figure 2.
•
We calculate South Carolina’s average effective tax rate for 2012 at 2.99%. This effective
rate is calculated using state and local income tax collections divided by federal adjusted
gross income and ranks South Carolina thirty-second of the forty-one states imposing an
individual income tax. Only nine states’ tax collections are a smaller percentage of their
federal adjusted gross income compared to South Carolina. See Figure 4.
•
The varying amounts of standard deductions and personal exemptions allowed by the
states are one reason for South Carolina’s comparatively low average effective tax rate. For
2014, a family of four filing a joint return in South Carolina is allowed a $12,400 standard
deduction and four $3,950 personal exemptions. In addition, the first $2,880 is not taxed in
South Carolina, resulting in a total of $31,080 not subject to tax. These deductions are the
third highest nationwide. See Figures 5 and 6.
•
Tax rates are a second major factor impacting tax liabilities. Twelve states impose a
marginal tax rate that exceeds South Carolina’s 7% top rate. One state, Arkansas, imposes
the same 7% top tax rate. All thirteen of these states have a higher effective tax rate than
South Carolina. See Table 2.
•
Of the twenty-seven states with a maximum marginal rate below South Carolina’s, eighteen
have a higher effective tax rate. South Carolina’s higher standard deductions and personal
exemptions more than offset the benefits of the lower maximum marginal tax rates in the
nineteen states. See Table 3.
•
Standard comparisons ranking state and local individual income tax revenue by population
and as a percentage of personal income support the finding that South Carolina has a
relatively low state income tax burden. On average, South Carolina residents paid $656 in
individual income tax per person in tax year 2012, which ranks South Carolina thirty-fifth
out of the 41 states. State and local income tax revenue as a percentage of personal income
for tax year 2012 amounts to 1.9% of total personal income, which ranks the state
thirty-fourth. See Tables 5 and 6.
State Individual Income Tax Comparisons for 2012
SC Revenue and Fiscal Affairs Office
Page 2
State Individual Income Tax Comparisons for 2012
Purpose
This updated report compares South Carolina’s income tax system to the forty
other states that also impose this tax. This is the latest report in the series that began in
2005 that computes an average effective income tax rate for each state using census data
on state and local income tax collections and federal adjusted gross income (AGI) from
the Internal Revenue Service.
South Carolina and forty other states impose an individual income tax. Two
more states, New Hampshire and Tennessee, tax only dividend and interest income.
Seven states, Alaska, Florida, Nevada, South Dakota, Texas, Washington, and
Wyoming, do not impose an individual income tax. This report compares the South
Carolina income tax system to the other forty states for three major categories. First, we
analyze our taxpayers’ distribution of income relative to other states. We then compare
actual state income tax collections to federal AGI to calculate an average effective tax
rate for each state. This measure of taxpayer burden indicates that South Carolina’s
2.99% average effective individual income tax rate ranks the state thirty-second.
Finally, we compare the average effective tax rate rankings to standard per capita and
percentage of income measures of income tax burden. Our findings, consistent with
previous reports, suggest that South Carolina taxpayers have lower income compared
to other states based on federal AGI comparisons and have a relatively low state income
tax burden, the tenth lowest of the forty-one states for tax year 2012. The data and
analysis supporting these findings are discussed below.
Income Distribution Comparison
This report analyzes the distribution of income across the states, a major
determinate of the magnitude of state revenue collections. As seen in Table 1, the
average South Carolina tax return reported $49,802 in federal AGI per return in 2012
compared to the national average of $62,645
1. South Carolina’s average AGI comprises
79.5% of the United States average and ranks South Carolina forty-fifth out of the 50
states. Only five states report a lower federal AGI per return than South Carolina.
1
Information on 2012 federal income, deductions, exemptions, and taxpayer liabilities for each
state were obtained from the Statistics of Income Division of the Internal Revenue Service at
http://www.irs.gov/uac/SOI-Tax-Stats-Historic-Table-2.
State Individual Income Tax Comparisons for 2012
SC Revenue and Fiscal Affairs Office
Page 3
South Carolina taxpayers report considerably less salary and wages, interest and
dividends, business or professional net income, partnership or S-corporation income,
and net capital gain income per return than the average nationwide. However, South
Carolina tax returns do report higher than average individual retirement distributions,
pensions, and social security benefits.
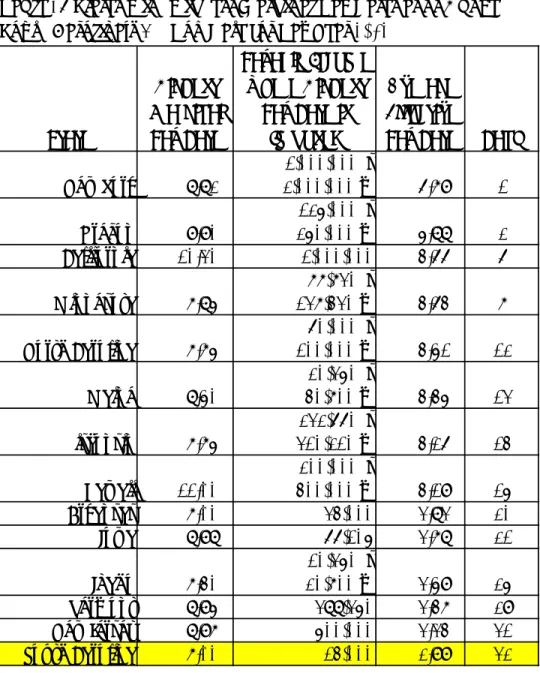
Table 1:
Major Components of US and SC Federal Adjusted Gross Income for Tax Year 2012
AVERAGE PER RETURN
UNITED STATES SOUTH CAROLINA SC Percentage of US
Adjusted gross income (AGI) $62,645 $49,802 79.5%
Rank (1 is highest) 45
Salaries and wages in AGI $43,463 $35,245 81.1% State Rank (1 is highest) 44
Taxable interest $768 $430 56.0%
State Rank (1 is highest) 48
Ordinary dividends $1,769 $1,187 67.1%
State Rank (1 is highest) 39
Qualified dividends $1,385 $942 68.0%
State Rank (1 is highest) 39
Business or profession net income $2,134 $1,409 66.0% State Rank (1 is highest) 48
Net capital gain (less loss) in AGI $4,208 $2,132 50.7% State Rank (1 is highest) 42
Taxable individual retirement distributions $1,588 $1,627 102.5% State Rank (1 is highest) 17
Taxable pensions and annuities in AGI $4,171 $4,539 108.8% State Rank (1 is highest) 13
Unemployment compensation $486 $346 71.2%
State Rank (1 is highest) 34
Taxable social security benefits in AGI $1,530 $1,717 112.2% State Rank (1 is highest) 12
Partnership/S-corp net income (less loss) $3,690 $2,263 61.3% State Rank (1 is highest) 44
Individual retirement arrangement payments $78 $61 77.6% State Rank (1 is highest) 45
Taxable income $44,089 $32,475 73.7%
State Rank (1 is highest) 47
Total tax liability $8,619 $5,724 66.4%
State Rank (1 is highest) 46
SOURCE: IRS, Statistics of Income Division, Individual Master File System, December 2013. Calculations by the South Carolina Revenue and Fiscal Affairs Office.
State Individual Income Tax Comparisons for 2012
SC Revenue and Fiscal Affairs Office
Page 4
After standard or itemized deductions and personal exemptions, South Carolina
taxpayers reported an average of $32,475 in federal taxable income and remitted an
average of $5,724 in federal taxes per return for 2012. These average taxable income and
tax liability amounts rank South Carolina taxpayers forty-seventh and forty-sixth,
respectively in the nation for 2012.
2As a consequence of the lower than average income
components, South Carolina’s taxable income comprises only 73.7% of US average
taxable income and 66.4% of the average US federal tax liability. As seen in Figure 1,
South Carolina’s $5,724 average federal tax liability is ranked 46
thwith only four states
with a lower average federal tax liability. For all figures in this report, the southeastern
states are indicated by red bars, the US average is indicated by a dark green bar, and
South Carolina is highlighted by a blue bar.
Source: Internal Revenue Service, Statistics of Income Division, Individual Master File System, December 2013. Calculations by the South Carolina Revenue and Fiscal Affairs Office.
2
Tax liabilities include tax recaptured from prior-year credits. The amount of recaptured tax
will vary each year and result in the small difference in the state rankings for taxable income
and income tax liabilities.
State Individual Income Tax Comparisons for 2012
SC Revenue and Fiscal Affairs Office
Page 5
Detailed comparisons to all fifty states’ average federal adjusted gross income
components for 2012, the latest available data published by the Internal Revenue
Service, are presented in Appendix Table 1. Details on the average salary and wages,
dividends, business income, capital gains, retirement income, unemployment
compensation, and taxes paid by state per return along with state rankings for each
category are presented.
In addition, the distribution of income reported on federal tax returns indicates
that 81.5% of all South Carolina tax returns reported adjusted gross incomes below
$50,000 in 2012. See Figure 2. This ranks South Carolina sixth highest in the percentage
of taxpayers reporting less than $50,000 of AGI. Only five other states reported a higher
percentage of returns in this income category. The state with the lowest percentage of
tax returns with less than $50,000 of AGI was Delaware at 61.5%. These percentages
compare to the national average of 77.2% percent of returns with less than $50,000 of
AGI.
Source: Internal Revenue Service, Statistics of Income Division, Individual Master File System, December 2013. Calculations by the South Carolina Revenue and Fiscal Affairs Office.
State Individual Income Tax Comparisons for 2012
SC Revenue and Fiscal Affairs Office
Page 6
Conversely, the state with the highest percentage of tax returns with AGI’s
exceeding $200,000 in 2012 was Delaware at 15%. As shown in Figure 3, this
comparison greatly exceeds the 2.3% of South Carolina returns with AGI exceeding
$200,000. Only nine other states reported a lower percentage of returns with AGI
exceeding $200,000 than South Carolina. In summary, these comparisons of federal
AGI components and income distributions per return reflect that South Carolina
taxpayers have lower incomes than the national average.
Source: Internal Revenue Service, Statistics of Income Division, Individual Master File System, December 2013. Calculations by the South Carolina Revenue and Fiscal Affairs Office.
Average Effective Tax Rate Comparison
We then compare actual state individual income tax collections from FY 2011-12
to federal AGI from 2012 to determine an average effective tax rate for each state. This
State Individual Income Tax Comparisons for 2012
SC Revenue and Fiscal Affairs Office
Page 7
percentage reported in Figure 4 and in Appendix Table 2 is calculated as the amount of
state and local income tax revenue as a percentage of federal adjusted gross income.
South Carolina’s individual income tax collections of $3,096,834,000 in FY 2011-12, as
reported by the US Census Bureau, divided by the state’s $103,453,955,000 in total
federal adjusted gross income, as reported by the Internal Revenue Service, results in a
2.99% average effective tax rate. This ranks South Carolina thirty-second of the
forty-one states imposing an individual income tax. This calculation indicates that only nine
states’ individual income tax collections represent a smaller burden on their taxpayers
than South Carolina’s 2.99% average effective tax rate. The highest average effective tax
rate was 6.79% in New York and the lowest was North Dakota at 1.72%.
Sources: State and Local Government Finances by Level of Government and by State: 2012, US Census Bureau and Internal Revenue Service, Statistics of Income Division, Individual Master File System, December 2013. Calculations by the South Carolina Revenue and Fiscal Affairs Office.
State Individual Income Tax Comparisons for 2012
SC Revenue and Fiscal Affairs Office
Page 8
Subtractions from AGI and Effective Tax Rates. Most states’ tax systems are
based on federal adjusted gross income or federal taxable income. Also most states, like
South Carolina, allow taxpayers to subtract itemized or standard deductions and
personal exemptions to determine taxable income. Through comparing the deductions,
exemptions, and tax rates imposed by the other states, we determined that one
important reason why South Carolina’s average effective tax rate is relatively low is the
substantial amount of the standard deductions and personal exemptions allowed by the
state. These subtractions from AGI greatly impact final tax liabilities, and South
Carolina’s standard deductions and personal exemptions are among the highest in the
nation.
Source: Information on deductions, exemptions, and tax brackets for each state were obtained from 2014 state tax forms.
For example, a South Carolina family filing a joint return with two children in tax
year 2014 is allowed a $12,400 standard deduction and four $3,950 personal exemptions.
State Individual Income Tax Comparisons for 2012
SC Revenue and Fiscal Affairs Office
Page 9
In addition, the first $2,880 of taxable income is not subject to tax. Combining the
standard deduction, personal exemptions, and zero tax bracket results in a $31,080
reduction from AGI for this typical family. As seen in Figure 5, this is the third largest
reduction allowed nationwide in 2014 and is much higher than the national average of
$17,616. This figure may also overstate the gross income deductions for states that limit
their personal exemptions or standard deductions for taxpayers at with AGI that exceed
a state specific threshold. For example, Alabama’s personal exemption of $1,000 for
taxpayers with state AGI of $20,000 or less is reduced to $500 for taxpayers above
$20,000 but below $100,000. The Alabama personal exemption is further reduced to
$300 for taxpayers with AGI over $100,000. Other states that limit personal exemptions
or standard deductions include Hawaii, Maryland, Montana, Oregon, Rhode Island,
Utah, and Wisconsin.
Source: South Carolina individual income tax form. Calculations by the South Carolina Revenue and Fiscal Affairs Office.
State Individual Income Tax Comparisons for 2012
SC Revenue and Fiscal Affairs Office
Page 10
Figure 6 highlights these South Carolina specific subtractions and shows the
maximum tax paid on any additional taxable income for a family of four. Until $31,080
in gross income is exceeded, this family would pay no South Carolina income tax. For
any additional income, the next $2,880, or
$33,960 in total income, results in a maximum
tax of $86. The next additional $2,880 in income is taxed at 4% and results in a
maximum tax of $202. Only when this family’s income reaches $42,600 will the 7%
maximum tax rate apply. The family’s tax liability at this point is $518 plus 7% of all
income above the $42,600 threshold.
Table 2: States with Highest Marginal Tax Rates at or Above
South Carolina’s 7% Top Rate for Tax Year 2012
State
Highest
Marginal
Tax Rate
Taxable Income
where Highest
Tax Rate is
Imposed
Average
Effective
Tax Rate Rank
New York
8.82%
$1,000,000 s
$2,000,000 m
6.79%
1
Oregon
9.90%
$250,000 m
$125,000 s
5.88%
2
California
10.30%
$1,000,000
4.66%
6
Minnesota
7.85%
$77,730 s
$137,430 m
4.64%
7
North Carolina
7.75%
$100,000 m
$60,000 s
4.51%
12
Maine
8.50%
$40,700 m
$20,350 s
4.45%
13
Wisconsin
7.75%
$232,660 s
$310,210 m
4.26%
14
Hawaii
11.00%
$400,000 m
$200,000 s
4.19%
15
Arkansas
7.00%
$34,000
3.83%
20
Iowa
8.98%
$66,105
3.78%
21
Idaho
7.40%
$20,700 m
$10,350 s
3.59%
25
Vermont
8.95%
$388,350
3.47%
29
New Jersey
8.97%
$500,000
3.34%
31
South Carolina
7.00%
$14,000
2.99%
32
Source: Tax rate and brackets for each state were obtained from 2012 state tax
forms. Data compiled by the South Carolina Revenue and Fiscal Affairs Office.
State Individual Income Tax Comparisons for 2012
SC Revenue and Fiscal Affairs Office
Page 11
Tax Rates. The tax rates imposed by states also help determine taxpayer liability
and effective tax rates. The states with the highest marginal rates are listed in Table 2
above and are ranked by average effective tax rate. Even though South Carolina
imposes a 7% top marginal rate, the state’s average effective tax rate of 2.99% suggests
that the overall individual income tax burden is not reflective of the top marginal rate.
A total of twelve states impose a maximum marginal rate that exceeds South
Carolina’s 7% top marginal rate, and Arkansas has the same 7% top rate as South
Carolina. All of these states, including Arkansas, have a higher effective tax rate than
South Carolina’s 2.99%. We found that Hawaii and California impose the highest
marginal tax rates among the forty-one states at 11% and 10.3%, respectively. Hawaii’s
top rate is imposed on taxable income above $200,000 for single taxpayers and $400,000
for joint filers. California’s top rate applies to income above $1,000,000 for all taxpayers.
However, it is not the case that all states with marginal tax rates lower than
South Carolina’s top 7% bracket impose a smaller income tax burden on their taxpayers.
Twenty-seven states impose a maximum marginal rate that is lower than South
Carolina’s top rate. These states listed in Table 3 below are ranked by their average
effective tax rates. Eighteen of these states have a higher effective tax rate than South
Carolina, even with top marginal rates that are lower than South Carolina’s highest
marginal rate of 7%. For example, Kentucky’s highest marginal rate is 6%, and that tax
rate applies to taxable income above $75,000. However, Kentucky’s standard
deductions and personal exemptions are considerably lower compared to South
Carolina. See Figure 5. This results in a 4.97% average effective tax rate, ranked fourth
nationwide compared to South Carolina’s thirty-second ranking. In general, South
Carolina’s relatively low tax burden compared to other states, even with a higher top
marginal rate, occurs because of differences in the personal exemptions, standard
deductions, and tax bracket income ranges implemented by the states. As discussed
earlier, our high standard deductions and personal exemptions allow South Carolina
taxpayers to avoid paying tax on a significant portion of their gross incomes.
Another contributing factor is the taxable income amount at which the maximum
tax rate is imposed. For example, Georgia taxpayers pay the top rate of 6% beginning at
$7,000 of taxable income for single filers and $10,000 for married taxpayers. Georgia’s
tax bracket structure and their lower standard deductions and personal exemptions
result in a much higher average effective tax rate than South Carolina despite their 1%
lower top marginal tax rate.
State Individual Income Tax Comparisons for 2012
SC Revenue and Fiscal Affairs Office
Page 12
Table 3: States with Highest Marginal Tax Rates Below
South Carolina’s 7% Top Rate for Tax Year 2012
State
Highest
Marginal
Tax Rate
Taxable Income
where Highest Tax
Rate is Imposed
Average
Effective
Tax Rate
Rank
Maryland 5.75% $300,000 m$250,000 s 5.62% 3 Kentucky 6.00% $75,000 4.97% 4 Delaware 6.75% $60,000 4.83% 5 Connecticut 6.70% $250,000 s$500,000 m 4.63% 8 West Virginia 6.50% $60,000 4.61% 9 Massachusetts 5.25% $1 4.59% 10 Ohio 5.93% $204,200 4.52% 11 Indiana 3.40% $1 3.87% 16 Pennsylvania 3.07% $1 3.86% 17 Illinois 5.00% $1 3.85% 18 Virginia 5.75% $17,000 3.84% 19 Missouri 6.00% $9,000 3.67% 22 Kansas 6.45% $30,000 s $60,000 m 3.67% 23 Utah 5.00% $1 3.60% 24 Montana 6.90% $16,000 3.57% 26 Rhode Island 5.99% $129,900 3.56% 27 Nebraska 6.84% $27,000 s $54,000 m 3.54% 28 Georgia 6.00% $7,000 s $10,000 m 3.46% 30 South Carolina 7.00% $14,000 2.99% 32 Alabama 5.00% $6,000 m$3,000 s 2.99% 33 Oklahoma 5.25% $15,000 m$8,700 s 2.97% 34 Colorado 4.63% $1 2.96% 35 Michigan 4.35% $1 2.90% 36 Mississippi 5.00% $10,000 2.68% 37 New Mexico 4.90% $24,000 m$16,000 s 2.61% 38 Louisiana 6.00% $100,000 m$50,000 s 2.24% 39 Arizona 4.54% $300,000 m$150,000 s 2.04% 40 North Dakota 3.99% $388,350 1.72% 41
Source: Tax rate and brackets for each state were obtained from 2012 state tax forms. Data compiled by the South Carolina Revenue and Fiscal Affairs Office.
State Individual Income Tax Comparisons for 2012
SC Revenue and Fiscal Affairs Office
Page 13
South Carolina’s average effective tax rate is lower than five of the seven states
that impose a flat tax at rates well below South Carolina’s highest marginal rate of 7%.
See Table 4 below. Colorado imposes a 4.63% flat tax on taxable income, but its average
effective tax rate is 2.96%, which ranks them thirty-fifth nationwide. This low average
effective tax rate is partially the result of relatively high standard deductions and
personal exemptions that are just slightly below the amounts allowed by South
Carolina. See Figure 5. Flat tax states, including Massachusetts at 5.25%, Indiana at
3.4%, Pennsylvania at 3.07%, Illinois at 5%, and Utah at 5%, all have average effective
tax rates higher than South Carolina, while imposing a flat rate well below South
Carolina’s highest marginal rate of 7%.
Table 4: States with Flat Tax Rates and South Carolina for Tax Year 2012
Per Capita and Percentage of Personal Income Comparisons
This report’s major finding that South Carolina has
a relatively low state income
tax burden is supported by standard comparisons ranking state and local individual
income tax revenue by population and as a percentage of personal income rankings.
These comparisons in the two tables below report similar results to the average effective
tax rate calculations in this report. Table 5 shows that, on average, South Carolina
residents paid $656 in individual income tax per person in tax year 2012. This income
tax burden ranks South Carolina thirty-fifth out of the 41 states with only six states
reporting a lower per person tax burden. Table 6 reports state and local income tax
revenue as a percentage of personal income for tax year 2012. South Carolina
taxpayers’ individual income taxes amount to 1.9% of total personal income, which
ranks the state thirty-fourth.
State
Tax Rate
Taxable Income
where Highest Tax
Rate is Imposed
Average
Effective Tax
Rate
Rank
Massachusetts
5.25%
$1
4.59%
10
Indiana
3.40%
$1
3.87%
16
Pennsylvania
3.07%
$1
3.86%
17
Illinois
5.00%
$1
3.85%
18
Utah
5.00%
$1
3.60%
24
South Carolina
7.00%
$14,000
2.99%
32
Colorado
4.63%
$1
2.96%
35
Michigan
4.35%
$1
2.90%
36
Source: Tax rate and brackets for each state were obtained from 2012 state tax forms.
Data compiled by the South Carolina Revenue and Fiscal Affairs Office.
State Individual Income Tax Comparisons for 2012
SC Revenue and Fiscal Affairs Office
Page 14
Standard comparisons reporting per capita individual income tax revenue
collections or income tax collections as a percentage of total personal income are useful,
but can be misleading. One problem with per capita comparisons is that not everyone
pays individual income taxes, especially children who represent a large segment of the
population. Total personal income is overly comprehensive as an income measure. It
includes non-taxable transfers like Medicare, Medicaid, imputed income, and income
from nonprofit organizations that serve families. We focus on federal AGI for the
average effective tax rate comparisons because this measure of income is consistent
across all states and is more appropriate for income tax comparisons. However, all
measures consistently find that the South Carolina individual income tax burden is one
of the lowest in the nation compared to the forty-one states imposing this tax.
State Individual Income Tax Comparisons for 2012
SC Revenue and Fiscal Affairs Office
Page 15
1 New York 47,492,336 19,607,140 $ 2,422 2 Connecticut 7,371,189 3,594,362 $ 2,051 3 Maryland 11,477,575 5,891,819 $ 1,948 4 Massachusetts 11,954,838 6,655,829 $ 1,796 5 Oregon 5,826,002 3,898,684 $ 1,494 6 Minnesota 7,988,084 5,380,615 $ 1,485 7 California 55,024,435 38,062,780 $ 1,446 8 Delaware 1,248,596 916,881 $ 1,362 9 New Jersey 11,128,418 8,876,000 $ 1,254 10 Virginia 10,216,148 8,193,422 $ 1,247 11 Illinois 15,512,310 12,873,763 $ 1,205 12 Wisconsin 6,762,399 5,724,888 $ 1,181 13 Ohio 13,428,718 11,550,901 $ 1,163 14 Pennsylvania 14,312,266 12,770,043 $ 1,121 15 Hawaii 1,540,746 1,392,766 $ 1,106 16 Maine 1,441,926 1,328,592 $ 1,085 17 North Carolina 10,383,796 9,748,181 $ 1,065 18 Kentucky 4,637,599 4,383,465 $ 1,058 19 Rhode Island 1,080,801 1,052,637 $ 1,027 20 Iowa 3,126,638 3,075,935 $ 1,016 21 Kansas 2,893,587 2,885,966 $ 1,003 22 Nebraska 1,838,344 1,855,487 $ 991 23 Vermont 598,450 626,138 $ 956 24 West Virginia 1,755,746 1,856,313 $ 946 25 Colorado 4,875,627 5,191,709 $ 939 26 Indiana 6,097,513 6,537,632 $ 933 27 Missouri 5,452,827 6,025,281 $ 905 28 Montana 900,180 1,005,163 $ 896 29 Utah 2,466,495 2,855,194 $ 864 30 Georgia 8,142,371 9,919,000 $ 821 31 Arkansas 2,401,902 2,949,300 $ 814 32 Idaho 1,213,335 1,595,590 $ 760 33 Michigan 7,346,645 9,884,781 $ 743 34 Oklahoma 2,774,376 3,817,059 $ 727 35 South Carolina 3,096,834 4,722,621 $ 656 36 Alabama 3,118,392 4,817,484 $ 647 37 North Dakota 432,527 701,705 $ 616 38 New Mexico 1,150,468 2,084,594 $ 552 39 Louisiana 2,474,606 4,604,744 $ 537 40 Mississippi 1,501,267 2,986,137 $ 503 41 Arizona 3,093,904 6,556,236 $ 472
Sources: US Census Bureau, State and Local Government Finances by Level of Government and by State: 2012. US Census Bureau, Population Division, December 2014 (NST_EST2014_01).
Calculations by the South Carolina Revenue and Fiscal Affairs Office.
Table 5: Per Capital State and Local Individual Income Tax
Revenue for Tax Year 2012
(Numbers in Thousands)
State and Ranking
State and Local
Individual Income
Tax Revenue
State Population
Per Capita State and
Local Individual Income
State Individual Income Tax Comparisons for 2012
SC Revenue and Fiscal Affairs Office
Page 16
1 New York 47,492,336 1,059,053,137 4.5% 2 Oregon 5,826,002 153,097,493 3.8% 3 Maryland 11,477,575 315,775,620 3.6% 4 Connecticut 7,371,189 216,308,449 3.4% 5 Massachusetts 11,954,838 376,874,198 3.2% 6 Minnesota 7,988,084 254,870,154 3.1% 7 Delaware 1,248,596 40,378,899 3.1% 8 California 55,024,435 1,805,193,769 3.0% 9 Kentucky 4,637,599 157,043,042 3.0% 10 Ohio 13,428,718 464,780,129 2.9% 11 Wisconsin 6,762,399 243,147,894 2.8% 12 North Carolina 10,383,796 375,683,370 2.8% 13 Maine 1,441,926 52,957,962 2.7% 14 West Virginia 1,755,746 65,244,567 2.7% 15 Illinois 15,512,310 592,056,538 2.6% 16 Virginia 10,216,148 398,811,659 2.6% 17 Hawaii 1,540,746 61,967,663 2.5% 18 Pennsylvania 14,312,266 581,771,707 2.5% 19 Indiana 6,097,513 249,326,268 2.4% 20 Utah 2,466,495 102,464,241 2.4% 21 Kansas 2,893,587 125,167,639 2.3% 22 Iowa 3,126,638 135,345,650 2.3% 23 Montana 900,180 39,357,161 2.3% 24 New Jersey 11,128,418 487,127,416 2.3% 25 Missouri 5,452,827 240,578,337 2.3% 26 Arkansas 2,401,902 107,443,010 2.2% 27 Rhode Island 1,080,801 48,584,164 2.2% 28 Georgia 8,142,371 369,149,416 2.2% 29 Idaho 1,213,335 56,071,934 2.2% 30 Nebraska 1,838,344 85,187,389 2.2% 31 Vermont 598,450 27,818,999 2.2% 32 Colorado 4,875,627 240,349,703 2.0% 33 Michigan 7,346,645 381,314,253 1.9% 34 South Carolina 3,096,834 166,958,682 1.9% 35 Alabama 3,118,392 173,149,657 1.8% 36 Oklahoma 2,774,376 157,970,566 1.8% 37 New Mexico 1,150,468 74,601,613 1.5% 38 Mississippi 1,501,267 99,885,857 1.5% 39 Louisiana 2,474,606 186,923,116 1.3% 40 Arizona 3,093,904 239,929,270 1.3% 41 North Dakota 432,527 39,493,019 1.1%
Table 6: State and Local Individual Income Tax Revenue as a
Percentage of State Personal Income for Tax Year 2012
(Numbers in Thousands)
Sources: US Census Bureau, State and Local Government Finances by Level of Government and by State: 2012. US Department of Commerce, Bureau of Economic Analysis, 2012. Calculations by the South Carolina Revenue and Fiscal Affairs Office.
State and Ranking
State and Local
Individual Income
Tax Collections
State Personal
Income
Percentage of
State Personal
Income
State Individual Income Tax Comparisons for 2012
SC Revenue and Fiscal Affairs Office
Page 17
APPENDIX
Appendix Table 1:
Major Components of Federal Adjusted Gross Income by State
for Tax Year 2012
Pages 18 to 28
Appendix Table 2:
State Individual Income Average Effective Tax Rates
for Tax Year 2012
Appendix Page 18
Appendix Table 1:
[Money amounts, other than averages, are in thousands of dollars]
Selected Components of Income UNITED STATES ALABAMA ALASKA ARIZONA ARKANSAS
Number of returns 145,025,450 2,050,890 363,090 2,761,490 1,219,480 Adjusted gross income (AGI) $9,085,078,279 $104,270,067 $22,800,444 $151,832,947 $62,666,234 Average Per Return $62,645 $50,841 $62,796 $54,982 $51,388 Rank (1 is highest) 44 16 31 42 Salaries and wages in AGI $6,303,276,607 $75,331,835 $16,194,484 $107,962,804 $42,706,506 Average Per Return $43,463 $36,731 $44,602 $39,096 $35,020 State Rank (1 is highest) 39 14 26 45 Taxable interest $111,370,731 $1,027,014 $180,434 $1,800,300 $672,486 Average Per Return $768 $501 $497 $652 $551 State Rank (1 is highest) 41 42 25 35 Ordinary dividends $256,489,955 $1,763,154 $447,686 $3,772,468 $3,759,899 Average Per Return $1,769 $860 $1,233 $1,366 $3,083 State Rank (1 is highest) 48 36 28 3 Qualified dividend $200,835,811 $1,382,388 $354,365 $2,805,707 $3,553,081 Average Per Return $1,385 $674 $976 $1,016 $2,914 State Rank (1 is highest) 48 36 33 2 Business or profession net income $309,555,008 $2,992,588 $940,480 $4,804,997 $1,846,717 Average Per Return $2,134 $1,459 $2,590 $1,740 $1,514 State Rank (1 is highest) 44 7 27 42 Net capital gain (less loss) in AGI $610,338,742 $3,822,141 $785,466 $7,167,657 $3,050,202 Average Per Return $4,208 $1,864 $2,163 $2,596 $2,501 State Rank (1 is highest) 45 40 31 34 Taxable individual retirement
distributions $230,308,309 $2,547,408 $439,179 $5,151,221 $1,428,711 Average Per Return $1,588 $1,242 $1,210 $1,865 $1,172 State Rank (1 is highest) 42 43 6 46 Taxable pensions and annuities in
AGI $604,905,788 $9,021,665 $1,755,121 $12,677,347 $4,389,581 Average Per Return $4,171 $4,399 $4,834 $4,591 $3,600 State Rank (1 is highest) 17 7 11 41 Unemployment compensation $70,529,321 $501,047 $245,256 $822,639 $465,313 Average Per Return $486 $244 $675 $298 $382 State Rank (1 is highest) 44 8 40 29 Taxable social security benefits in
AGI $221,888,250 $3,111,546 $414,585 $4,731,937 $1,856,927 Average Per Return $1,530 $1,517 $1,142 $1,714 $1,523 State Rank (1 is highest) 32 50 13 31 Partnership/S-corp net income (less
loss) $535,203,164 $6,111,508 $1,398,025 $7,393,748 $3,049,801 Average Per Return $3,690 $2,980 $3,850 $2,677 $2,501 State Rank (1 is highest) 34 19 37 40 Individual retirement arrangement
payments $11,376,414 $118,340 $25,893 $184,330 $83,295 Average Per Return $78 $58 $71 $67 $68 State Rank (1 is highest) 50 30 39 36 Taxable income $6,394,098,925 $68,739,193 $16,890,637 $103,905,586 $41,591,094 Average Per Return $44,089 $33,517 $46,519 $37,627 $34,106 State Rank (1 is highest) 44 14 31 43 Total tax liability $1,249,910,771 $12,253,999 $3,201,674 $19,600,765 $7,267,637 Average Per Return $8,619 $5,975 $8,818 $7,098 $5,960 State Rank (1 is highest) 42 16 28 43
Major Components of Federal Adjusted Gross
Income by State for Tax Year 2012
SOURCE: IRS, Statistics of Income Division, Individual Master File System, December 2013. Calculations by South Carolina Revenue and Fiscal Affairs Office.
Appendix Page 19
Appendix Table 1:
Selected Components of IncomeNumber of returns
Adjusted gross income (AGI) Average Per Return
Rank (1 is highest) Salaries and wages in AGI
Average Per Return State Rank (1 is highest) Taxable interest
Average Per Return State Rank (1 is highest) Ordinary dividends
Average Per Return State Rank (1 is highest) Qualified dividend
Average Per Return State Rank (1 is highest) Business or profession net income Average Per Return
State Rank (1 is highest) Net capital gain (less loss) in AGI Average Per Return
State Rank (1 is highest) Taxable individual retirement distributions
Average Per Return State Rank (1 is highest) Taxable pensions and annuities in AGI
Average Per Return State Rank (1 is highest) Unemployment compensation Average Per Return State Rank (1 is highest) Taxable social security benefits in AGI
Average Per Return State Rank (1 is highest)
Partnership/S-corp net income (less loss)
Average Per Return State Rank (1 is highest) Individual retirement arrangement payments
Average Per Return State Rank (1 is highest) Taxable income
Average Per Return State Rank (1 is highest) Total tax liability
Average Per Return State Rank (1 is highest)
[Money amounts, other than averages, are in thousands of dollars]
CALIFORNIA COLORADO CONNECTICUT DELAWARE FLORIDA
16,909,110 2,450,150 1,741,480 434,150 9,226,420 $1,179,870,752 $164,960,975 $159,120,924 $25,866,607 $528,156,687 $69,777 $67,327 $91,371 $59,580 $57,244 9 11 2 18 27 $813,389,148 $112,766,329 $104,535,878 $18,394,247 $328,394,671 $48,104 $46,024 $60,027 $42,368 $35,593 7 11 1 16 42 $15,059,077 $2,063,265 $2,323,284 $239,222 $10,299,281 $891 $842 $1,334 $551 $1,116 9 12 2 36 5 $32,823,301 $4,644,807 $5,445,935 $629,001 $23,412,599 $1,941 $1,896 $3,127 $1,449 $2,538 9 11 2 25 5 $25,032,622 $3,573,917 $4,084,052 $496,358 $17,542,780 $1,480 $1,459 $2,345 $1,143 $1,901 12 15 4 24 6 $50,987,832 $5,441,535 $5,943,117 $631,101 $15,776,557 $3,015 $2,221 $3,413 $1,454 $1,710 2 13 1 45 31 $96,469,009 $13,586,420 $13,141,950 $862,971 $53,616,008 $5,705 $5,545 $7,546 $1,988 $5,811 8 9 3 44 7 $25,428,498 $4,298,098 $4,031,625 $818,545 $20,081,683 $1,504 $1,754 $2,315 $1,885 $2,177 26 12 1 5 2 $68,061,417 $10,894,755 $8,056,514 $2,409,389 $40,998,433 $4,025 $4,447 $4,626 $5,550 $4,444 27 15 8 2 16 $11,918,739 $1,059,517 $1,348,585 $205,805 $2,752,945 $705 $432 $774 $474 $298 6 20 3 17 39 $22,927,225 $3,320,149 $3,357,966 $911,731 $16,861,365 $1,356 $1,355 $1,928 $2,100 $1,828 41 42 3 1 4 $70,711,006 $9,978,474 $12,086,659 $1,045,107 $38,502,499 $4,182 $4,073 $6,940 $2,407 $4,173 14 16 3 41 15 $1,523,304 $225,473 $168,680 $30,032 $678,556 $90 $92 $97 $69 $74 16 15 10 33 28 $821,323,497 $119,420,982 $118,769,188 $17,949,405 $387,041,410 $48,573 $48,740 $68,200 $41,344 $41,949 11 10 2 22 19 $171,069,306 $22,895,166 $26,434,139 $3,287,583 $75,951,916 $10,117 $9,344 $15,179 $7,572 $8,232 7 12 1 23 17
Major Components of Federal Adjusted Gross
Income by State for Tax Year 2012
SOURCE: IRS, Statistics of Income Division, Individual Master File System, December 2013. Calculations by South Carolina Revenue and Fiscal Affairs Office.
Appendix Page 20
Appendix Table 1:
Selected Components of IncomeNumber of returns
Adjusted gross income (AGI) Average Per Return
Rank (1 is highest) Salaries and wages in AGI
Average Per Return State Rank (1 is highest) Taxable interest
Average Per Return State Rank (1 is highest) Ordinary dividends
Average Per Return State Rank (1 is highest) Qualified dividend
Average Per Return State Rank (1 is highest) Business or profession net income Average Per Return
State Rank (1 is highest) Net capital gain (less loss) in AGI Average Per Return
State Rank (1 is highest) Taxable individual retirement distributions
Average Per Return State Rank (1 is highest) Taxable pensions and annuities in AGI
Average Per Return State Rank (1 is highest) Unemployment compensation Average Per Return State Rank (1 is highest) Taxable social security benefits in AGI
Average Per Return State Rank (1 is highest)
Partnership/S-corp net income (less loss)
Average Per Return State Rank (1 is highest) Individual retirement arrangement payments
Average Per Return State Rank (1 is highest) Taxable income
Average Per Return State Rank (1 is highest) Total tax liability
Average Per Return State Rank (1 is highest)
[Money amounts, other than averages, are in thousands of dollars]
GEORGIA HAWAII IDAHO ILLINOIS INDIANA
4,335,320 665,320 679,220 6,077,090 3,029,600 $235,414,406 $36,814,360 $33,823,445 $403,120,062 $157,568,594 $54,302 $55,333 $49,797 $66,334 $52,010 35 30 46 12 41 $174,746,053 $25,693,038 $23,567,978 $279,560,083 $114,939,024 $40,308 $38,618 $34,699 $46,002 $37,939 24 29 47 12 35 $2,059,413 $353,437 $489,257 $4,583,122 $1,330,186 $475 $531 $720 $754 $439 43 38 16 13 46 $5,405,921 $811,808 $791,087 $11,491,503 $2,750,925 $1,247 $1,220 $1,165 $1,891 $908 34 37 41 12 47 $4,289,253 $617,993 $619,547 $8,933,477 $2,099,638 $989 $929 $912 $1,470 $693 34 40 43 13 47 $6,197,532 $1,501,567 $1,068,042 $11,795,289 $4,251,682 $1,430 $2,257 $1,572 $1,941 $1,403 47 12 38 22 49 $10,176,696 $1,759,512 $2,160,397 $26,224,728 $5,528,914 $2,347 $2,645 $3,181 $4,315 $1,825 37 30 23 13 48 $5,571,908 $971,396 $969,961 $10,962,498 $4,317,160 $1,285 $1,460 $1,428 $1,804 $1,425 40 29 30 8 31 $16,813,187 $3,480,554 $2,713,350 $27,227,346 $10,611,187 $3,878 $5,231 $3,995 $4,480 $3,503 34 4 31 14 46 $1,484,066 $340,156 $320,824 $3,529,768 $1,241,854 $342 $511 $472 $581 $410 35 14 18 12 24 $5,559,957 $1,187,486 $999,938 $8,857,111 $4,501,475 $1,282 $1,785 $1,472 $1,457 $1,486 46 6 36 38 34 $13,814,458 $1,340,244 $2,568,022 $24,258,711 $9,508,931 $3,186 $2,014 $3,781 $3,992 $3,139 28 46 20 17 29 $270,928 $56,706 $64,734 $493,608 $195,402 $62 $85 $95 $81 $64 44 21 11 25 42 $156,323,937 $24,815,336 $22,477,970 $287,268,181 $106,537,639 $36,058 $37,298 $33,094 $47,271 $35,166 37 32 45 13 41 $29,718,059 $4,245,984 $3,889,394 $57,412,027 $18,834,399 $6,855 $6,382 $5,726 $9,447 $6,217 31 39 45 10 41
Major Components of Federal Adjusted Gross
Income by State for Tax Year 2012
SOURCE: IRS, Statistics of Income Division, Individual Master File System, December 2013. Calculations by South Carolina Revenue and Fiscal Affairs Office.
Appendix Page 21
Appendix Table 1:
Selected Components of IncomeNumber of returns
Adjusted gross income (AGI) Average Per Return
Rank (1 is highest) Salaries and wages in AGI
Average Per Return State Rank (1 is highest) Taxable interest
Average Per Return State Rank (1 is highest) Ordinary dividends
Average Per Return State Rank (1 is highest) Qualified dividend
Average Per Return State Rank (1 is highest) Business or profession net income Average Per Return
State Rank (1 is highest) Net capital gain (less loss) in AGI Average Per Return
State Rank (1 is highest) Taxable individual retirement distributions
Average Per Return State Rank (1 is highest) Taxable pensions and annuities in AGI
Average Per Return State Rank (1 is highest) Unemployment compensation Average Per Return State Rank (1 is highest) Taxable social security benefits in AGI
Average Per Return State Rank (1 is highest)
Partnership/S-corp net income (less loss)
Average Per Return State Rank (1 is highest) Individual retirement arrangement payments
Average Per Return State Rank (1 is highest) Taxable income
Average Per Return State Rank (1 is highest) Total tax liability
Average Per Return State Rank (1 is highest)
[Money amounts, other than averages, are in thousands of dollars]
IOWA KANSAS KENTUCKY LOUISIANA MAINE MARYLAND
1,426,710 1,323,740 1,879,100 2,011,770 631,380 2,860,930 $82,730,033 $78,767,293 $93,338,797 $110,334,415 $32,436,809 $204,384,291 $57,987 $59,504 $49,672 $54,844 $51,374 $71,440 24 20 47 32 43 6 $56,312,400 $53,934,152 $67,687,458 $77,876,879 $22,779,316 $149,275,313 $39,470 $40,744 $36,021 $38,711 $36,079 $52,177 25 20 41 28 40 4 $1,000,746 $883,258 $839,475 $1,119,827 $325,984 $1,775,547 $701 $667 $447 $557 $516 $621 18 22 45 34 40 28 $1,670,942 $2,375,311 $2,159,162 $2,670,932 $835,579 $4,387,026 $1,171 $1,794 $1,149 $1,328 $1,323 $1,533 40 17 43 31 32 22 $1,310,455 $2,010,866 $1,802,885 $2,211,472 $651,084 $3,352,660 $919 $1,519 $959 $1,099 $1,031 $1,172 42 11 38 27 31 22 $2,218,145 $2,407,914 $2,954,271 $4,099,329 $1,331,291 $6,181,856 $1,555 $1,819 $1,572 $2,038 $2,109 $2,161 40 24 39 18 16 14 $4,002,585 $4,151,097 $3,451,415 $4,978,446 $1,482,746 $7,877,256 $2,805 $3,136 $1,837 $2,475 $2,348 $2,753 28 24 47 35 36 29 $1,944,678 $2,112,639 $2,260,472 $2,342,539 $967,161 $4,296,090 $1,363 $1,596 $1,203 $1,164 $1,532 $1,502 36 19 44 47 23 27 $5,039,146 $4,728,253 $7,991,520 $7,135,318 $2,519,295 $15,718,175 $3,532 $3,572 $4,253 $3,547 $3,990 $5,494 44 42 23 43 32 3 $550,190 $445,596 $864,009 $355,637 $264,317 $1,125,032 $386 $337 $460 $177 $419 $393 28 36 19 49 22 26 $2,572,129 $2,210,130 $2,499,757 $2,302,284 $924,630 $4,565,808 $1,803 $1,670 $1,330 $1,144 $1,464 $1,596 5 16 44 49 37 23 $4,981,460 $4,944,584 $4,441,623 $9,016,941 $1,469,123 $11,063,816 $3,492 $3,735 $2,364 $4,482 $2,327 $3,867 25 21 42 8 43 18 $149,814 $114,666 $112,507 $136,378 $74,088 $215,065 $105 $87 $60 $68 $117 $75 7 20 47 37 4 27 $57,351,132 $54,684,445 $61,226,265 $77,510,084 $21,574,560 $141,436,923 $40,198 $41,311 $32,583 $38,528 $34,170 $49,437 25 23 46 28 42 9 $10,231,885 $10,180,784 $10,618,307 $14,923,098 $3,731,007 $27,987,397 $7,172 $7,691 $5,651 $7,418 $5,909 $9,783 27 21 48 25 44 8
Major Components of Federal Adjusted Gross Income
by State for Tax Year 2012
SOURCE: IRS, Statistics of Income Division, Individual Master File System, December 2013. Calculations by South Carolina Revenue and Fiscal Affairs Office.
Appendix Page 22
Appendix Table 1:
Selected Components of IncomeNumber of returns
Adjusted gross income (AGI) Average Per Return
Rank (1 is highest) Salaries and wages in AGI
Average Per Return State Rank (1 is highest) Taxable interest
Average Per Return State Rank (1 is highest) Ordinary dividends
Average Per Return State Rank (1 is highest) Qualified dividend
Average Per Return State Rank (1 is highest) Business or profession net income Average Per Return
State Rank (1 is highest) Net capital gain (less loss) in AGI Average Per Return
State Rank (1 is highest) Taxable individual retirement distributions
Average Per Return State Rank (1 is highest) Taxable pensions and annuities in AGI
Average Per Return State Rank (1 is highest) Unemployment compensation Average Per Return State Rank (1 is highest) Taxable social security benefits in AGI
Average Per Return State Rank (1 is highest)
Partnership/S-corp net income (less loss)
Average Per Return State Rank (1 is highest) Individual retirement arrangement payments
Average Per Return State Rank (1 is highest) Taxable income
Average Per Return State Rank (1 is highest) Total tax liability
Average Per Return State Rank (1 is highest)
[Money amounts, other than averages, are in thousands of dollars]
MASSACHUSETTS MICHIGAN MINNESOTA MISSISSIPPI MISSOURI
3,264,490 4,631,040 2,619,920 1,250,140 2,728,430 $260,735,756 $252,983,502 $172,341,815 $56,030,537 $148,386,175 $79,870 $54,628 $65,781 $44,819 $54,385 3 33 14 50 34 $177,006,071 $174,615,849 $122,223,877 $40,993,194 $104,565,112 $54,222 $37,706 $46,652 $32,791 $38,324 3 37 10 50 32 $3,090,153 $2,581,467 $1,885,962 $499,125 $1,678,666 $947 $557 $720 $399 $615 6 33 17 50 29 $8,051,012 $6,275,195 $3,874,017 $862,144 $5,068,302 $2,466 $1,355 $1,479 $690 $1,858 6 29 23 50 16 $6,213,350 $4,894,316 $3,054,290 $700,439 $4,372,849 $1,903 $1,057 $1,166 $560 $1,603 5 29 23 50 9 $9,716,579 $7,759,247 $4,637,993 $2,138,146 $4,590,392 $2,976 $1,675 $1,770 $1,710 $1,682 3 34 25 30 33 $21,804,823 $8,596,188 $9,338,448 $1,872,908 $5,856,314 $6,679 $1,856 $3,564 $1,498 $2,146 4 46 21 49 41 $6,555,255 $7,994,041 $4,514,366 $1,151,345 $4,214,821 $2,008 $1,726 $1,723 $921 $1,545 3 13 14 50 22 $13,070,330 $22,796,131 $9,893,338 $4,649,736 $11,314,471 $4,004 $4,922 $3,776 $3,719 $4,147 30 6 36 38 24 $2,431,105 $2,384,204 $1,087,889 $318,893 $953,907 $745 $515 $415 $255 $350 4 13 23 43 33 $5,089,864 $8,202,732 $4,321,845 $1,639,663 $4,168,386 $1,559 $1,771 $1,650 $1,312 $1,528 26 8 17 45 29 $16,974,475 $15,492,033 $11,067,327 $3,312,295 $8,346,109 $5,200 $3,345 $4,224 $2,650 $3,059 4 27 13 38 33 $286,784 $328,128 $241,633 $72,313 $189,069 $88 $71 $92 $58 $69 18 31 14 49 32 $193,753,337 $175,653,607 $121,605,291 $35,321,593 $101,561,422 $59,352 $37,930 $46,416 $28,254 $37,223 3 30 16 50 33 $40,252,103 $32,602,509 $23,135,440 $6,211,929 $18,577,897 $12,330 $7,040 $8,831 $4,969 $6,809 3 30 15 50 32
Major Components of Federal Adjusted Gross Income
by State for Tax Year 2012
SOURCE: IRS, Statistics of Income Division, Individual Master File System, December 2013. Calculations by South Carolina Revenue and Fiscal Affairs Office.
Appendix Page 23
Appendix Table 1:
Selected Components of IncomeNumber of returns
Adjusted gross income (AGI) Average Per Return
Rank (1 is highest) Salaries and wages in AGI
Average Per Return State Rank (1 is highest) Taxable interest
Average Per Return State Rank (1 is highest) Ordinary dividends
Average Per Return State Rank (1 is highest) Qualified dividend
Average Per Return State Rank (1 is highest) Business or profession net income Average Per Return
State Rank (1 is highest) Net capital gain (less loss) in AGI Average Per Return
State Rank (1 is highest) Taxable individual retirement distributions
Average Per Return State Rank (1 is highest) Taxable pensions and annuities in AGI
Average Per Return State Rank (1 is highest) Unemployment compensation Average Per Return State Rank (1 is highest) Taxable social security benefits in AGI
Average Per Return State Rank (1 is highest)
Partnership/S-corp net income (less loss)
Average Per Return State Rank (1 is highest) Individual retirement arrangement payments
Average Per Return State Rank (1 is highest) Taxable income
Average Per Return State Rank (1 is highest) Total tax liability
Average Per Return State Rank (1 is highest)
[Money amounts, other than averages, are in thousands of dollars]
MONTANA NEBRASKA NEVADA NEW HAMPSHIRE NEW JERSEY
485,250 871,940 1,289,360 679,910 4,307,560 $25,241,058 $51,884,307 $75,126,856 $44,853,272 $333,551,601 $52,017 $59,504 $58,267 $65,969 $77,434 40 19 23 13 4 $16,107,063 $35,219,834 $48,805,831 $32,022,918 $241,732,959 $33,193 $40,392 $37,853 $47,099 $56,118 49 22 36 9 2 $355,398 $568,546 $1,214,463 $875,596 $3,875,384 $732 $652 $942 $1,288 $900 15 23 7 3 8 $710,547 $1,426,723 $3,543,554 $1,278,426 $8,266,113 $1,464 $1,636 $2,748 $1,880 $1,919 24 20 4 14 10 $542,208 $1,207,301 $3,060,922 $986,718 $6,256,693 $1,117 $1,385 $2,374 $1,451 $1,452 25 18 3 17 16 $850,734 $1,278,578 $2,117,693 $2,001,239 $11,776,797 $1,753 $1,466 $1,642 $2,943 $2,734 26 43 35 4 5 $1,910,762 $3,355,424 $7,819,352 $2,622,840 $16,207,513 $3,938 $3,848 $6,065 $3,858 $3,763 15 17 5 16 19 $683,298 $1,206,233 $2,194,789 $1,314,923 $7,635,643 $1,408 $1,383 $1,702 $1,934 $1,773 33 35 16 4 11 $1,986,709 $2,729,447 $5,944,650 $2,726,146 $18,571,969 $4,094 $3,130 $4,611 $4,010 $4,311 26 49 9 29 19 $187,393 $178,546 $843,137 $254,149 $4,554,871 $386 $205 $654 $374 $1,057 27 47 9 30 1 $771,883 $1,379,998 $1,869,577 $1,192,594 $8,335,807 $1,591 $1,583 $1,450 $1,754 $1,935 24 25 39 9 2 $2,114,703 $3,865,545 $3,959,818 $1,198,471 $19,032,716 $4,358 $4,433 $3,071 $1,763 $4,418 12 9 32 50 11 $58,613 $100,385 $78,458 $69,492 $407,439 $121 $115 $61 $102 $95 3 6 46 8 12 $17,411,099 $36,163,076 $54,232,005 $32,330,598 $239,264,203 $35,881 $41,474 $42,061 $47,551 $55,545 38 21 18 12 4 $3,093,917 $6,566,785 $10,101,865 $6,097,054 $50,976,085 $6,376 $7,531 $7,835 $8,967 $11,834 40 24 19 14 4
Major Components of Federal Adjusted Gross Income
by State for Tax Year 2012
SOURCE: IRS, Statistics of Income Division, Individual Master File System, December 2013. Calculations by South Carolina Revenue and Fiscal Affairs Office.
Appendix Page 24
Appendix Table 1:
Selected Components of IncomeNumber of returns
Adjusted gross income (AGI) Average Per Return
Rank (1 is highest) Salaries and wages in AGI
Average Per Return State Rank (1 is highest) Taxable interest
Average Per Return State Rank (1 is highest) Ordinary dividends
Average Per Return State Rank (1 is highest) Qualified dividend
Average Per Return State Rank (1 is highest) Business or profession net income Average Per Return
State Rank (1 is highest) Net capital gain (less loss) in AGI Average Per Return
State Rank (1 is highest) Taxable individual retirement distributions
Average Per Return State Rank (1 is highest) Taxable pensions and annuities in AGI
Average Per Return State Rank (1 is highest) Unemployment compensation Average Per Return State Rank (1 is highest) Taxable social security benefits in AGI
Average Per Return State Rank (1 is highest)
Partnership/S-corp net income (less loss)
Average Per Return State Rank (1 is highest) Individual retirement arrangement payments
Average Per Return State Rank (1 is highest) Taxable income
Average Per Return State Rank (1 is highest) Total tax liability
Average Per Return State Rank (1 is highest)
[Money amounts, other than averages, are in thousands of dollars]
NEW MEXICO NEW YORK NORTH CAROLINA NORTH DAKOTA
905,340 9,363,750 4,287,590 353,830 $44,008,714 $699,683,832 $230,067,580 $25,107,236 $48,610 $74,723 $53,659 $70,958 48 5 38 7 $30,436,672 $460,276,877 $166,344,024 $14,881,721 $33,619 $49,155 $38,797 $42,059 48 6 27 18 $473,085 $12,965,638 $2,003,479 $245,260 $523 $1,385 $467 $693 39 1 44 19 $1,104,328 $22,200,940 $5,313,621 $409,887 $1,220 $2,371 $1,239 $1,158 38 7 35 42 $874,656 $16,844,215 $4,213,312 $328,459 $966 $1,799 $983 $928 37 7 35 41 $1,384,344 $25,308,388 $6,939,992 $808,106 $1,529 $2,703 $1,619 $2,284 41 6 36 11 $1,986,003 $74,584,063 $9,953,415 $2,144,956 $2,194 $7,965 $2,321 $6,062 39 2 38 6 $1,159,443 $14,263,813 $6,485,074 $387,083 $1,281 $1,523 $1,513 $1,094 41 24 25 48 $4,580,930 $39,901,812 $17,241,766 $924,771 $5,060 $4,261 $4,021 $2,614 5 22 28 50 $367,863 $5,464,209 $2,179,333 $69,733 $406 $584 $508 $197 25 11 15 48 $1,339,941 $15,708,448 $6,669,512 $550,830 $1,480 $1,678 $1,556 $1,557 35 15 28 27 $1,797,456 $44,732,199 $11,324,896 $2,896,199 $1,985 $4,777 $2,641 $8,185 47 6 39 1 $62,290 $869,826 $294,775 $43,773 $69 $93 $69 $124 34 13 35 2 $29,374,586 $503,021,742 $151,028,441 $19,272,941 $32,446 $53,720 $35,225 $54,469 48 6 40 5 $5,174,754 $108,861,224 $27,557,797 $3,860,139 $5,716 $11,626 $6,427 $10,910 47 5 38 6
Major Components of Federal Adjusted Gross Income
by State for Tax Year 2012
SOURCE: IRS, Statistics of Income Division, Individual Master File System, December 2013. Calculations by South Carolina Revenue and Fiscal Affairs Office.
Appendix Page 25
Appendix Table 1:
Selected Components of IncomeNumber of returns
Adjusted gross income (AGI) Average Per Return
Rank (1 is highest) Salaries and wages in AGI
Average Per Return State Rank (1 is highest) Taxable interest
Average Per Return State Rank (1 is highest) Ordinary dividends
Average Per Return State Rank (1 is highest) Qualified dividend
Average Per Return State Rank (1 is highest) Business or profession net income Average Per Return
State Rank (1 is highest) Net capital gain (less loss) in AGI Average Per Return
State Rank (1 is highest) Taxable individual retirement distributions
Average Per Return State Rank (1 is highest) Taxable pensions and annuities in AGI
Average Per Return State Rank (1 is highest) Unemployment compensation Average Per Return State Rank (1 is highest) Taxable social security benefits in AGI
Average Per Return State Rank (1 is highest)
Partnership/S-corp net income (less loss)
Average Per Return State Rank (1 is highest) Individual retirement arrangement payments
Average Per Return State Rank (1 is highest) Taxable income
Average Per Return State Rank (1 is highest) Total tax liability
Average Per Return State Rank (1 is highest)
[Money amounts, other than averages, are in thousands of dollars]
OHIO OKLAHOMA OREGON PENNSYLVANIA RHODE ISLAND
5,507,560 1,618,460 1,768,810 6,134,120 512,930 $296,950,143 $93,300,163 $99,091,267 $371,107,952 $30,401,656 $53,917 $57,647 $56,021 $60,499 $59,271 36 25 29 17 21 $211,176,554 $62,421,769 $67,572,455 $260,627,429 $21,448,672 $38,343 $38,569 $38,202 $42,488 $41,816 31 30 33 15 19 $2,397,629 $966,875 $1,213,571 $4,159,474 $334,442 $435 $597 $686 $678 $652 47 31 20 21 24 $7,013,374 $1,747,082 $2,532,511 $10,378,479 $725,343 $1,273 $1,079 $1,432 $1,692 $1,414 33 45 26 19 27 $5,631,224 $1,441,367 $1,903,238 $8,288,092 $564,918 $1,022 $891 $1,076 $1,351 $1,101 32 45 28 20 26 $9,279,257 $3,067,762 $3,553,176 $12,377,030 $1,088,654 $1,685 $1,895 $2,009 $2,018 $2,122 32 23 20 19 15 $11,074,392 $6,111,098 $5,186,896 $18,740,226 $1,518,103 $2,011 $3,776 $2,932 $3,055 $2,960 43 18 27 25 26 $8,230,025 $2,082,129 $3,183,955 $10,452,260 $726,555 $1,494 $1,286 $1,800 $1,704 $1,416 28 39 9 15 32 $25,112,244 $6,096,055 $8,146,505 $25,299,875 $2,188,530 $4,560 $3,767 $4,606 $4,124 $4,267 12 37 10 25 21 $1,982,370 $389,069 $1,219,320 $4,564,136 $463,141 $360 $240 $689 $744 $903 32 45 7 5 2 $7,338,076 $2,444,310 $3,134,005 $10,546,282 $833,865 $1,332 $1,510 $1,772 $1,719 $1,626 43 33 7 11 21 $15,119,450 $7,156,399 $5,463,730 $17,539,656 $1,604,571 $2,745 $4,422 $3,089 $2,859 $3,128 36 10 31 35 30 $358,366 $108,649 $176,671 $518,457 $44,526 $65 $67 $100 $85 $87 40 38 9 22 19 $202,953,815 $64,066,013 $65,786,871 $262,752,944 $21,074,609 $36,850 $39,585 $37,193 $42,835 $41,087 36 26 34 17 24 $37,034,311 $12,004,217 $11,917,933 $49,658,108 $3,955,122 $6,724 $7,417 $6,738 $8,095 $7,711 35 26 34 18 20
Major Components of Federal Adjusted Gross Income
by State for Tax Year 2012
SOURCE: IRS, Statistics of Income Division, Individual Master File System, December 2013. Calculations by South Carolina Revenue and Fiscal Affairs Office.
Appendix Page 26
Appendix Table 1:
Selected Components of IncomeNumber of returns
Adjusted gross income (AGI) Average Per Return
Rank (1 is highest) Salaries and wages in AGI
Average Per Return State Rank (1 is highest) Taxable interest
Average Per Return State Rank (1 is highest) Ordinary dividends
Average Per Return State Rank (1 is highest) Qualified dividend
Average Per Return State Rank (1 is highest) Business or profession net income Average Per Return
State Rank (1 is highest) Net capital gain (less loss) in AGI Average Per Return
State Rank (1 is highest) Taxable individual retirement distributions
Average Per Return State Rank (1 is highest) Taxable pensions and annuities in AGI
Average Per Return State Rank (1 is highest) Unemployment compensation Average Per Return State Rank (1 is highest) Taxable social security benefits in AGI
Average Per Return State Rank (1 is highest)
Partnership/S-corp net income (less loss)
Average Per Return State Rank (1 is highest) Individual retirement arrangement payments
Average Per Return State Rank (1 is highest) Taxable income
Average Per Return State Rank (1 is highest) Total tax liability
Average Per Return State Rank (1 is highest)
[Money amounts, other than averages, are in thousands of dollars]
SOUTH CAROLINA SOUTH DAKOTA TENNESSEE TEXAS UTAH
2,077,310 414,950 2,882,040 11,573,440 1,174,090 $103,453,955 $23,853,171 $151,027,941 $741,394,480 $68,508,709 $49,802 $57,484 $52,403 $64,060 $58,350 45 26 39 15 22 $73,215,188 $14,443,245 $109,976,563 $516,944,611 $49,743,263 $35,245 $34,807 $38,159 $44,666 $42,368 44 46 34 13 17 $893,667 $354,958 $1,551,998 $8,636,505 $715,941 $430 $855 $539 $746 $610 48 10 37 14 30 $2,466,499 $644,181 $3,266,533 $19,803,844 $1,116,001 $1,187 $1,552 $1,133 $1,711 $951 39 21 44 18 46 $1,957,041 $510,413 $2,587,207 $15,770,694 $853,764 $942 $1,230 $898 $1,363 $727 39 21 44 19 46 $2,926,952 $720,744 $7,438,765 $29,059,207 $1,509,418 $1,409 $1,737 $2,581 $2,511 $1,286 48 28 8 9 50 $4,429,727 $2,240,682 $7,460,637 $58,086,722 $4,728,988 $2,132 $5,400 $2,589 $5,019 $4,028 42 11 32 12 14 $3,380,064 $548,658 $3,734,802 $16,023,487 $1,400,104 $1,627 $1,322 $1,296 $1,385 $1,193 17 37 38 34 45 $9,429,318 $1,457,553 $10,541,118 $37,220,754 $4,321,992 $4,539 $3,513 $3,658 $3,216 $3,681 13 45 40 48 39 $719,302 $59,337 $854,443 $3,779,899 $306,457 $346 $143 $296 $327 $261 34 50 41 37 42 $3,566,739 $707,914 $4,151,503 $13,447,194 $1,503,056 $1,717 $1,706 $1,440 $1,162 $1,280 12 14 40 48 47 $4,700,501 $2,102,941 $5,289,790 $42,523,530 $5,281,568 $2,263 $5,068 $1,835 $3,674 $4,498 44 5 49 24 7 $126,440 $47,962 $171,275 $735,527 $84,132 $61 $116 $59 $64 $72 45 5 48 43 29 $67,461,378 $17,314,394 $103,392,498 $538,076,053 $44,711,641 $32,475 $41,726 $35,875 $46,492 $38,082 47 20 39 15 29 $11,891,233 $3,184,086 $19,556,485 $107,683,473 $7,817,550 $5,724 $7,673 $6,786 $9,304 $6,658 46 22 33 13 36
SOURCE: IRS, Statistics of Income Division, Individual Master File System, December 2013. Calculations by South Carolina Revenue and Fiscal Affairs Office.
Major Components of Federal Adjusted Gross Income
by State for Tax Year 2012
Appendix Page 27
Appendix Table 1:
Selected Components of IncomeNumber of returns
Adjusted gross income (AGI) Average Per Return
Rank (1 is highest) Salaries and wages in AGI
Average Per Return State Rank (1 is highest) Taxable interest
Average Per Return State Rank (1 is highest) Ordinary dividends
Average Per Return State Rank (1 is highest) Qualified dividend
Average Per Return State Rank (1 is highest) Business or profession net income Average Per Return
State Rank (1 is highest) Net capital gain (less loss) in AGI Average Per Return
State Rank (1 is highest) Taxable individual retirement distributions
Average Per Return State Rank (1 is highest) Taxable pensions and annuities in AGI
Average Per Return State Rank (1 is highest) Unemployment compensation Average Per Return State Rank (1 is highest) Taxable social security benefits in AGI
Average Per Return State Rank (1 is highest)
Partnership/S-corp net income (less loss)
Average Per Return State Rank (1 is highest) Individual retirement arrangement payments
Average Per Return State Rank (1 is highest) Taxable income
Average Per Return State Rank (1 is highest) Total tax liability
Average Per Return State Rank (1 is highest)
[Money amounts, other than averages, are in thousands of dollars]
VERMONT VIRGINIA WASHINGTON WEST VIRGINIA
321,250 3,811,070 3,244,400 788,490 $17,263,683 $265,928,739 $220,076,117 $38,110,792 $53,739 $69,778 $67,833 $48,334 37 8 10 49 $11,918,205 $192,987,373 $153,350,509 $27,817,782 $37,099 $50,639 $47,266 $35,280 38 5 8 43 $200,158 $2,393,243 $2,740,560 $334,684 $623 $628 $845 $424 27 26 11 49 $604,129 $7,146,692 $6,862,169 $592,481 $1,881 $1,875 $2,115 $751 13 15 8 49 $471,033 $5,830,256 $5,390,949 $480,897 $1,466 $1,530 $1,662 $610 14 10 8 49 $768,337 $7,614,922 $6,742,323 $1,269,920 $2,392 $1,998 $2,078 $1,611 10 21 17 37 $1,161,665 $12,354,807 $17,584,452 $916,244 $3,616 $3,242 $5,420 $1,162 20 22 10 50 $505,491 $5,991,562 $6,004,432 $823,878 $1,574 $1,572 $1,851 $1,045 20 21 7 49 $1,102,437 $21,510,593 $14,118,172 $3,384,993 $3,432 $5,644 $4,352 $4,293 47 1 18 20 $117,530 $861,120 $2,076,078 $338,354 $366 $226 $640 $429 31 46 10 21 $529,380 $6,181,963 $5,651,693 $1,201,160 $1,648 $1,622 $1,742 $1,523 18 22 10 30 $722,202 $14,085,857 $11,074,706 $1,524,360 $2,248 $3,696 $3,413 $1,933 45 22 26 48 $45,935 $291,496 $270,990 $50,885 $143 $76 $84 $65 1 26 24 41 $11,909,285 $188,610,545 $162,534,832 $25,201,786 $37,072 $49,490 $50,097 $31,962 35 8 7 49 $2,078,747 $36,817,823 $30,649,415 $4,307,299 $6,471 $9,661 $9,447 $5,463 37 9 11 49
SOURCE: IRS, Statistics of Income Division, Individual Master File System, December 2013. Calculations by South Carolina Revenue and Fiscal Affairs Office.
Major Components of Federal Adjusted Gross Income
by State for Tax Year 2012
Appendix Page 28
Appendix Table 1:
Selected Components of IncomeNumber of returns
Adjusted gross income (AGI) Average Per Return
Rank (1 is highest) Salaries and wages in AGI
Average Per Return State Rank (1 is highest) Taxable interest
Average Per Return State Rank (1 is highest) Ordinary dividends
Average Per Return State Rank (1 is highest) Qualified dividend
Average Per Return State Rank (1 is highest) Business or profession net income Average Per Return
State Rank (1 is highest) Net capital gain (less loss) in AGI Average Per Return
State Rank (1 is highest) Taxable individual retirement distributions
Average Per Return State Rank (1 is highest) Taxable pensions and annuities in AGI
Average Per Return State Rank (1 is highest) Unemployment compensation Average Per Return State Rank (1 is highest) Taxable social security benefits in AGI
Average Per Return State Rank (1 is highest)
Partnership/S-corp net income (less loss)
Average Per Return State Rank (1 is highest) Individual retirement arrangement payments
Average Per Return State Rank (1 is highest) Taxable income
Average Per Return State Rank (1 is highest) Total tax liability
Average Per Return State Rank (1 is highest)
[Money amounts, other than averages, are in thousands of dollars]
WISCONSIN WYOMING 2,778,100 301,660 $158,743,676 $29,362,666 $57,141 $97,337 28 1 $112,366,999 $12,175,291 $40,447 $40,361 21 23 $1,642,538 $382,962 $591 $1,270 32 4 $3,698,436 $1,692,321 $1,331 $5,610 30 1 $2,921,241 $1,503,985 $1,052 $4,986 30 1 $3,987,768 $518,474 $1,435 $1,719 46 29 $7,001,616 $9,523,858 $2,520 $31,571 33 1 $4,936,530 $484,949 $1,777 $1,608 10 18 $10,804,087 $1,150,227 $3,889 $3,813 33 35 $1,384,364 $97,367 $498 $323 16 38 $4,550,328 $493,994 $1,638 $1,638 19 20 $10,245,741 $2,095,726 $3,688 $6,947 23 2 $232,264 $26,939 $84 $89 23 17 $108,798,908 $20,942,668 $39,163 $69,425 27 1 $19,707,907 $3,785,620 $7,094 $12,549 29 2
Major Components of Federal Adjusted Gross
Income by State for Tax Year 2012
SOURCE: IRS, Statistics of Income Division, Individual Master File System, December 2013. Calculations by South Carolina Revenue and Fiscal Affairs Office.
Appendix
Page 29
(Numbers in Thousands)
1
New York
47,492,336
699,683,832
6.79%
22
Missouri
5,452,827
148,386,175
3.67%
2
Oregon
5,826,002
99,091,267
5.88%
23
Kansas
2,893,587
78,767,293
3.67%
3
Maryland
11,477,575
204,384,291
5.62%
24
Utah
2,466,495
68,508,709
3.60%
4
Kentucky
4,637,599
93,338,797
4.97%
25
Idaho
1,213,335
33,823,445
3.59%
5
Delaware
1,248,596
25,866,607
4.83%
26
Montana
900,180
25,241,058
3.57%
6
California
55,024,435 1,179,870,752
4.66%
27
Rhode Island
1,080,801
30401656
3.56%
7
Minnesota
7,988,084
172,341,815
4.64%
28
Nebraska
1,838,344
51,884,307
3.54%
8
Connecticut
7,371,189
159,120,924
4.63%
29
Vermont
598,450
17,263,683
3.47%
9
West Virginia
1,755,746
38,110,792
4.61%
30
Georgia
8,142,371
235,414,406
3.46%
10 Massachusetts
11,954,838
260,735,756
4.59%
31
New Jersey
11,128,418
333,551,601
3.34%
11
Ohio
13,428,718
296,950,143
4.52%
32
South Carolina
3,096,834
103,453,955
2.99%
12
North Carolina
10,383,796
230,067,580
4.51%
33
Alabama
3,118,392
104,270,067
2.99%
13
Maine
1,441,926
32,436,809
4.45%
34
Oklahoma
2,774,376
93,300,163
2.97%
14
Wisconsin
6,762,399
158,743,676
4.26%
35
Colorado
4,875,627
164,960,975
2.96%
15
Hawaii
1,540,746
36,814,360
4.19%
36
Michigan
7,346,645
252,983,502
2.90%
16
Indiana
6,097,513
157,568,594
3.87%
37
Mississippi
1,501,267
56,030,537
2.68%
17
Pennsylvania
14,312,266
371,107,952
3.86%
38
New Mexico
1,150,468
44,008,714
2.61%
18
Illinois
15,512,310
403,120,062
3.85%
39
Louisiana
2,474,606
110,334,415
2.24%
19
Virginia
10,216,148
265,928,739
3.84%
40
Arizona
3,093,904
151,832,947
2.04%
20
Arkansas
2,401,902
62,666,234
3.83%
41
North Dakota
432,527
25,107,236
1.72%
21
Iowa
3,126,638
82,730,033
3.78%
Appendix Table 2: Average Effective State Individual Income Tax Rates
for Tax Year 2012
State and
Ranking
State
Individual
Income Tax
Revenue
Federal
Adjusted
Gross
Income
Effective
Tax Rate
Sources: US Census Bureau, State and Local Government Finances by Level of Government and by State: 2012. Internal Revenue
Service, Statistics of Income Bulletin, Table 2, Individual Income and Tax Data by State and Size of Adjusted Gross Income, Tax Year
2012. Calculations by the South Carolina Revenue and Fiscal Affairs Office.
State and
Ranking
State
Individual
Income Tax
Revenue
Federal
Adjusted
Gross